"TCS Takes a COVID-Style Dive Again – Is It Time to Buy?"Price Action History:
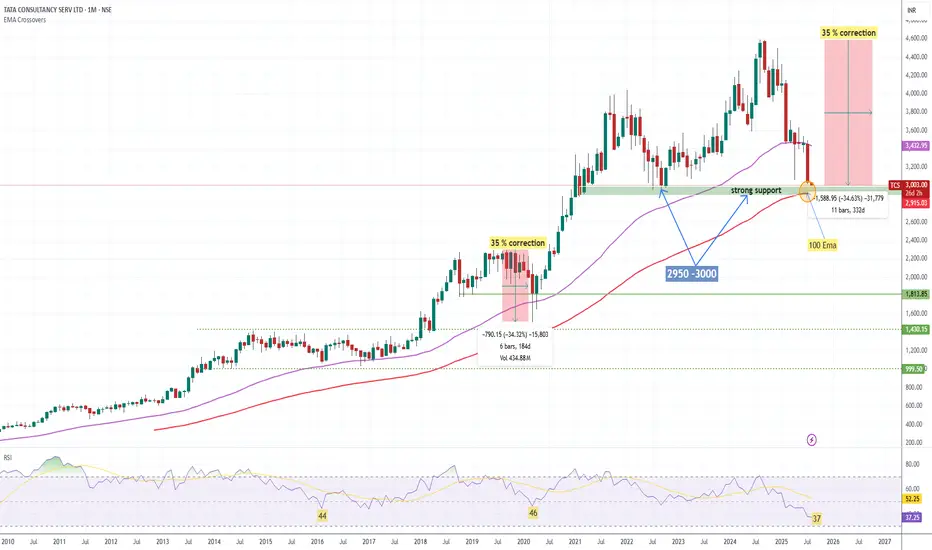
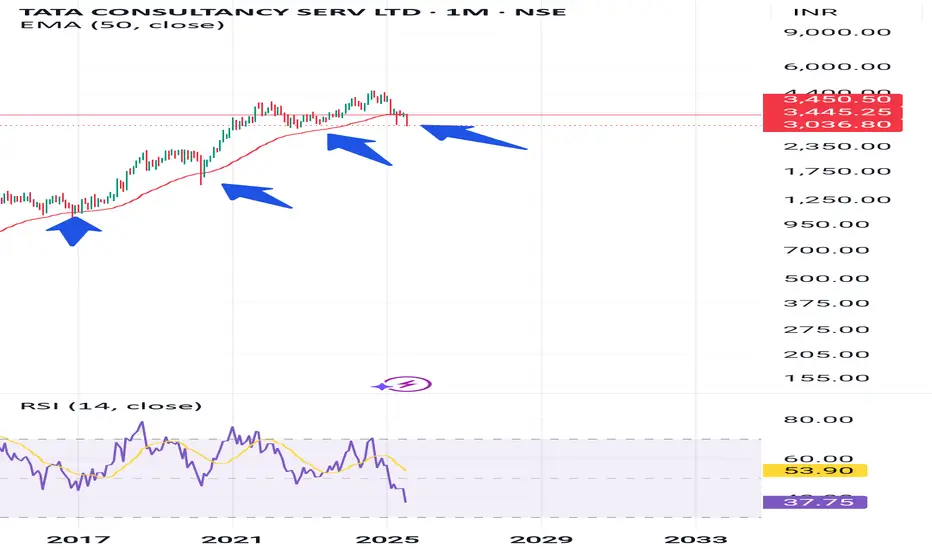
During the COVID crash, TCS fell nearly 35% from its top, eventually taking support at the 100 EMA on the monthly chart and staging a strong bounce.
In 2022 (June,july,Sep,Oct), around 3000 zone was tested multiple times, followed by a significant rally.
📊 Current Scenario:
Once again, TCS is trading near the ₹2950–₹3000 zone, which coincides with the 100-month EMA – a historically proven support level.
Price action suggests we are at a critical inflection point similar to past major bottoms.
✅ Key Technical Levels:
Support Zone: ₹2950–₹3000 (100 EMA Monthly+ 2022 support level)
Immediate Resistance: ₹3300–₹3400
Upside Potential: A bounce similar to COVID & 2022 patterns could trigger a strong upside move.
Trading Strategy:
if you are short term trader Keep a strict stop-loss below ₹2900 (monthly close basis) or 100 monthly EMA
Position sizing is key – don’t over-leverage.
🔎 Conclusion:
For long term trader This zone has historically acted as a strong accumulation area for long-term investors. If history repeats, this could be a high probability buying opportunity for swing and positional traders.
Fundamental Factor
Net Profit (Q1 FY26) ₹12,760 cr (+6% YoY)
Revenue Growth +1.3% YoY (−3.1% in CC)
Operating Margin 24.5% (↑30 bps QoQ)
Trailing P/E 22× (vs 5‑yr average ~24‑26×)
Dividend Yield 2.0%
ROE /ROCE 52%/64%
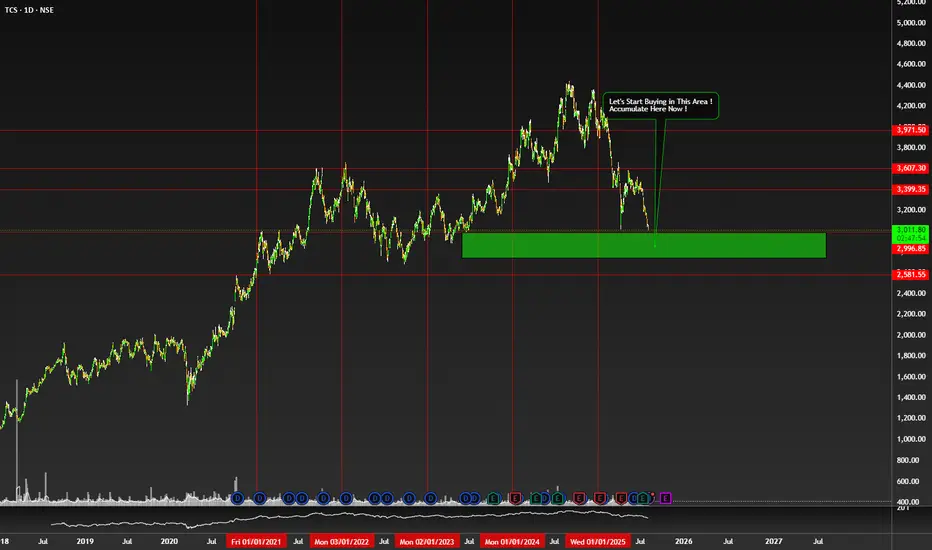
TCS trade ideas
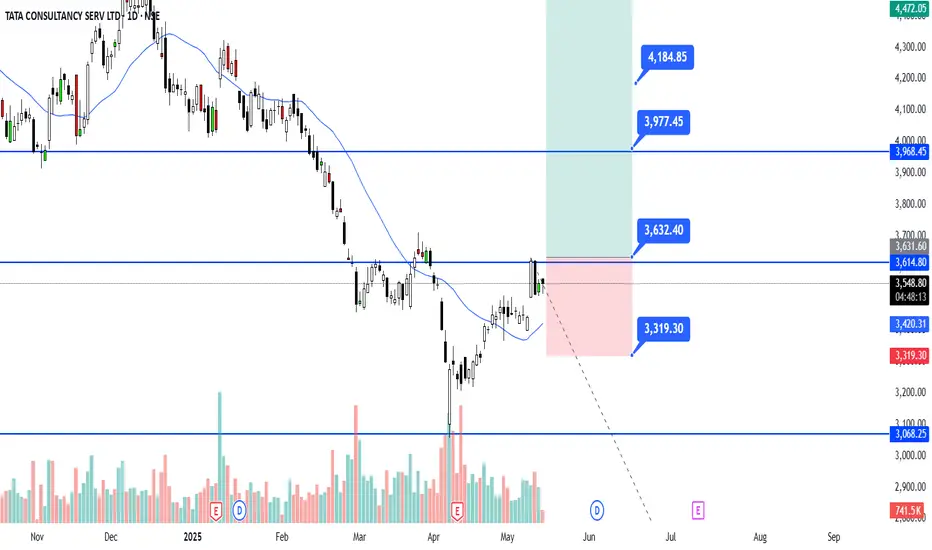
TCS near bounceTCS is near bound.. at long term support level, will bound probably to 3400 level in next 1-3 months
Time To Accumulate $NSE:TCS NSE:TCS
My Trade Opinion
Let's Accumulate here in Green area.
Best time to Buy here.
Don't Buy if Some One Think IT will Dead in india. :D
Future is at Some Time Ahead.
Don't Listen Just Observe it.
Company is Going to Aggressively Progress in Future.
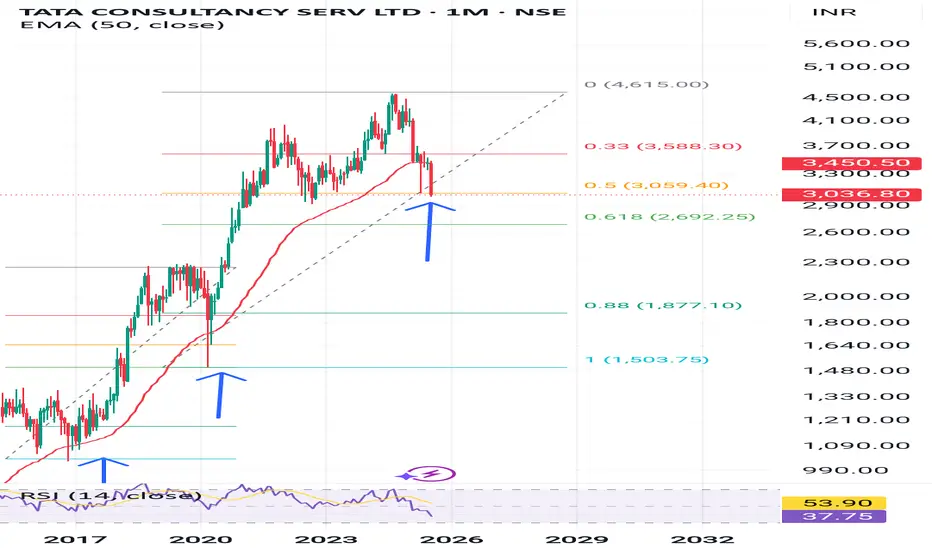
TCS Chart Analysis: Key Trends and Predictions for August 2025**TCS Historical Pullbacks Analysis and Outlook**
Tata Consultancy Services (TCS) has exhibited a remarkable long-term uptrend, punctuated by a series of significant corrections. Your chart annotation highlights a compelling technical pattern: TCS has experienced three major pullbacks of approximately **27%** each over the past decade. These deep corrections have historically been followed by periods of robust recovery and new highs.
Interestingly, your chart also marks two exceptional occasions where the stock witnessed even deeper corrections, around **34%**, the most recent of which may still be in progress. The ability of TCS to consistently bounce back after such steep declines testifies to its underlying strength, market leadership, and the confidence of long-term investors.
**Key Insights From the Chart:**
- **Three 27% Pullbacks:** Marked by distinct blue boxes, each of these corrections provided attractive accumulation opportunities, and each was followed by renewed bullish momentum.
- **Rare 34% Corrections:** These are far less frequent, indicating abnormal market stress or broader corrections, but also highlight zones of potential capitulation and renewed accumulation.
- **Current Status:** The latest price action suggests another 34% pullback may be underway or nearing completion, as marked in orange annotation.
**Strategic Takeaway:**
Given TCS’s proven track record of recovery after such corrections, investors may view these deep pullbacks as strategic buying opportunities for the long term. Patience and discipline are critical, as the stock often rewards those who accumulate during periods of pessimism.
**Conclusion:**
TCS remains a robust large-cap IT pick. Historical patterns suggest that major corrections—while unnerving—tend to precede strong rallies. Investors should watch for signs of stabilization and reversal to position themselves for the next phase of growth, always aligning choices with personal risk tolerance.

TCS nearing fibonachi support of 2700Historical Analysis of TCS for those who belive in fibonachi levels
Precious retracement of TCS happened exactly till golden ratio 61.8
This time it had already retraced till 50% level.
So buy now or wait till 61.8 levels।
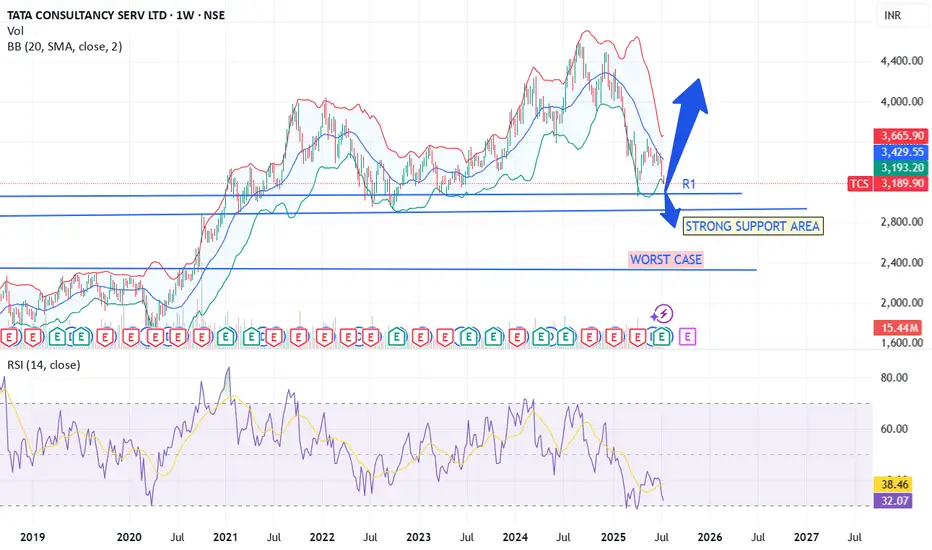
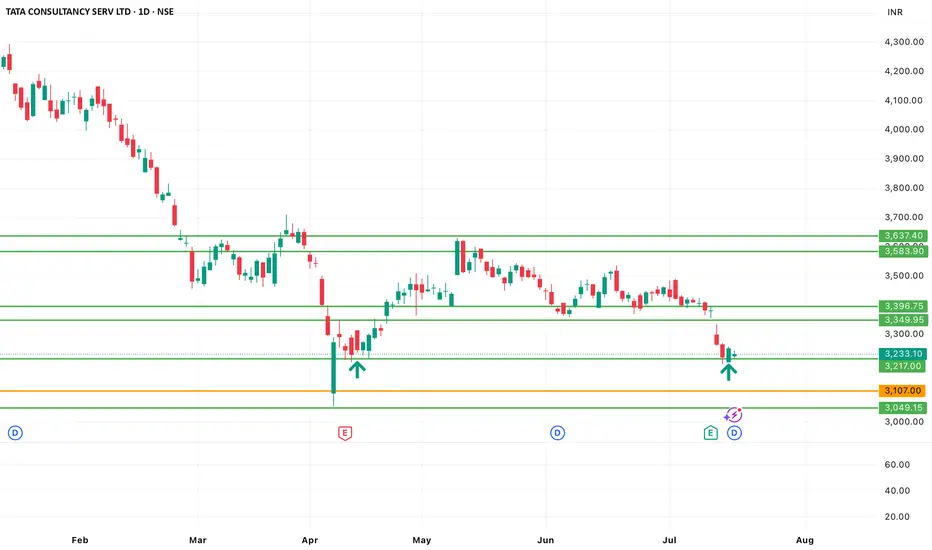
TCS Near Major Support !
TCS is approaching a critical multi-month support zone between ₹2,880–₹2,860. This level has previously acted as a reliable demand zone in June and July. A retest and breakdown below ₹2,875 may open the gates for further downside toward ₹2,810.
However, a bounce from this support — backed by volume and a strong daily close — could push the stock back to the ₹3,040–₹3,080 resistance range.
🔻 TCS – Approaching Major Support (Daily)
CMP: ₹2,890 (as of Aug 2, 2025)
Support Zone: ₹2,880 – ₹2,860
📌 Key Price Levels:
Major Support: ₹2,880 – ₹2,860
Resistance (Bounce Zone): ₹2,920
Breakdown Trigger: Below ₹2,860
Target (if breakdown): ₹2,810
Target (if bounce): ₹2,940 → ₹2,975
Stop Loss (Bounce Trade): ₹2,855
🧠 Setup Explanation:
TCS is nearing a multi-week demand zone around ₹2,880, previously tested in June and early July. Watch for price action confirmation — either a bounce with volume or a clean break below ₹2,860, which may invite further downside.

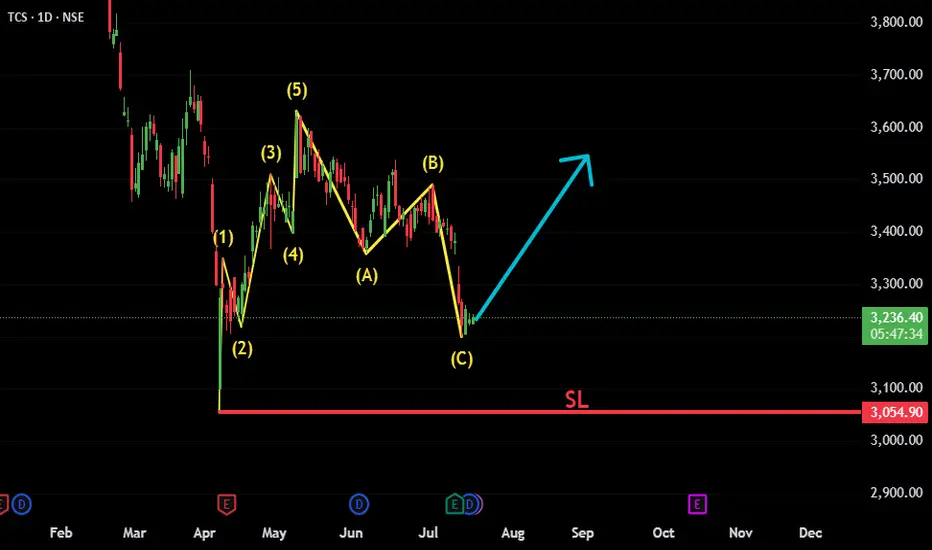
TCS: ABC Correction Complete – New Impulse Wave in FocusTCS appears to have completed a classic Elliott Wave structure, consisting of an initial 5-wave impulsive move followed by an A-B-C corrective phase. The recent price action suggests the correction has likely ended, and a new bullish impulsive move is beginning.
Fundamental trigger:
Interestingly, just a few days ago, TCS announced strong quarterly results — reporting solid profits and declaring a dividend. Despite the positive news, the stock reacted negatively and moved lower. This could have been a classic case of "good news, bad reaction" — possibly a stop-loss hunt or smart money absorbing liquidity before the next leg up.
Key technical points:
✅ Wave 1-2-3-4-5 clearly visible, forming the initial impulse.
✅ A-B-C correction appears complete with price reversing from a key support zone.
📈 Bullish structure forming; watching for confirmation with a break above recent highs.
🔍 Technicals and sentiment suggest renewed upside potential, despite short-term shakeouts.
Invalidation below recent swing low (Beginning of 1st Impulsive).
This setup offers a potential long opportunity with a favorable risk-reward
#TCS #NSE:TCS #ElliottWave #WaveAnalysis #TechnicalAnalysis #ABCCorrection #ImpulsiveWave #LongSetup #ChartAnalysis #NSEStocks #IndianStocks #Dividend #Earnings #PostEarningsMove #TrendReversal #SwingTrading #PriceAction #SmartMoney
Hunting Stop loss , near moving avg historical Support Tcs is falling due to bad quarterly results now at historical support of 50 ema , each candle is monthly candle
3000 to hold else we are going more down, target 3400-3700📝 Recent Performance
Q1 FY26
Net profit: ₹12,760 crore (↑6% YoY) .
Revenue: ₹63,437 crore (↓2.2% YoY), third consecutive quarterly decline .
Margins remained solid (~24%) .
Stock Momentum
Broke below key technical support post-Q1; could drop another ~5% .
2025 is the worst-performing sector—IT stocks down ~14%, TCS down ~21% YTD .
🌍 Key Headwinds
Global macro slowdown (geopolitical uncertainty, U.S. tariffs) dampening IT spending .
New bench policy causing employee anxiety — could affect productivity .
Client spending delays in North America, weak sectors like auto/manufacturing seen at other peers .
💡 Catalysts to Watch
Deal pipeline strength: Q1 bookings strong in BFSI & Americas — new deals worth ~$8.3 B .
AI and growth segments: TCS reported AI-infused and cloud pipelines now at ~$1.5 B .
Technical rebound: Stock approaching support/resistance zones between ₹3,150–₹3,600 .
🚀 Outlook: Will TCS Go Up?
Scenario Probability Price Outlook
Base Case 🌤 Moderate ₹3,100–₹3,600: range-bound until spending improves
Bullish Case 📈 Conditional ₹3,700+ if major IT deals (AI/cloud) accelerate
Bearish Case 📉 Possible ₹2,900–₹3,050 if global tech slowdown worsens
✅ Summary
Reason for caution: Slowing revenues, sector weakness, macro uncertainties.
Reasons for optimism: Consistent profitability, strong AI/cloud pipeline, and positive deal wins.
If global IT spending recovers (driven by AI/cloud), TCS could rebound toward ₹3,700+. Until then, it may trade in the ₹3,100–₹3,600 range.
At demand areaIn stock trading, a demand area, or demand zone, refers to a price range where buying interest is strong, potentially leading to a price increase or a price bounce. It's essentially a "buying hotspot" where buyers are actively purchasing, pushing the price upward
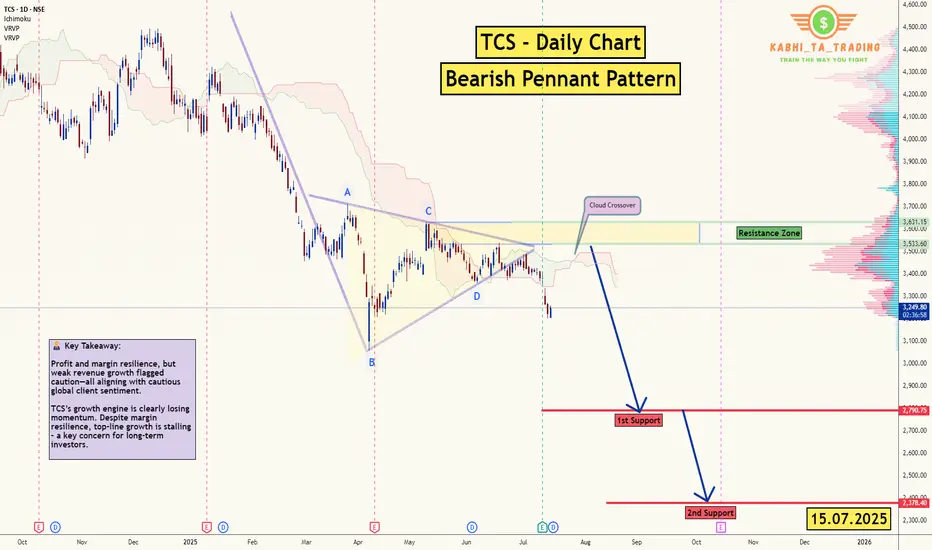
TCS - D1 - Bearish Pennant 🧾 1. 📊 Q1 FY26 Earnings Summary
i. Revenue: ₹63,437 cr (~US $7.4 bn), up just 1.3% YoY, missing expectations of ~₹64,667 cr
ii. Profit/margin held up; revenue disappointed.
📌 Key Takeaway: Profit and margin resilience, but weak revenue growth flagged caution—all aligning with cautious global client sentiment.
🔮 2. Upcoming Events & Catalysts :
Ex‑Dividend Date: Record date July 16, for interim dividend of ₹11/share.
Macro Cues: U.S. tariff developments, global IT spend trends, and sector peers (HCL, Infosys) Q2 reports. Reflation in IT services could shift sentiment.
TCS Investor Engagements: Gen‑AI STEM program (Jul 9); presence at global fintech & life‑sciences events through Sep (SIBOS, COBA) .
📆 3. Catalysts Ahead :
Global IT Budget Trends (esp. U.S. and Europe) → direction for next‑quarter bookings.
Peer Q2 Results (HCL, Infosys) → could provide broader sector cues.
New Deal Wins from BFSI/USD clients → margin & growth potential.
Macro Developments: Trade policies, Fed signals, and inflation data.
Thank you.
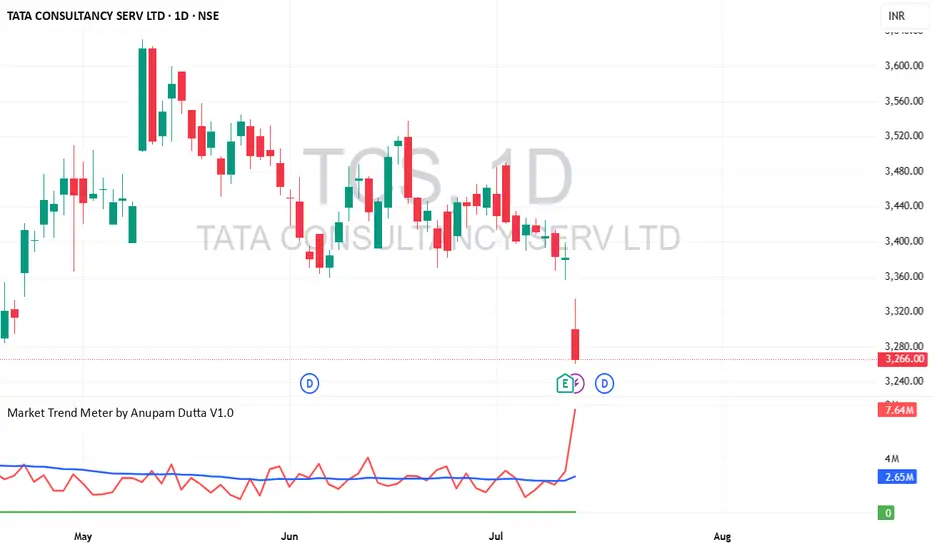
TCS Long Opportunity - Medium-Term Swing Trade📈 TCS Long Opportunity – Medium-Term Swing Trade
🔹 Entry : ₹3266 (Last Close)
🔹 Target : ₹3525
🔹 Qty : Up to 25 shares
🔹 Timeframe : ~6 months
🔹 Estimated ROI : ~16.49% annualized
A moderate-risk swing setup on Tata Consultancy Services . Technically and fundamentally aligned for gradual upside, assuming market conditions stay favorable. Entry near current levels with a well-defined target.
⚠️ Trade only if you're comfortable with the risk of capital loss. Position sizing is key.
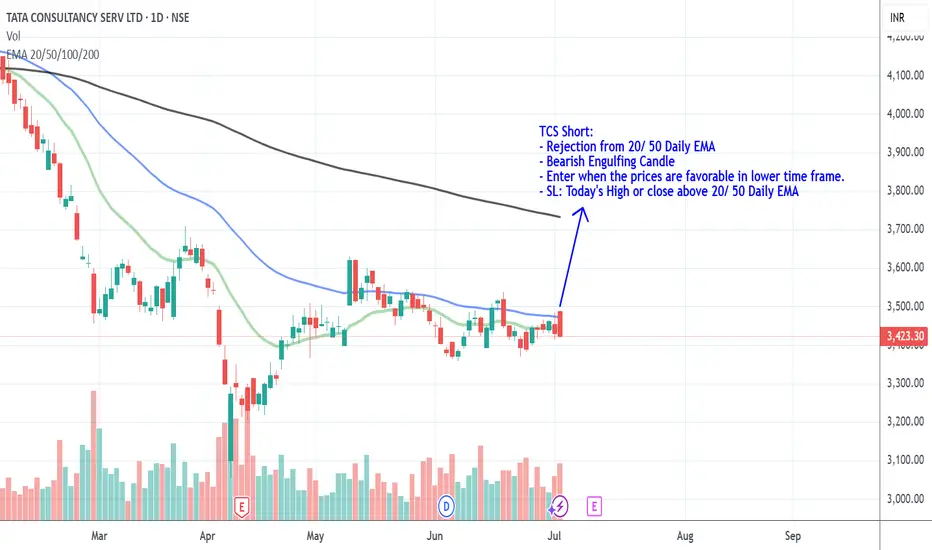
TCS Short_Rejection From 20 & 50 Daily EMATCS Short:
- Rejection from 20/ 50 Daily EMA
- Bearish Engulfing Candle
- Enter when the prices are favorable in lower time frame.
- SL: Today's High or close above 20/ 50 Daily EMA
Technical Trend Analysis of Tata Consultancy Services (TCS) Tata Consultancy Services (TCS), a leading player in the IT services sector, has recently garnered attention for its potential volume increase, making it a focal point for technical analysis.
This blog post delves into the current technical trend analysis of TCS stock (NSE: TCS) based on the 1-day chart.
Selection Rationale
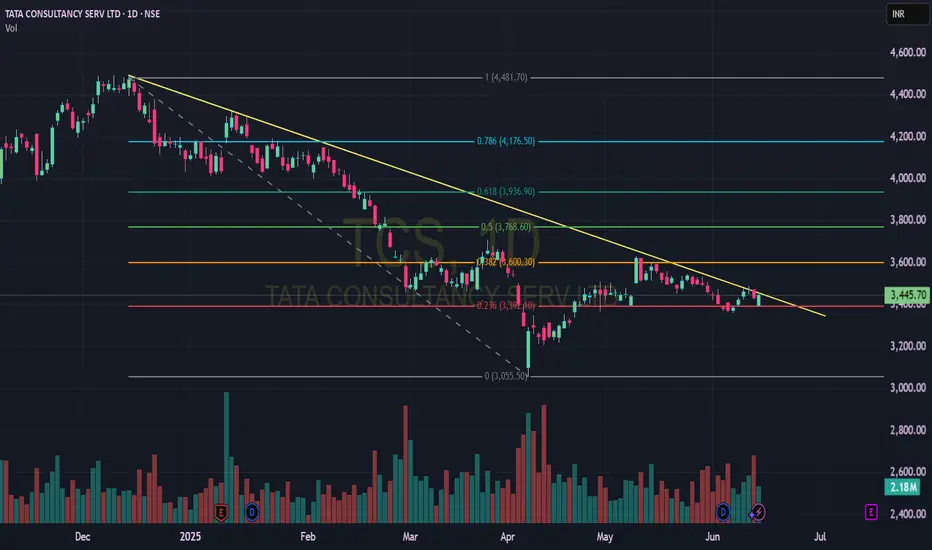
TCS was selected for this analysis due to its observed potential for increased trading volume, a critical indicator of market interest and price movement. The analysis employs a trendline drawn from the highest highs to capture the stock's directional momentum, complemented by Fibonacci retracement levels to identify key support and resistance zones.
Trendline and Fibonacci Analysis
The primary trendline, established from the peak highs, indicates a downward trajectory over the observed period. This suggests a bearish sentiment prevailing in the short term. Overlaying the Fibonacci retracement tool, the price action reveals significant support at the 0.236 level, currently aligning around INR 3,445.70. This level has historically acted as a strong support zone, where the stock price has demonstrated resilience against further declines.
Key Support and Resistance Levels
Resistance Levels: The chart highlights resistance at INR 3,660.00 (0.5 Fibonacci level), INR 3,936.90 (0.618 level), and INR 4,176.50 (0.786 level), with the upper bound nearing INR 4,600.00.
Support Levels: Beyond the current support at INR 3,445.70, additional support is noted at INR 3,200.00, with a potential downside to INR 3,055.50 if the trend continues.
Volume Insights
The volume bars at the bottom of the chart reflect intermittent spikes, particularly around key price movements. This corroborates the selection criterion of potential volume increase, suggesting that significant buying or selling pressure could influence future price action.
Conclusion
The technical analysis of TCS indicates a bearish trendline with the stock currently testing a critical Fibonacci support level at 0.236 (INR 3,445.70). Investors and traders should monitor this level closely, as a break below could signal further downside, while a rebound may indicate a reversal or consolidation. Given the potential for volume-driven movements, staying attuned to market developments will be essential for informed decision-making.
For a more comprehensive analysis or real-time updates, consider utilizing advanced tools and platforms like TradingView, and consult with a financial advisor for personalized investment strategies.
Disclaimer: This analysis is for educational purposes only and should not be considered financial advice. Always conduct your own research and consult with a professional before making investment decisions.
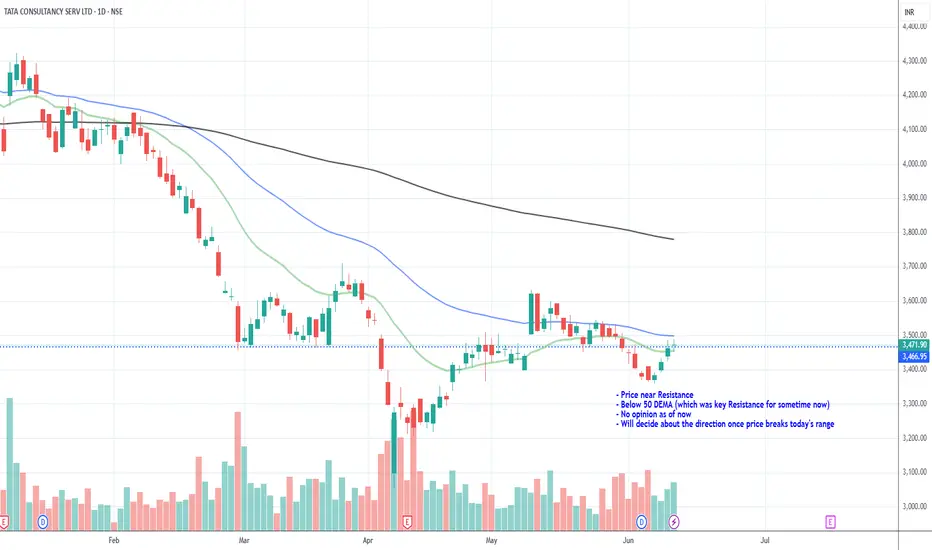
TCS_Neutral_Waiting for signal- Price near Resistance
- Below 50 DEMA (which was key Resistance for sometime now)
- No opinion as of now
- Will decide about the direction once price breaks today's range
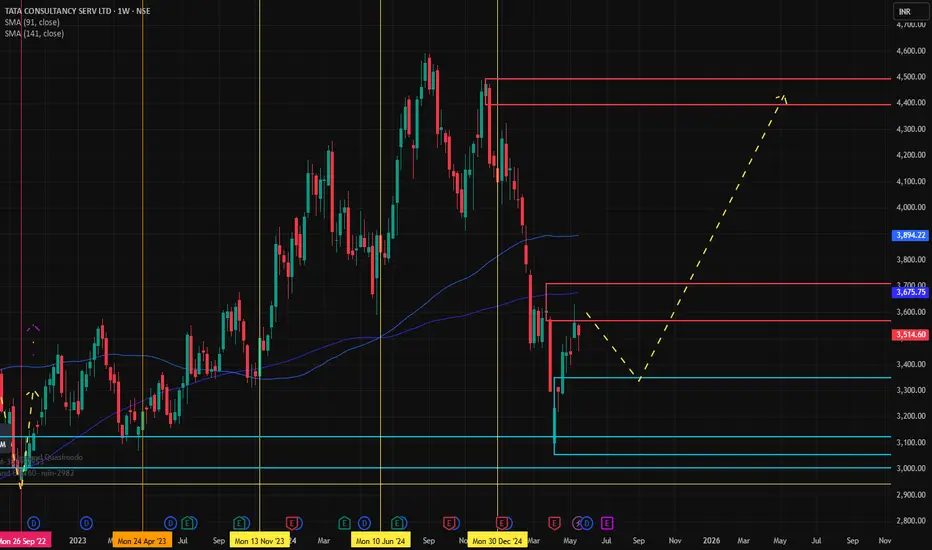
TCS Head and ShoulderTCS is forming H&S pattern for bullish momentum.
If this breakout happens a good momentum will be seen above 4100.
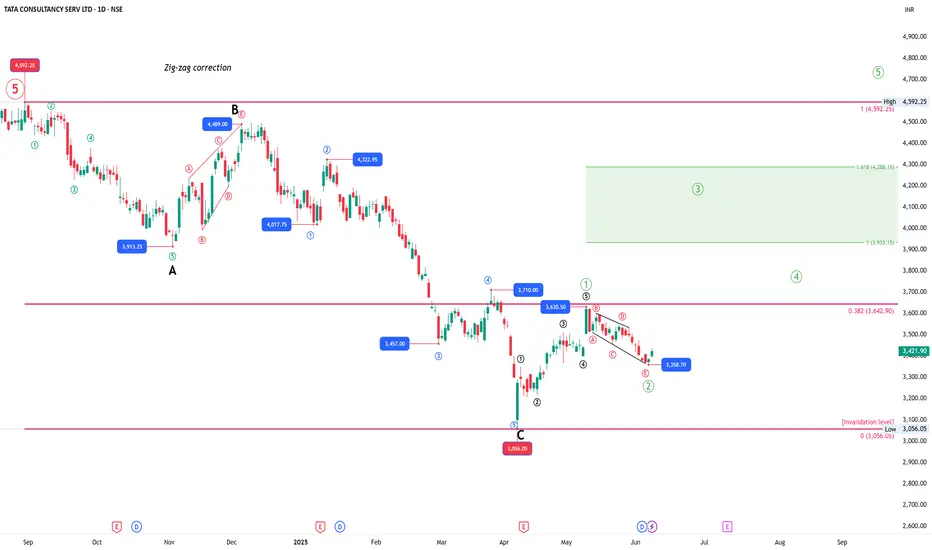
Triangle Breakout Brewing in TCS?After completing a sharp five-wave rally that ended near 4592, TCS entered a classic zigzag correction. The drop from the top formed an A-B-C pattern where Wave A brought prices to 3913, followed by a corrective bounce to 4489 for Wave B, and then a strong decline to 3056 completing Wave C. This entire move looks like a textbook zigzag correction and marks a potential end to the correction.
From the low of 3056, the stock started to recover and formed a five-wave advance, which has been marked as a smaller-degree Wave 1. What followed next is quite interesting — instead of a typical zigzag or flat for Wave 2, price moved sideways and carved out a triangle. This triangle seems to have completed with Wave E ending around 3358.
Now, with the triangle complete and prices starting to move up again, it looks like Wave 3 might have just kicked off. The key level to watch on the upside is around 3642, which is the 0.382 retracement of the previous fall. If price crosses this, it would increase confidence in the bullish structure. The projected target zone for Wave 3 lies between 3933 and 4288, depending on how strong the move gets.
The entire setup remains valid as long as price stays above the 3056 low. If that breaks, the bullish count is off the table.
Chart will be updated as price action evolves.
Disclaimer: This analysis is for educational purposes only and does not constitute investment advice. Please do your own research (DYOR) before making any trading decisions.
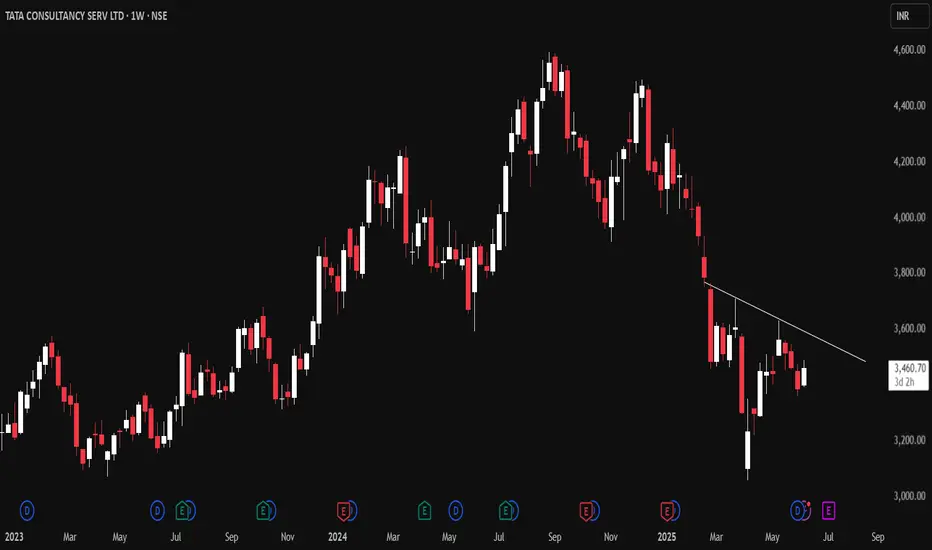
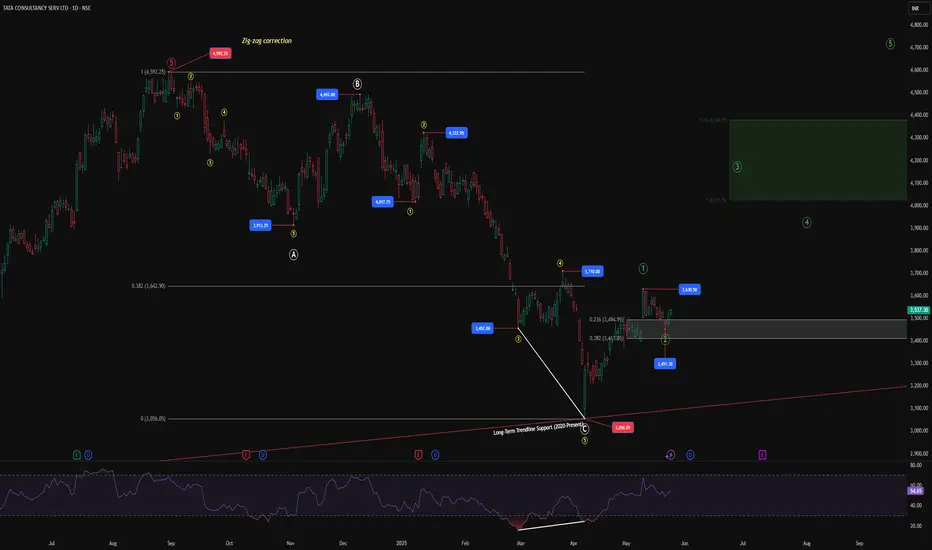
TCS – From Correction to Acceleration?TCS appears to have completed a textbook Zigzag correction (A-B-C) ending at ₹3056.05 — right at the long-term trendline support that has held since 2020.
From this base, the structure is now forming a clean impulsive sequence :
Wave 1 topped at ₹3630.50
Wave 2 retraced to ₹3451.30, holding between 0.236–0.382 retracement zones
The current rally may be the start of Wave 3, with fib projections targeting the ₹4025–4380 zone
Supporting evidence:
Strong RSI bullish divergence at the March low
Breakout above ₹3630.50 would confirm Wave 3 ignition
Invalidation:
Break below ₹3056.05 would invalidate this count and suggest a larger correction.
Tools Used : Elliott Wave, Fibonacci, RSI
Timeframe : Daily
Weekly timeframe view attached below for broader context:
This is a technical analysis for educational purposes only and not financial advice.
Part of the ongoing #WaveTracker series.
Documenting Elliott Wave progression across major stocks.
TCS📌 Trade Plan – BUY Setup
Parameter Value
Entry ₹3333
Stop Loss (SL) ₹3200
Risk ₹133
Target ₹4867
Reward ₹1534
Risk-Reward Ratio (RR) 11.5 ✅
Last High ₹4590
Last Low ₹3056
Key Trigger Daily Close above ₹3905 for trend momentum confirmation
🔎 Analysis & Interpretation
🔼 Uptrend Across All Timeframes: Solid confirmation of structural strength.
✅ Zone Confluence Around ₹3295–3349: Confirms a strong support base for long trades.
🔁 Improved SL at ₹3200: More logical buffer below Daily/Weekly demand zones, increasing probability of trade survival in noise.
📉 RR 11.5: Now a highly credible and high-probability swing trade.
🧠 Psychological Resistance Near ₹3905–4000: A breakout above this could catalyze strong upside momentum toward target ₹4867.
🟢 Verdict: Executable Trade Plan
📈 Setup Valid: Trend ✅, Zones ✅, RR ✅.
⚠️ Wait for Trigger: You may wait for momentum confirmation (Daily close > ₹3905) before full-size entry or scale-in gradually above ₹3400 with confirmation.
✅ TCS Updated Trade Setup Summary
🔍 Multi-Timeframe Demand Zone Analysis
Timeframe Trend Zone Type Proximal Distal Avg
Yearly UP RALLY-RALLY 2952 1506 2229
Half-Yearly UP RALLY-RALLY 2952 2879 2916
Quarterly UP BUFL 2952 2879 2916
HTF Average – – 2952 2421 2687
Timeframe Trend Zone Type Proximal Distal Avg
Monthly UP BUFL 2952 2879 2916
Weekly UP BUFL 3349 3056 3203
Daily UP DMIP 3347 3312 3330
MTF Average – – 3216 3082 3149
Timeframe Trend Zone Type Proximal Distal Avg
240M UP BUFL 3333 3295 3314
180M UP BUFL 3333 3295 3314
60M UP BUFL 3333 3295 3314
ITF Average – – 3333 3295 3314
TCS EASY CHARTI think this is one of the most easy chart of a stock io know what is and will happen in the stock. I will be posting details of smaller levels on this stock.
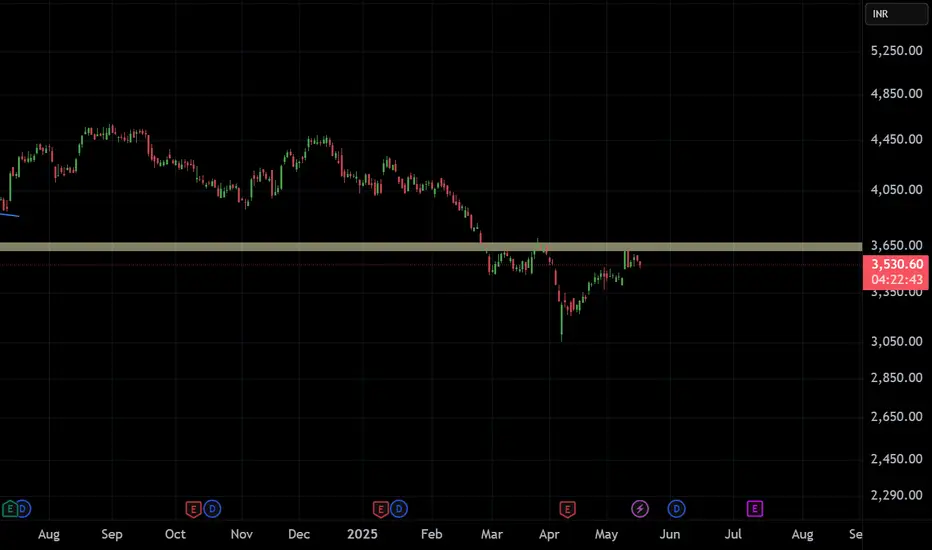
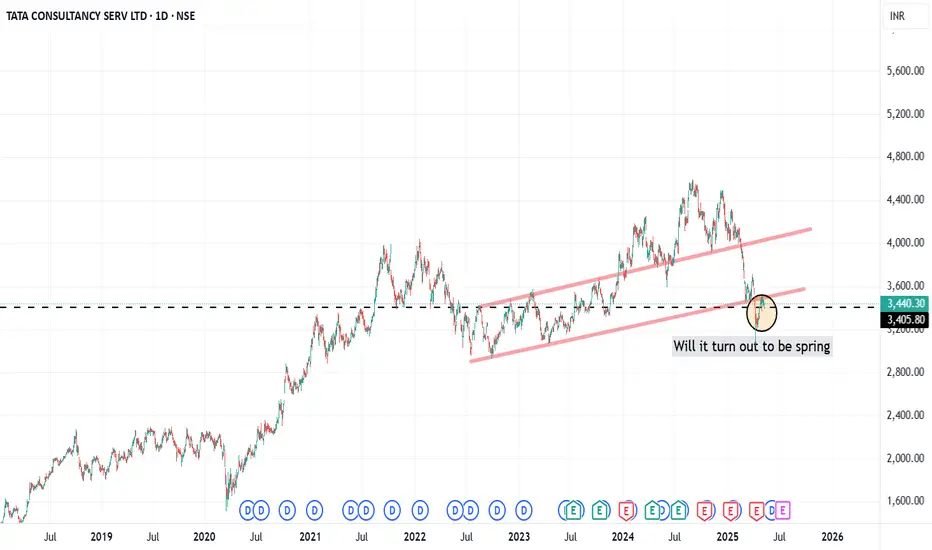
TCS .. will the breakdown turns out to be springTCS 3440 has breakdown the trend channel. Based on valuation it is trading at 25.7 less than it 10 Years P/E of 26.7.
FII's has reduced their stake to the lowest in 3 years while DII has added their stake.
On Valuation base it is good for long term investment on technical basis and 32 P/E which is for target 4250 .