Institute of Intermediation and 24 Coffee LoversWhen the market is efficient, the most efficient strategy will yield zero financial return for the investor. Therefore, firstly, it is necessary to strive to find inefficiencies in the market itself to apply a strategy that will be effective for it.
What creates market inefficiency? First, there are delays in disseminating important information about the company, such as the approval of a contract with a major customer or an accident at a plant. If current and potential investors do not receive this information immediately, the market becomes inefficient at the time such an event occurs. In other words, objective reality is not considered by market participants. This makes the stock price obsolete.
Secondly, the market becomes inefficient during periods of high volatility. I would describe it this way: when uncertainty hits everyone, emotions become the main force influencing prices. At such times, the market value of a company can change significantly within a single day. Investors have too many different assessments of what is happening to find the necessary balance. Volatility can be triggered by the bankruptcy of a systemically important company (for example, as happened with Lehman Brothers), the outbreak of military action, or a natural disaster.
Third, there is the massive action of large players in a limited market - a "bull in a china shop" situation. A great example is the story of 2021, when the Reddit community drove up the price of GameStop shares, forcing hedge funds to cover their short positions at sky-high prices.
Fourthly, these are ineffective strategies of the market participants themselves. On August 1, 2012, American stock market trading company Knight Capital caused abnormal volatility in more than 100 stocks by sending millions of orders to the exchange over a 45-minute period. For example, Wizzard Software Corporation shares rose from $3.50 to $14.76. This behavior was caused by a bug in the code that Knight Capital used for algorithmic trading.
The combination of these and other factors creates inefficiencies that are exploited by trained traders or investors to make a profit. However, there are market participants who receive their income in any market. They are above the fray and are engaged in supporting and developing the infrastructure itself.
In mathematics, there is a concept called a “zero-sum game”. This is any game where the sum of the possible gains is equal to the sum of the losses. For example, the derivatives market is a perfect embodiment of a zero-sum game. If someone makes a profit on a futures contract, he always has a partner with a similar loss. However, if you dive deeper, you will realize that this is a negative-sum game, since in addition to profit and loss, there are commissions that you pay to the infrastructure: brokers, exchanges, regulators, etc.
To understand the value of these market participants and that you are paying them well, imagine a modern world without them. There is only a company issuing shares and investors in them.
Such a company has its own software, and you connect to it via the Internet to buy or sell shares. The company offers you a quote for buying and selling shares ( bid-ask spread ). The asking price ( ask ) will be influenced by the company's desire to offer a price that will help it not lose control over the company, consider all expected income, dividends, etc. The purchase price ( bid ) will be influenced by the company's desire to preserve the cash received in the capital market, as well as to earn money on its own shares by offering a lower price. In general, in such a situation, you will most likely get a huge difference between the purchase and sale prices - a wide bid-ask spread .
Of course, the company understands that the wider the bid-ask spread , the less interest investors have in participating in such trading. Therefore, it would be advisable to allow investors to participate in the formation of quotes. In other words, a company can open its order book to anyone who wants to participate. Under such conditions, the bid-ask spread will be narrowed by bids from a wide range of investors.
As a result, we will get a situation where each company will have its own order book and its own software to connect to it. From a portfolio investor's perspective, this would be a real nightmare. In such a world, investing in not one, but several companies would require managing multiple applications and accounts for each company at the same time. This will create a demand from investors for one app and one account to manage investments in multiple companies. Such a request will also be supported by the company issuing the shares, as it will allow it to attract investors from other companies. This is where the broker comes in.
Now everything is much better and more convenient. Investors get the opportunity to invest in multiple companies through one account and one application, and companies get investors from each other. However, the stock market will still be segmented, as not all brokers will support cooperation with individual companies, for technical or other reasons. The market will be fragmented among many brokerage companies.
The logical solution would be to create another market participant that would have contracts with each of the companies and universal software for trading their shares. The only thing is that it will be brokers, not investors, who will connect to such a system. You may have already guessed that this is an exchange.
On the one hand, the exchange registers shares of companies, on the other hand, it provides access to trading them through brokers who are its members. Of course, the modern structure of the stock market is more complex: it involves clearing, depository companies, registrars of rights to shares, etc.* The formation of such institutions and their licensing is handled by a regulator, for example, the Securities and Exchange Commission in the United States ( SEC ). As a rule, the regulator is responsible for legislative initiatives in the field of the securities market, licensing of market participants, monitoring violations in the market and supporting its efficiency, protecting investors from unfair manipulation.
*Clearing services are activities to determine, control and fulfill obligations under transactions of financial market participants. Depository services - services for the storage of securities and the recording of rights to them.
Thus, by making a transaction on the exchange, we contribute to the maintenance of this necessary infrastructure. Despite the fashion for decentralization, it is still difficult to imagine how one can ensure speed, convenience and access to a wide range of assets due to the absence of an intermediary institution. The other side of the coin of this institution is infrastructure risk. You can show phenomenal results in the market, but if your broker goes bankrupt, all your efforts will be nullified.
Therefore, before choosing an intermediary, it is useful to conduct a mental survey of the person you will be dealing with. Below you will find different types of intermediaries, which I have arranged according to their distance from the central elements of the infrastructure (exchanges, clearing houses, depositories).
Prime broker
Exchange Membership: mandatory
License: mandatory
Acceptance and accounting of your funds/shares: mandatory
Order execution: mandatory
Clearing and depository services: mandatory
Marginal services: mandatory
Remuneration: commission income from trades, clearing, depository and margin services
This category includes well-known financial houses with history and high capitalization. They are easily verified through lists of exchange members, clearing and depository companies. They provide services not only to individuals, but also to banks, funds and next-level brokers.
Broker
Exchange membership: mandatory
License: mandatory
Acceptance and accounting of your funds/shares: mandatory
Order execution: mandatory
Clearing and depository services: on the prime broker side
Margin services: on the prime broker side or own
Remuneration: commission income from trades and margin services
This category includes intermediaries with a focus on order routing. They delegate participation in depository and clearing services to a prime broker. However, such brokers can also be easily verified in the lists of exchange members.
Sub-broker
Exchange Membership: no
License: mandatory
Acceptance and accounting of your funds/shares: mandatory
Order execution: on the broker or prime broker side
Clearing and depository services: on the prime broker side
Margin services: on the broker or prime broker side
Remuneration: commission income from trades
This category includes brokers who have a brokerage license in their country, but do not have membership in foreign exchanges. To provide trading services on these exchanges, they enter into agreements with brokers or prime brokers from another country. They can be easily verified by license on the website of the regulator of the country of registration.
Introducing Broker
Exchange Membership: no
License: optional, depending on the country of regulation
Acceptance and accounting of your funds / shares: no
Order execution: on the side of the sub-broker, broker or prime broker
Clearing and depository services: on the prime broker side
Margin services: on the broker or prime broker side
Remuneration: commission income for the attracted client and/or a share of the commissions paid by them
This category includes companies that are not members of the exchange. Their activities may not require a license, since they do not accept funds from clients, but only assist in opening an account with one of the top-tier brokers. This is a less transparent level, since such an intermediary cannot be verified through the exchange and regulator’s website (unless licensing is required). Therefore, if an intermediary of this level asks you to transfer some money to his account, most likely you are dealing with a fraudster.
All four categories of participants are typical for the stock market. Its advantage over the over-the-counter market is that you can always check the financial instrument on the exchange website, as well as those who provide services for its trading (membership - on the exchange website, license - on the regulator's website).
Pay attention to the country of origin of the broker's license. You will receive maximum protection in the country where you have citizenship. In case of any claims against the broker, communication with the regulator of another country may be difficult.
As for the over-the-counter market, this segment typically trades shares of small-cap companies (not listed on the exchange), complex derivatives and contracts for difference ( CFD ). This is a market where dealers rule, not brokers and exchanges. Unlike a broker, they sell you their open position, often with a lot of leverage. Therefore, trading with a dealer is a priori a more significant risk.
In conclusion, it should be noted that the institution of intermediation plays a key role in the development of the stock market. It arose as a natural need of its participants for concentration of supply and demand, greater speed and security of financial transactions. To get a feel for this, let me tell you a story.
New Amsterdam, 1640s
A warm wind from the Hudson brought the smell of salt and freshly cut wood. The damp logs of the palisade, dug into the ground along the northern boundary of the settlement, smelled of resin and new hopes. Here, on the edge of civilization, where Dutch colonists were reclaiming their homes and future fortunes from the wild forest, everything was built quickly, but with a view to lasting for centuries.
The wooden wall built around the northern border of the town was not only a defense against raids, but also a symbol. A symbol of the border between order and chaos, between the ambitions of European settlers and the freedom of these lands. Over the years, the fortification evolved into a real fortification: by 1653, Peter Stuyvesant, appointed governor of New Netherland by the West India Company, ordered the wall to be reinforced with a palisade. It was now twelve feet high, and armed sentries stood on guard towers.
But even the strongest walls do not last forever. Half a century after their construction, in 1685, a road was built along the powerful palisade. The street received a simple and logical name - Wall Street. It soon became a bustling commercial artery for the growing city. In 1699, when the English authorities had already established themselves here finally, the wall was dismantled. She disappeared, but Wall Street remained.
A century has passed
Now, at the end of the 18th century, there were no walls or guard towers on this street. Instead, a plane tree grew here - a large, spreading one, the only witness to the times when the Dutch still owned this city. Traders, dealers, and sea captains met under its shadow. Opposite the buttonwood tree stood the Tontine Coffee House, a place where not just respectable people gathered, but those who understood that money makes this world go round.
They exchanged securities right on the pavement, negotiated over a cup of steaming coffee, and discussed deals that could change someone's fate. Decisions were made quickly - a word, backed up by a handshake, was enough. It was a time when honor was worth more than gold.
But the world was changing. The volume of trades grew, and chaos demanded rules.
May 17, 1792
That spring day turned out to be decisive. Under the branches of an old buttonwood tree, 24 New York brokers gathered to start a new order. The paper they signed contained only two points: trades are made only between their own, without auctioneers, and the commission is fixed at 0.25%.
The document was short but historic. It was called the Buttonwood Agreement, after the tree under which it was signed.
Here, amid the smell of fresh coffee and ink, the New York Stock Exchange was born.
Soon, deals were being concluded under the new rules. The first papers to be traded were those of The Bank of New York , whose headquarters were just a few steps away at 1 Wall Street. Thus, under the shade of an old tree, the history of Wall Street began. A story that will one day change the whole world.
Buttonwood Agreement. A fresco by an unknown artist who adorns the walls of the New York Stock Exchange.
BAC trade ideas
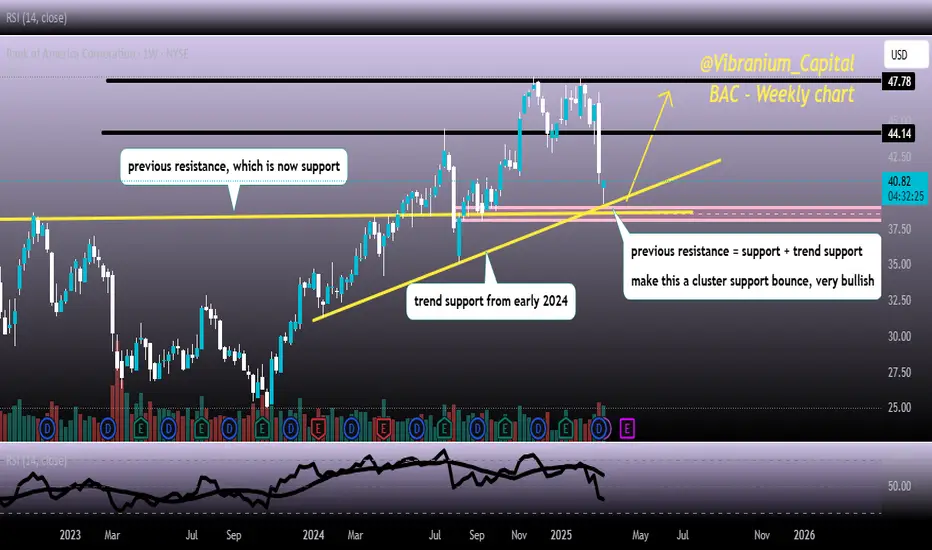
BAC with the cluster support bounceboost and follow for more 🔥
chart is very simple and clean, trend support for early 2024 + previous resistance flipped support, not to mention the extremely oversold RSI 🚀
I added BAC calls and shares under 40 yesterday, this is what I call a A+ dip entry, there's still lots of upside in my opinion...
this is my last chart for today, i will try to post more Monday, have a good weekend and be safe. Vibe out ⚡
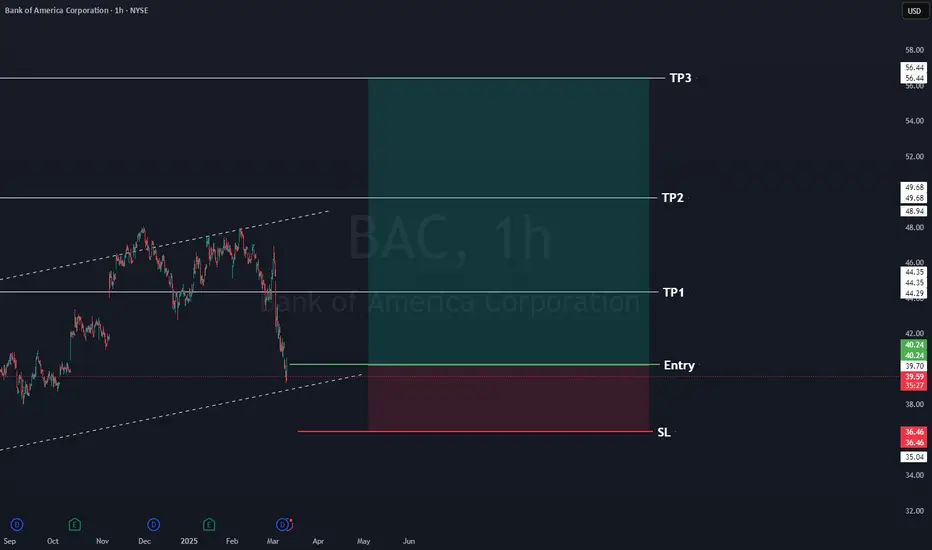
BAC Bank Of America (NAS100) Long Hi guys,
Stock Alert
Bank Of America
Symbol: BAC
🦇Entry: 40.30
⚠️SL: 36.47
✔️TP1:44.33
✔️TP2: 49.68
✔️TP3: 56.44
Happy trading, hope you are earning lots of profit.
Sarah
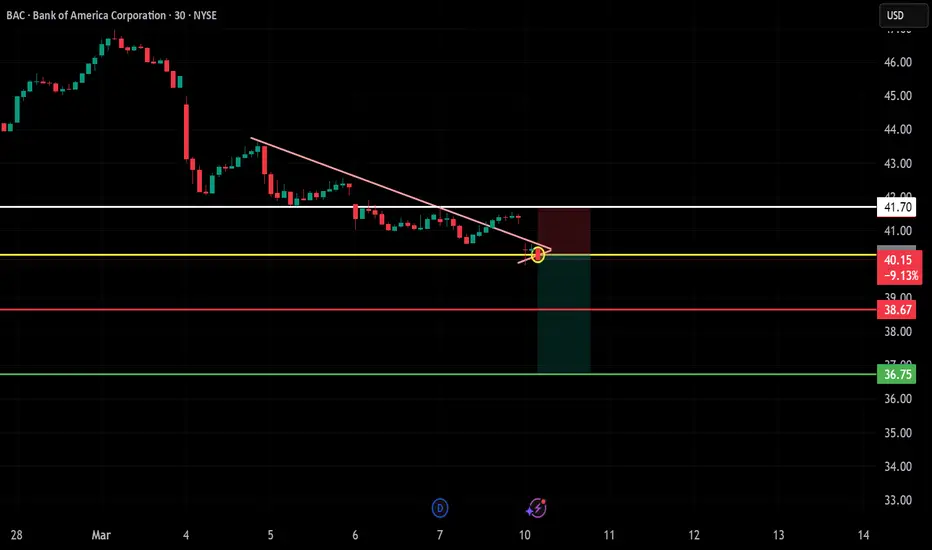
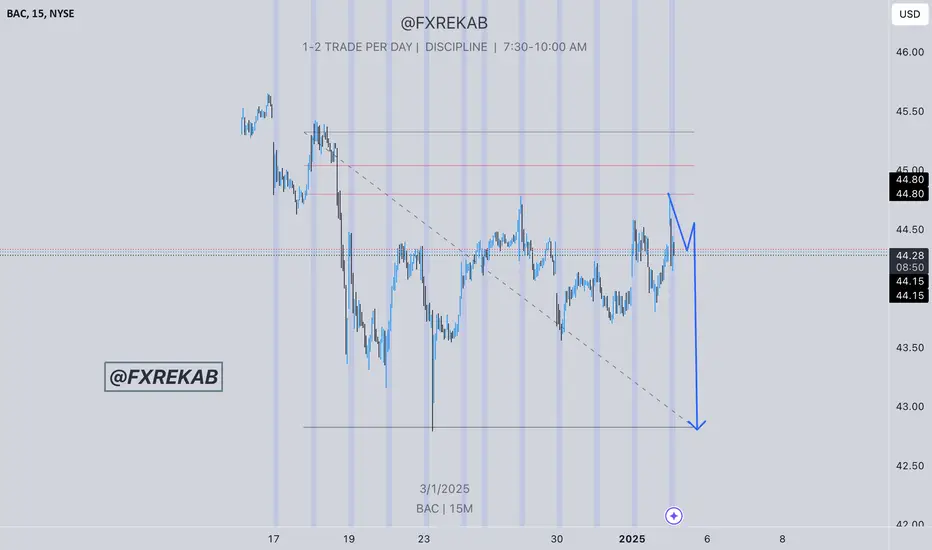
BAC – 30-Min Short Trade Setup!📉 🚀
🔹 Asset: Bank of America (BAC)
🔹 Timeframe: 30-Min Chart
🔹 Setup Type: Bearish Breakdown Trade
📌 Trade Plan (Short Position)
✅ Entry Zone: Below $40.30 (Breakdown Confirmation)
✅ Stop-Loss (SL): Above $41.70 (Invalidation Level)
🎯 Take Profit Targets:
📌 TP1: $38.67 (First Support Level)
📌 TP2: $36.75 (Extended Bearish Move)
📊 Risk-Reward Ratio Calculation
📉 Risk (SL Distance): $41.70 - $40.30 = $1.40 risk per unit
📈 Reward to TP1: $40.30 - $38.67 = $1.63 (1:1.16 R/R)
📈 Reward to TP2: $40.30 - $36.75 = $3.55 (1:2.54 R/R)
💡 Favorable Risk-Reward Ratio – Aiming for a 1:2.54 R/R at TP2.
🔍 Technical Analysis & Strategy
📌 Bearish Trendline Breakdown – The price was rejected at the descending trendline.
📌 Weak Buying Pressure – Rejection at $40.30 suggests sellers are in control.
📌 Volume Confirmation Needed – Increased selling volume below $40.30 confirms momentum.
📌 Momentum Shift Expected – If price remains below $40.30, it could decline toward $38.67, then $36.75.
📊 Key Resistance & Support Levels
🔴 $41.70 – Stop-Loss / Resistance Level
🟡 $40.30 – Breakdown Level / Short Entry
⚪ $38.67 – First Target / TP1
🟢 $36.75 – Final Target / TP2
📉 Trade Execution & Risk Management
📊 Volume Confirmation – Ensure strong selling pressure below $40.30 before entering.
📉 Trailing Stop Strategy – Move SL to breakeven ($40.30) after hitting TP1 ($38.67).
💰 Partial Profit Booking Strategy:
✔ Take 50% profits at $38.67, let the rest run to $36.75.
✔ Adjust SL to breakeven ($40.30) after TP1 is hit.
⚠️ Fake Breakdown Risk:
❌ If price moves back above $40.30, exit early to limit losses.
❌ Wait for a strong bearish candle close before entering aggressively.
🚀 Final Thoughts
✔ Bearish Setup – Breakdown signals downside potential.
✔ Momentum Shift Possible – Watch for volume confirmation.
✔ Favorable Risk-Reward Ratio – 1:2.54 R/R to TP2.
💡 Stick to the plan, manage risk, and trade smart! 📉🔥
🔗 Hashtags for Engagement:
#BankOfAmerica 📉 #BAC 📊 #StockTrading 📉 #TradingNews 📰 #MarketUpdate 🔥 #Investing 💰 #ShortTrade 📉 #Stocks 📈 #ProfittoPath 🏆 #SwingTrading 🔄 #DayTrading ⚡ #TechnicalAnalysis 📉 #StockSignals 📊 #FinancialFreedom 💡 #MarketTrends 📊 #StockAlerts 🔔 #TradeSmart 🤓 #Bearish 📉 #RiskManagement ⚠️ #TradingCommunity 🤝 #SmartTrading 💰 #MarketAnalysis 📊 #TrendBreakdown 🚀
Bank of America (BAC) Shares Drop Over 6%Bank of America (BAC) Shares Drop Over 6%
On 18 February, we reported that Warren Buffett was selling bank stocks, including Bank of America (BAC) and Citigroup (C). This proved to be a sharp decision, as yesterday:
→ Bank of America (BAC) shares fell by 6.34%
→ Citigroup (C) shares fell by 6.25%
As a result, BAC stock hit its lowest level of 2025.
Why Did Bank of America (BAC) and Citigroup (C) Shares Decline?
Investor bearish sentiment may have been driven by concerns over:
→ New US tariffs on imports from Mexico and Canada
→ The risk of renewed inflation growth amid an economic slowdown
This led to a broader decline in financial sector stocks yesterday.
Technical Analysis of Bank of America (BAC)
The chart shows that in 2024, the price was in an upward trend (illustrated by the blue channel), but the $48 level proved too strong for bulls to break. Key observations:
→ In mid-February, a bearish breakout occurred below the channel, and in early March, the same level acted as resistance
→ The $44 level has influenced the trend in the past and could now act as resistance again
→ A drop below the late-December low may indicate a Change of Character (ChoCh) pattern, signalling a potential market shift
BAC Stock Price Forecasts
Analysts remain optimistic. According to TipRanks:
→ 17 out of 19 analysts recommend buying BAC stock
→ The average 12-month price target for BAC is $53
Trade on TradingView with FXOpen. Consider opening an account and access over 700 markets with tight spreads from 0.0 pips and low commissions from $1.50 per lot.
This article represents the opinion of the Companies operating under the FXOpen brand only. It is not to be construed as an offer, solicitation, or recommendation with respect to products and services provided by the Companies operating under the FXOpen brand, nor is it to be considered financial advice.

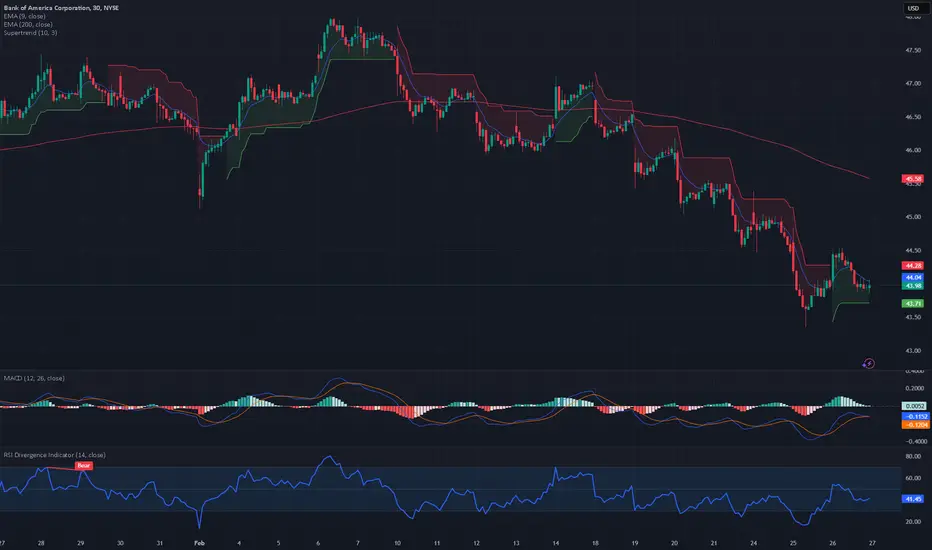
Bank of America (BAC) Scalping Strategy🔥 Market Overview:
Trend: Short-term consolidation, overall bearish bias.
Key Levels:
Resistance: $44.10, $44.50
Support: $43.70, $43.30
Indicators:
EMA9 below EMA200 → Bearish trend still in play.
MACD near zero → No strong momentum, market indecisive.
RSI at 48.87 → Neutral, no strong divergence.
Risk of Short Squeeze? Low—only if price breaks $44.10.
Market Maker Activity: Weak accumulation, still under resistance.
🔥 Scalping Strategy:
🩸 1. Momentum Scalping (If Breakout Above $44.10)
Buy near: $44.10
Target: $44.50
Stop-loss: $43.90
Risk-to-Reward: 1:2
🩸 2. Range Scalping (If Price Holds $43.70 - $44.10)
Buy near: $43.70
Sell near: $44.10
Stop-loss: $43.50
Profit Potential: ~1.2%
🩸 3. Breakout Scalping (If Below $43.70)
Short below: $43.70
Target: $43.30
Stop-loss: $43.90
Risk-to-Reward: 1:3
🔥 Mid-Term Trend Forecast (1-3 Weeks):
If $44.10 holds, BAC could push towards $44.50 - $45.00.
If $43.70 fails, expect a drop to $43.30.
🔥 News & Market Context:
Bank of America released a $585B Euro Medium-Term Note prospectus → Neutral impact.
Stock closed flat today → No significant buying or selling pressure.
Earnings in 48 days → No major catalyst in the short term.
👑 Trade Rating (1-10):
Range Scalping: 6/10 (Market is slow, needs breakout).
Momentum Long Above $44.10: 7/10 (Breakout setup, but weak momentum).
Short Below $43.70: 9/10 (Best risk-reward setup).
🔥 Decision:
🩸 Short-term Play: Range scalping $43.70 - $44.10 until a breakout.
🩸 Mid-term Play: Break above $44.10 = long; below $43.70 = short.
🩸 Ideal Play: More downside risk—short setup is stronger.
👑 Final Verdict: Weak price action, better for short plays.
🔥 LucanInvestor's Quote:
"A market that hesitates is a market ready to fall."
Bank of America Wave Analysis – 7 February 2025
- Bank of America reversed from resistance level 47.80
- Likely to fall to support level 46.00
Bank of America recently reversed down from the resistance zone located between the major resistance level 47.80 (which also stopped the earlier minor impulse wave 1 at the end of last year) and the upper weekly Bollinger Band.
The previous downward reversal from the resistance level 47.80 created the daily Japanese candlesticks reversal pattern Evening Star.
Given the strength of the resistance level 47.80 and the bearish divergence on the daily RSI, Bank of America can be expected to fall to the next support level 46.00.

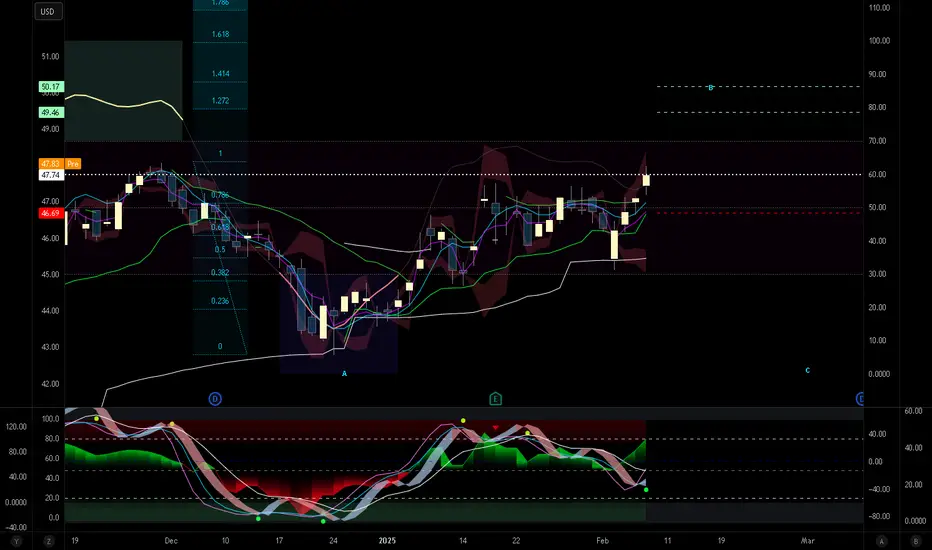
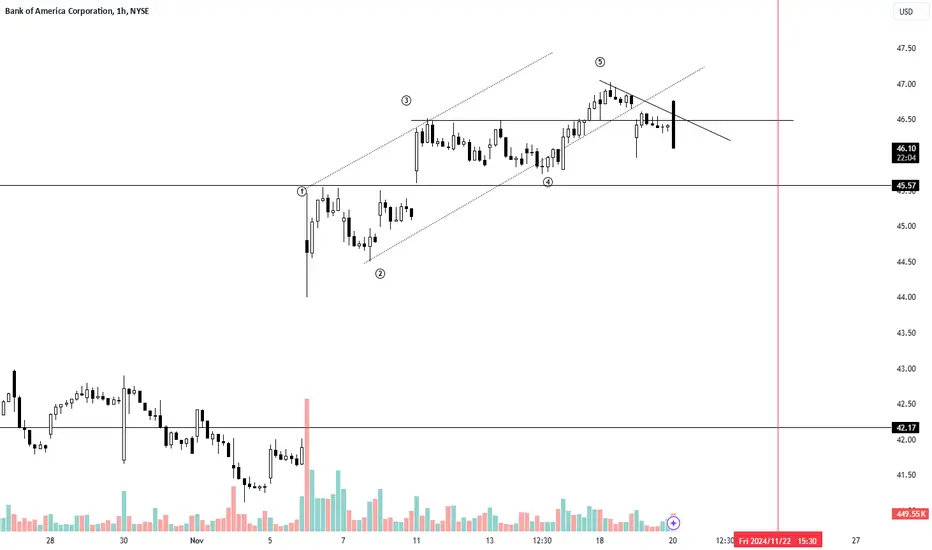
What is Up with Bank of America? BACBetting on an extended B wave here. The indicators are reflective of the recent upward price action and in agreement wit the idea of more upward momentum and volatility. Usually extended B Waves, when confirmed go to 1.2 Fib extension, never surpassing the 1.618 figure. This classic teaching sure proved to be accurate in our practice. Good luck!
Speculative Madness: The Market’s Bubble Stocks Some stocks areSpeculative Madness: The Market’s Bubble Stocks
Some stocks aren't just overvalued—they're in full speculative bubble mode. Fundamentals? Irrelevant. When euphoria takes over, rationality disappears.
Here’s my list of bubble stocks that scream unsustainable pricing:
SBUX, T, PLTR, BMY, PYPL, NFLX, GS, ISRG, ARM, C, SHOP, BSX, SPOT, UBS, IBKR, RELX, CEG, CRWD, MSTR, MMM, DASH, COF...
And let’s not forget the obvious: TSLA, META, AMZN, AVGO, GOOGL, JPM, MA, V, WMT.
Honestly, the entire banking sector, brokers, and tech are in bubble territory.
What the hell is going on with this market? Why are algos just buying, buying, buying, squeezing all the shorts?! Unbelievable.
The dump will be insannnnnnnne!!! 🚨
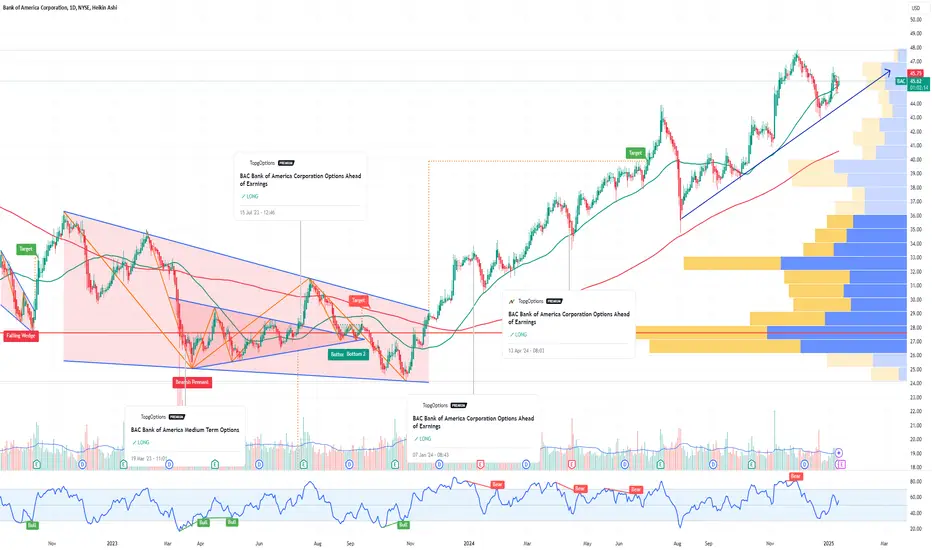
BAC Bank of America Corporation Options Ahead of EarningsIf you haven`t bought BAC before the recent rally:
Now analyzing the options chain and the chart patterns of BAC Bank of America Corporation prior to the earnings report this week,
I would consider purchasing the 47usd strike price Calls with
an expiration date of 2025-2-7,
for a premium of approximately $0.89.
If these options prove to be profitable prior to the earnings release, I would sell at least half of them.
A strategic long position for BOFA as potential gains emerge- Key Insights: Bank of America is navigating through a bullish market trend yet
is hyper-aware of impending volatility. Maintain a close eye on key entry
points as earnings reports approach. Support levels at $41.30 may provide a
buffer against pullbacks, while resistance is positioned at $49.30, making
strategic long positions viable for the short term.
- Price Targets: Next week targets: T1: $47.50, T2: $49.00. Stop levels: S1:
$44.00, S2: $41.00.
- Recent Performance: Bank of America has shown resilience amidst market
fluctuations, recently trading in line with broader S&P 500 trends. However,
it has also mirrored a slight downturn of over 1.5% in the wake of pending
earnings announcements, indicating susceptibility to broader market
corrections.
- Expert Analysis: Analysts advise caution in new trades due to possible market
pullbacks, particularly given Bank of America’s earnings on the horizon.
Market sentiment remains mixed, influenced by broader economic aspects and
external factors like UK borrowing costs affecting currency trading. Brian
Moynihan’s transformative leadership has helped steady the bank during
turbulent times.
- News Impact: The impending earnings reports from a cadre of major financial
institutions, including Bank of America, are anticipated to pivot market
dynamics. Additionally, speculation about integrating cryptocurrencies
within Bank of America’s operations is attracting attention and could
symbolize a forward-looking approach to innovation in banking, further
refining investor sentiment.
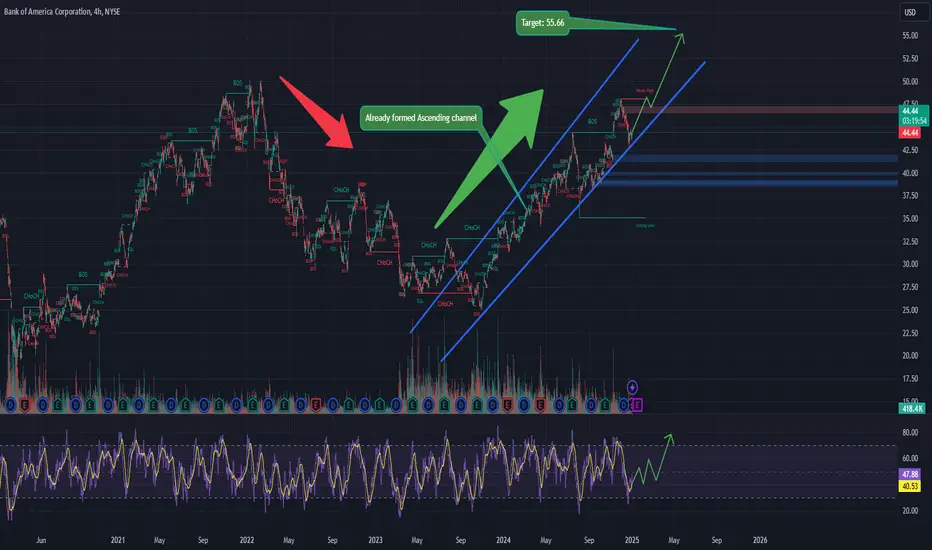
Bank of America - Follow up on already great bull run?Hi guys, today we are starting with an overview of Bank of America.
Fundamentals :
Bank of America is positioned for a strong financial year in 2025 due to several factors: anticipated economic growth, Fed interest rate cuts stimulating loan demand, and significant growth in net interest income from well-managed portfolios. The bank expects a boost in investment banking and trading revenues, supported by regulatory changes and market activity. Additionally, technological innovation and a shift toward an "asset-light" economy are seen as long-term growth drivers. Positive analyst outlooks further reinforce confidence in its prospects for the year.
Technicals : Currently from 2023 until and through 2024 , BAC has had a fantastic ascending year, with good revenue which showcased a great Ascending channel formulating. Currently I want the gap which was a strong resistance to be tested again, so we can move forward to the higher levels.
Entry: 44.50
Target 55.60
As always my friends happy trading!
P.S. If you have questions or inquiries about one of my existing set-ups or personal questions / 1 on 1 sessions consider joining my community so you can follow up with me in private!
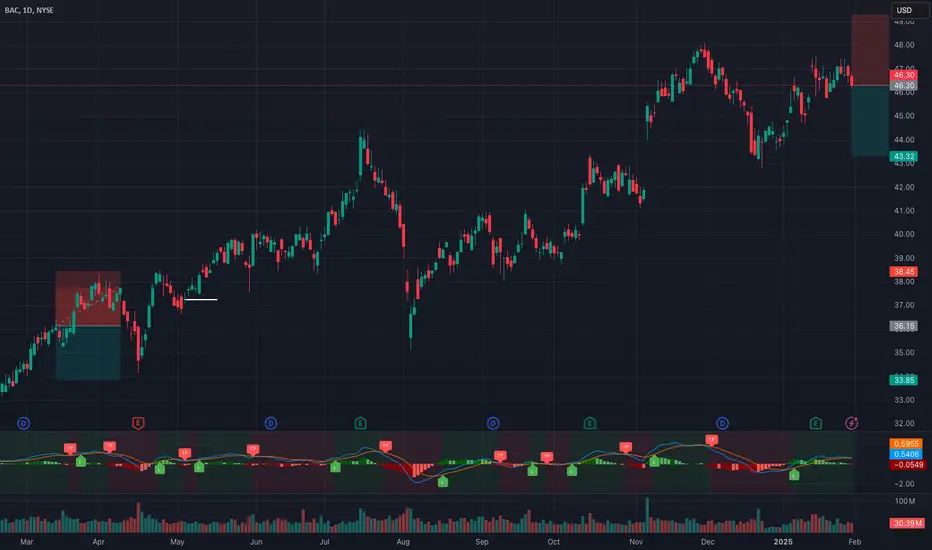
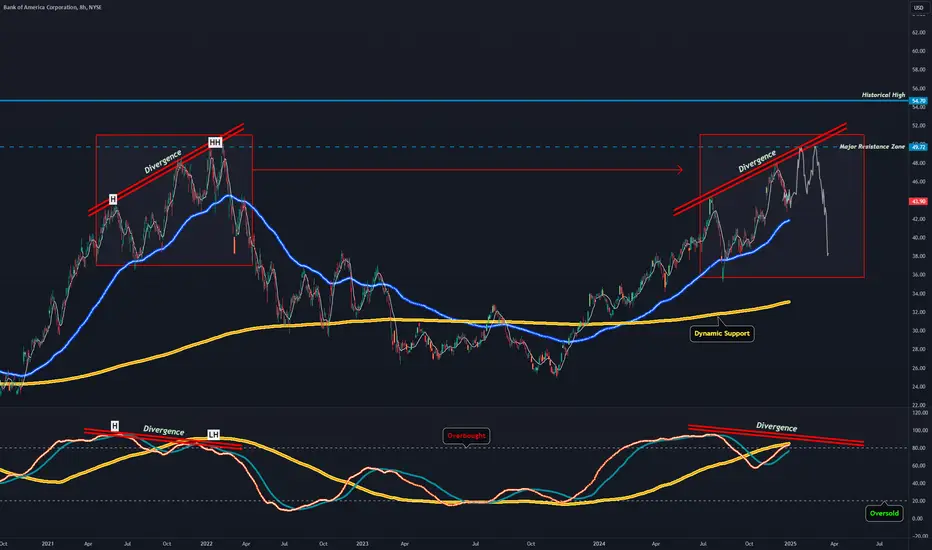
BAC | BIG Drop for Next YearSimilar distribution pattern to 2022 Feb drop, price continues to make Higher Highs and indicators make Lower Highs while trading in overbought zones
Dont think its the best time to invest but to rather Trade instead with how high price is.
I'm looking at about 40% in price fall by February like the last time but for now long positions may be better at $43, and then price topping out at $50.
To prolong this pattern but not necessarily invalidate it I need to see a breakout above $50 and some type of quick retest with price action overshooting to the high end of the Major Resistance Zone $55, then we can end up seeing more than a 40% drop.
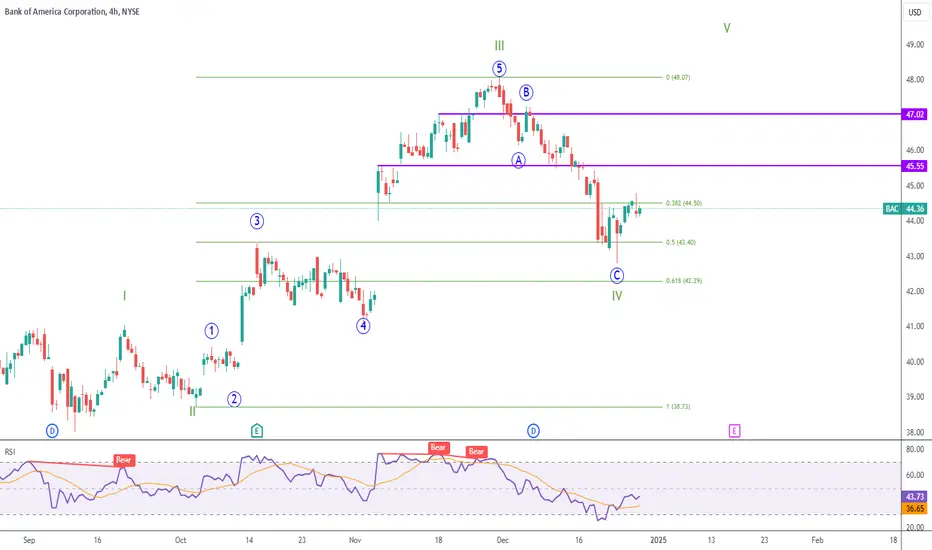
BAC Targeting New Highs?
Bulls are showing reaction in the 50% pullback level, which could be the beginning of green wave V.
Even if we don't see new highs, I do believe we should see an upside correction targeting the 2 purple lines.
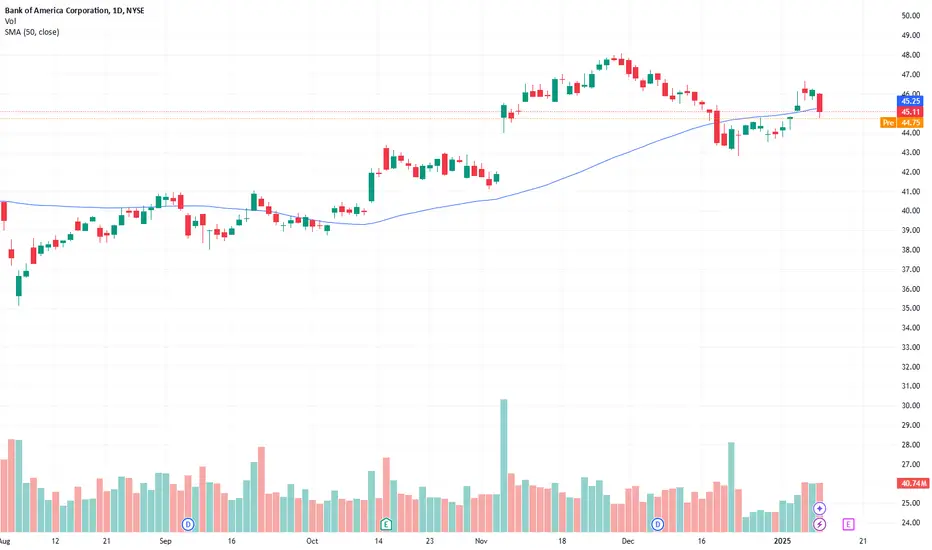
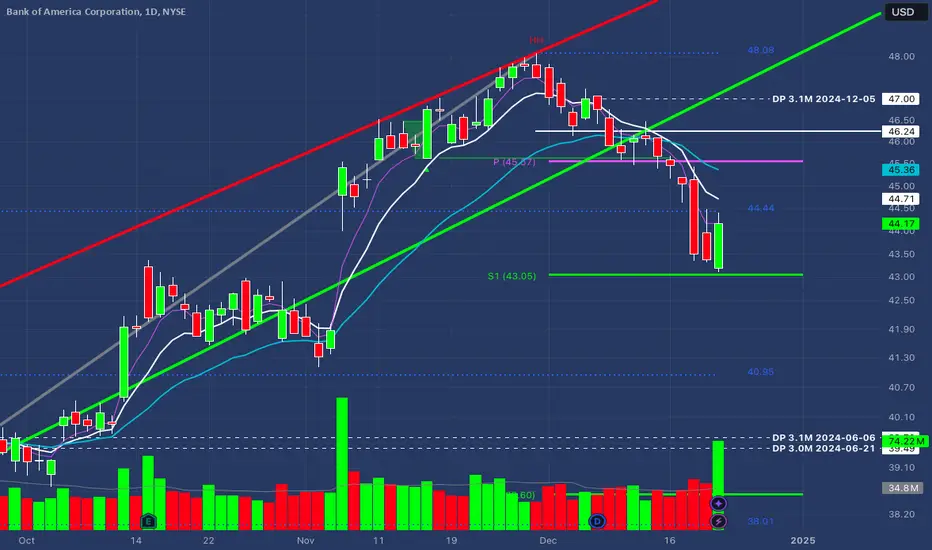
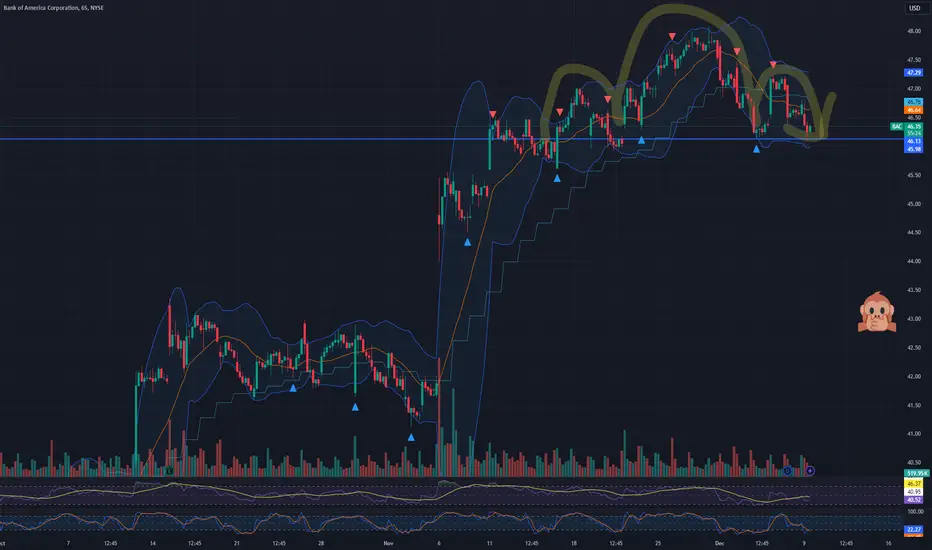
$BAC Trade AnalysisThe daily chart for BAC shows a downtrend within a broader bullish channel. The recent price action has broken below critical short-term moving averages (8 EMA and 21 EMA) and is currently testing a key support level at S1 (43.05). The chart includes pivot points, trendlines, and dark pool activity, which provide additional context for potential price movements.
Key Observations:
1. Trend Analysis:
Uptrend Channel: The long-term green trendline remains intact, suggesting the broader uptrend is still valid.
Short-Term Downtrend: A lower high (LH) and a series of bearish candles indicate short-term downward momentum. The price is below the 8 EMA and 21 EMA, confirming bearish bias in the short term.
2. Support and Resistance:
Resistance Levels:
Pivot (45.87): The first resistance level, aligning with the 8 EMA.
46.24: A significant resistance level near the 21 EMA.
47.00: A dark pool level that may act as a ceiling if price rebounds strongly.
Support Levels:
S1 (43.05): Immediate support and current price zone.
40.95: Historical support level, providing further downside protection.
S2 (38.60): A critical support zone aligning with dark pool levels and prior lows.
3. Volume Analysis:
Recent volume spikes on red candles suggest distribution, but the bounce on the most recent green candle (December 20) indicates potential accumulation near support at 43.05.
4. Dark Pool Levels:
47.00: A dark pool print from December 5, marking potential institutional resistance.
39.70–39.49: Significant dark pool activity from earlier in the year, which may act as a magnet if price continues lower.
5. Moving Averages:
The price is below both the 8 EMA and 21 EMA, indicating bearish momentum.
A recovery above these moving averages would signal a potential trend reversal.
Trade Setup:
Scenario 1: Bullish Reversal from S1 (43.05)
Trigger: A strong bounce off S1 with price reclaiming the 8 EMA (~45.36) would confirm bullish momentum.
Profit Targets:
45.87 (Pivot): First resistance level and a key target for a short-term trade.
47.00: Dark pool resistance level.
48.08: The upper range of the recent downtrend and potential long-term target.
Stop-Loss: Below 42.50, as a break below S1 invalidates the bullish setup.
Scenario 2: Bearish Breakdown Below S1 (43.05)
Trigger: A daily close below 43.05 with increased volume would signal bearish continuation.
Profit Targets:
40.95: Previous low and historical support.
39.70–39.49: Dark pool levels and a strong institutional support zone.
38.60 (S2): Key pivot support for a deeper downside move.
Stop-Loss: Above 44.50, as a move back above this level would signal recovery.
Scenario 3: Consolidation Before Directional Move
If the price remains range-bound between 43.05 and 45.87, traders can look for breakout trades in either direction. Volume and candlestick patterns will be key indicators.
Final Thoughts:
Short-Term Outlook: Watch for price action at 43.05. A bounce with strong volume would favor a bullish trade, while a breakdown opens the door for further downside.
Long-Term Outlook: The green trendline suggests that the broader uptrend remains valid. A deeper pullback into dark pool levels (~39.50) could offer long-term buying opportunities.
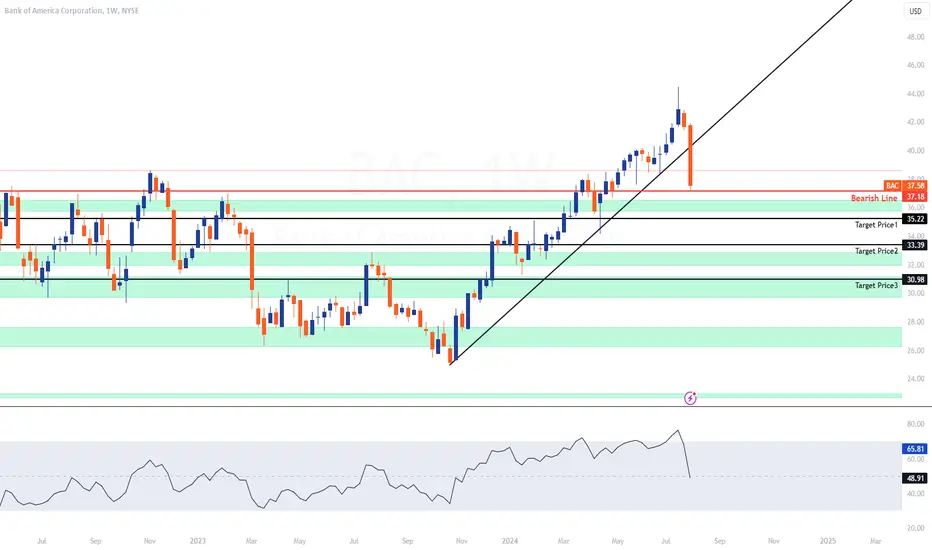
BAC | SHORTNYSE:BAC
Technical Analysis of Bank of America Corporation (BAC)
Key Observations:
Current Price Action:
Price: $37.58
Recent Drop: -1.92 (-4.86%)
Support and Resistance Levels:
Immediate Support: $37.18 (Bearish Line)
Further Supports: $36.00 (Target Price 1), $35.22 (Target Price 2), $33.39 (Target Price 3), and $30.98 (Target Price 4)
Resistance: The price recently broke below a support level at around $41.78.
Trendlines:
The price has broken below a key upward trendline, indicating a potential shift from a bullish to a bearish trend.
Relative Strength Index (RSI):
Current RSI: 48.91
The RSI shows a decline, indicating increasing selling pressure but still in a neutral zone.
Target Prices:
Target Price 1: $36.00
This level is the immediate support and a potential first target for any continued downward movement.
Target Price 2: $35.22
If the price breaks below the immediate support, the next target is around $35.22, a previous support level.
Target Price 3: $33.39
Further downside could see the price reaching $33.39, another key support level.
Target Price 4: $30.98
In a more bearish scenario, the price could fall to $30.98, a significant support level.
Summary:
Bank of America Corporation (BAC) has experienced a significant drop, breaking below a key support level and its upward trendline. The next levels to watch are $37.18, $36.00, $35.22, $33.39, and $30.98. The RSI indicates potential for further declines if market conditions remain negative.
$BAC Head N Shoulder Top into Gap Fill? (Just Technicals)NYSE:BAC with pretty clean H & S top...
Not playing, doesn't fit my current narrative.
But this is how Eye Spot them, catch that ;p
- Prophecies_U_Can
Bank of America WK longsHey guys hope you doing great.
BAC showing longs on wk time frame as we can see a very nice pcp pattern formed there which looks fresh and healthy.
Minimum we can take day trades upto level height.
Wait for it ✌

A compelling week ahead for trading BOFARecent Performance: Bank of America (BOFA) has seen notable activity recently,
trading at $47.51 amidst broader market volatility. The financial sector's
resilience has bolstered BOFA, even as caution is warranted due to potential
corrections. There appears to be an underlying bullish sentiment, indicating
investor confidence.
- Key Insights: Current market dynamics suggest a strategic approach to BOFA is
essential. Investors should focus on recognizing buying opportunities
following broader market pullbacks. Identifying support and resistance
levels will be critical for timing trades—maintaining vigilance around the
support area of $42.76 to $45.50 and the resistance point at $50.00.
- Expert Analysis: Experts convey a bullish outlook for BOFA, particularly with
projected growth in the financial sector by 2025. Financial analysts
emphasize integrating systematic investment methods, encouraging investors
to remain alert to fluctuations that may present favorable trading
prospects. The prevailing sentiment hints at resilience, suggesting it may
be prudent to adopt a proactive trading strategy.
- Sentiment Analysis: Current sentiment is rated at 60.0, a notable improvement
from last week's 0, showing a positive shift in market perception with 26
total mentions that reflect growing interest in BOFA.
- Price Targets: Based on analysis, key price targets for the upcoming week are
as follows:
- Next week targets: T1 at $49.00, T2 at $50.00
- Stop levels: S1 at $45.50, S2 at $42.76
These levels conform to the outlined trading rules, creating a possible range
for strategic positions.
- News Impact: Several influential factors could sway BOFA's performance,
including potential changes in global economic conditions, particularly with
discussions around BRICS nations and their financial implications.
Additionally, any updates on the Federal Reserve's interest rate projections
will significantly impact the banking sector's trajectory. Positive trends
from major competitors like JP Morgan further highlight the potential for
gains in the sector, possibly benefiting BOFA as investor focus sharpens.
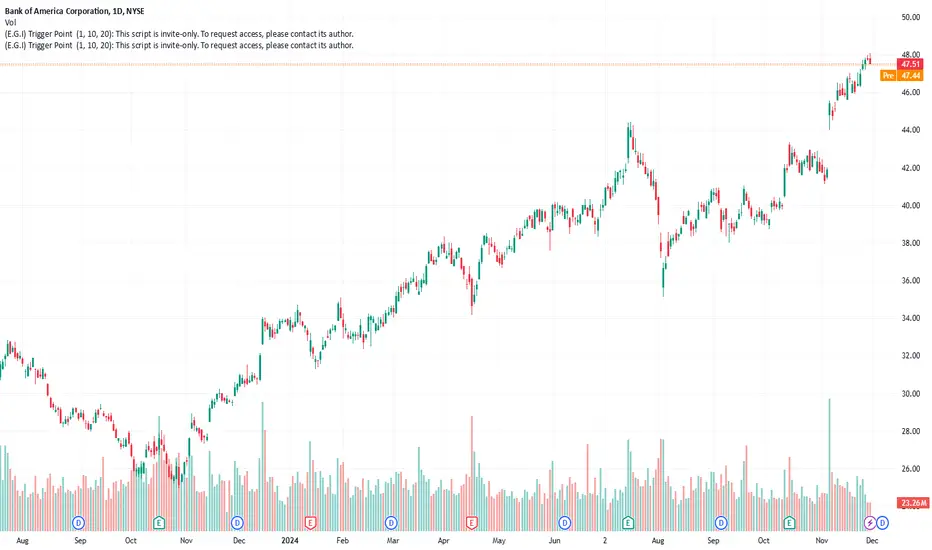
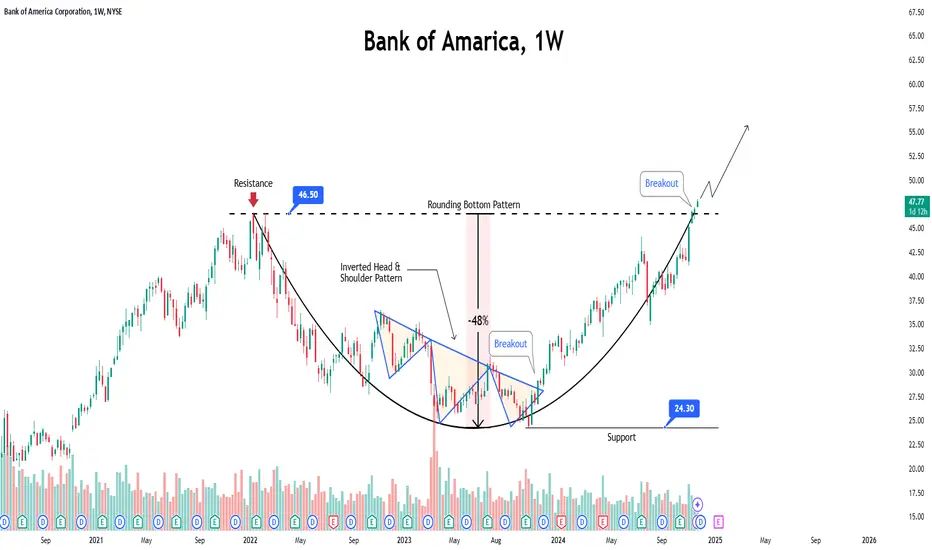
BofA's Triumphant Return: Stock Surges to New Heights● Following a significant rejection around the 46.5 level, the stock price dropped nearly 50%.
● However, it found support near the 24.3 level and staged a comeback.
● After nearly three years, it has now broken through its previous major resistance and is currently trading at an all-time high.
● There are expectations that this upward momentum will continue, pushing the price even further.
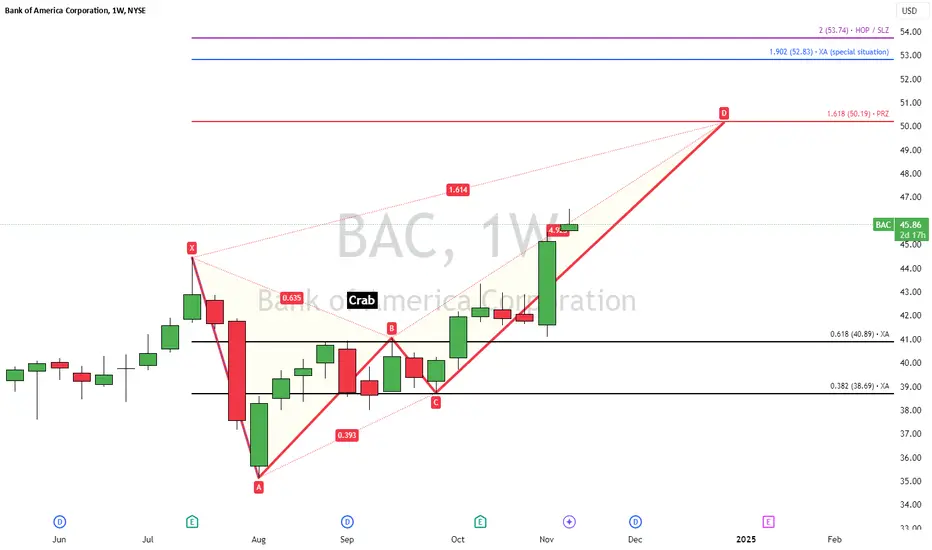
$BAC weekly chart, Crab harmonic setup
Crab Pattern harmonic setup.
Currently 45.86
PRZ = 50.19
1.902 Special Situation Fib = 52.83
HOP / SLZ = 53.74
Once we achieve PRZ, will then evaluate for the retracement setup.