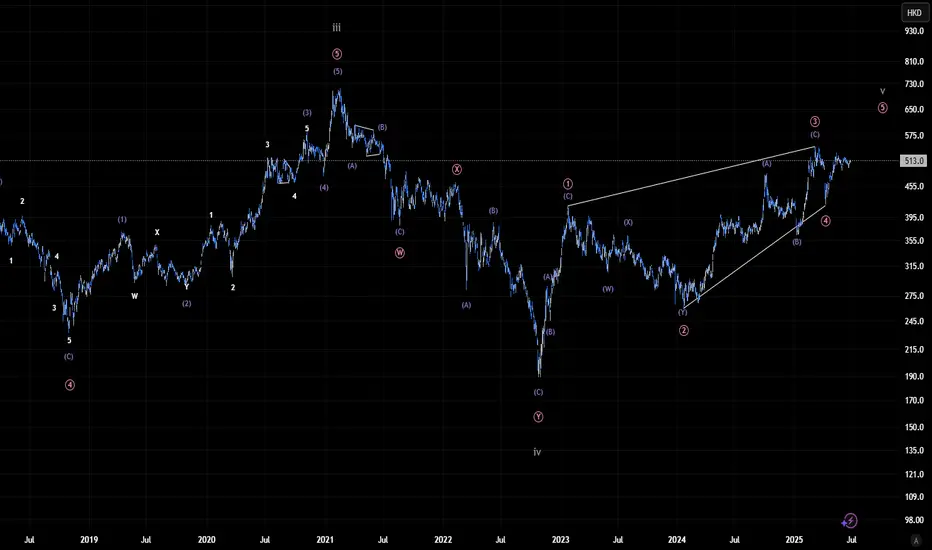
Tencent Holdings – Potential Wave Count and ForecastAs current price action unfolds, a Wave 5 (gray) forming as an ending diagonal appears to be the most likely scenario. However, the micro count remains open to interpretation and may differ slightly. Continued observation should eventually provide clarity and confirmation at the lower degrees.This e
Next report date
—
Report period
—
EPS estimate
—
Revenue estimate
—
2.667 CHF
24.59 B CHF
83.66 B CHF
6.09 B
About TENCENT HOLDINGS LIMITED
Sector
Industry
CEO
Hua Teng Ma
Website
Headquarters
Shenzhen
Founded
1998
FIGI
BBG01QF09N40
Tencent Holdings Ltd. provides value-added services, online advertising services, and fintech and business services. It operates through the following segments: Value-Added Services, FinTech and Business Services, Online Advertising, and Others. The Value-Added Services segment is involved in online and mobile games, community value-added services, and applications across various Internet and mobile platforms. The FinTech and Business Services segment offers fintech and cloud services, which include commissions from payment, wealth management and other services. The Online Advertising segment refers to the display based and performance-based advertisements. The Other segment is composed of trademark licensing, software development services, software sales, and other services. The company was founded by Yi Dan Chen, Hua Teng Ma, Chen Ye Xu, Li Qing Zeng, and Zhi Dong Zhang on November 11, 1998, and is headquartered in Shenzhen, China.
Related stocks
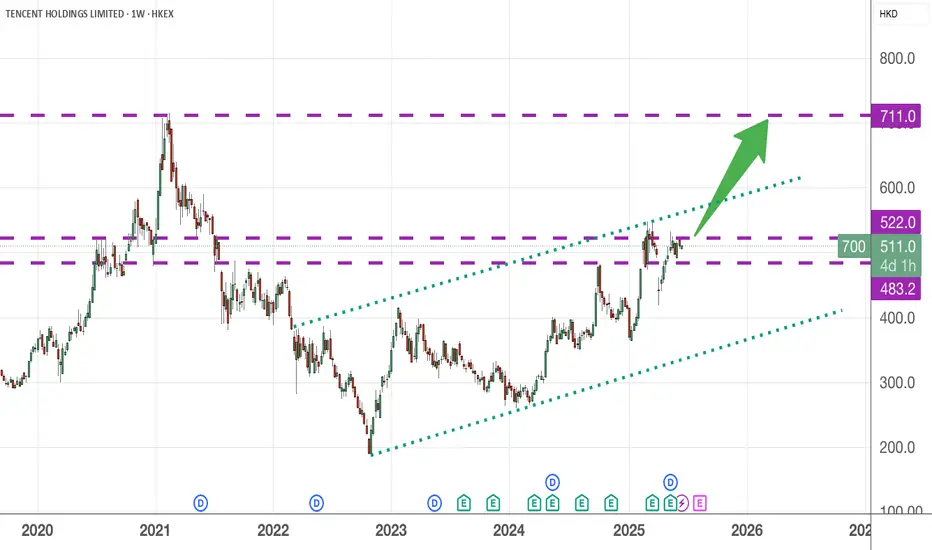
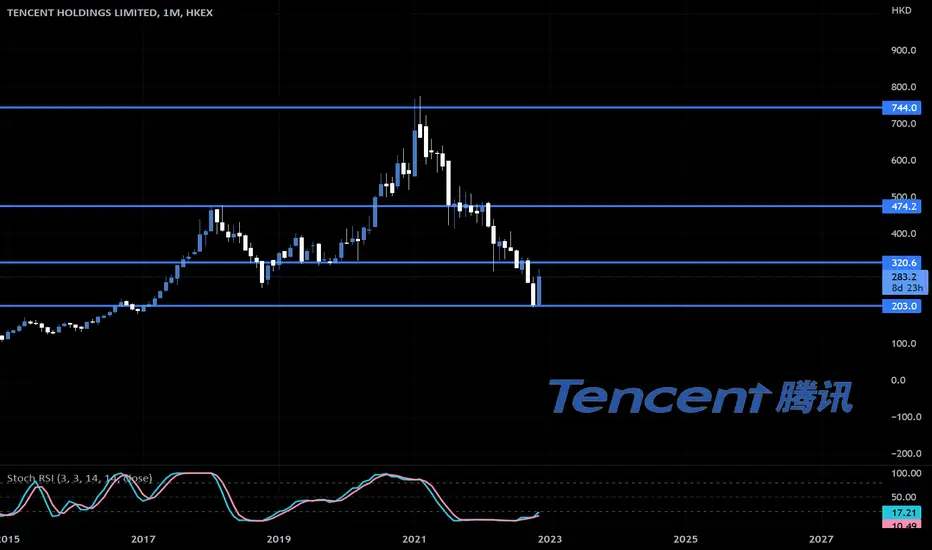
Tencent Holdings back to 700 price level In Feb 2021, that was the peak of Tencent Holdings at 700+ price level.
Currently, we have cleared the resistance at 483.20 and I expect it to break above the 522 price level within the next few months. Once this level is broken up, it should head towards the 700+ price level.
It won't be a strai
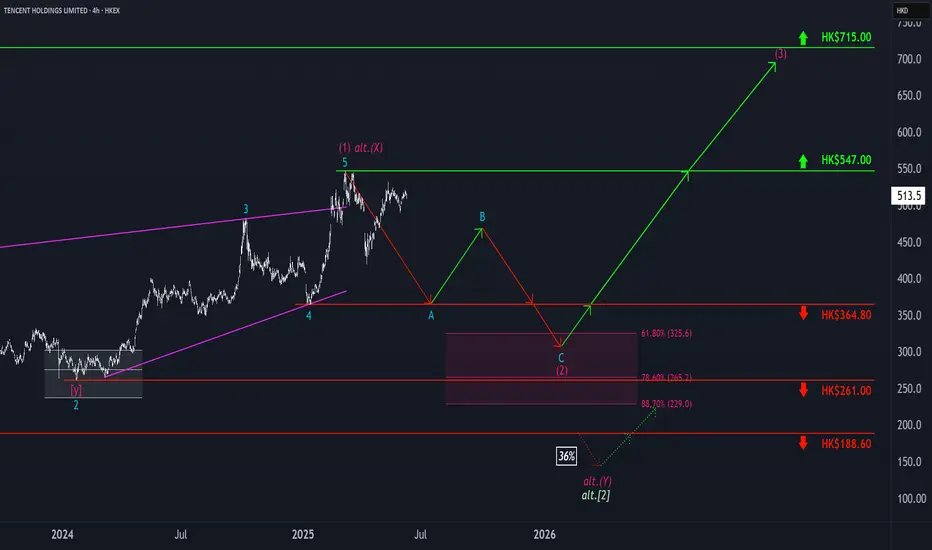
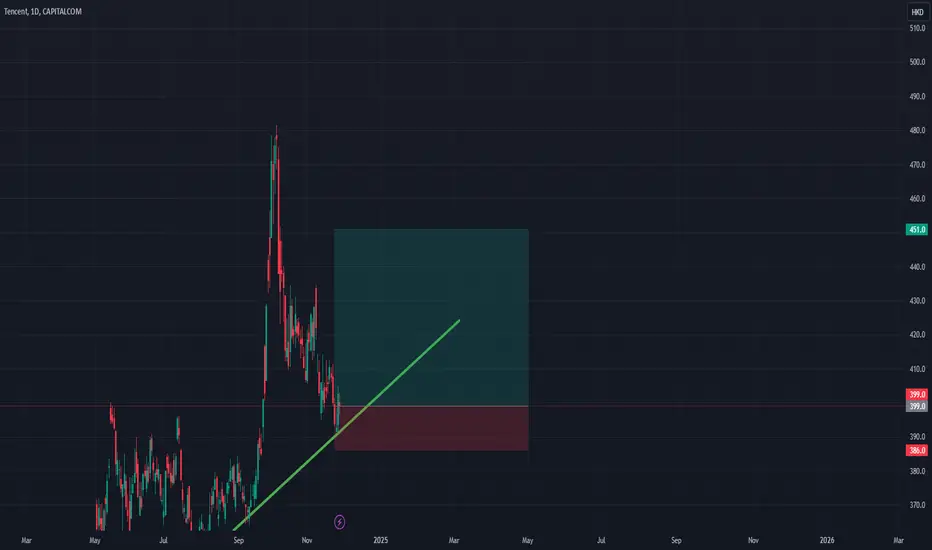
Tencent: Searching for Wave A’s LowTencent’s corrective A-B-C structure is struggling to finish wave A. Our primary scenario calls for a drop toward support at HK$364.80, where wave A should bottom. That should open the door for wave B, followed by a deeper leg down in wave C—into the magenta Long Target Zone between HK$325.60 and HK
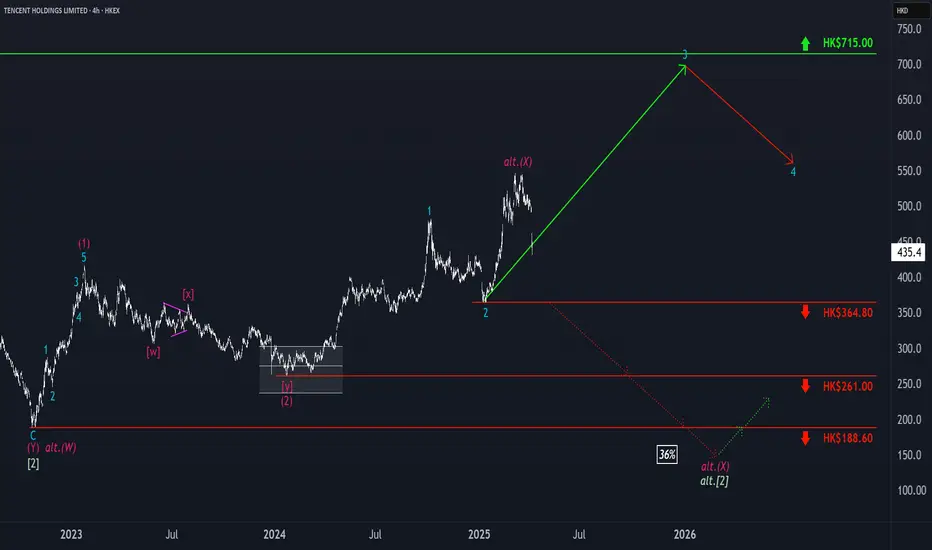
Tencent: Significant Decline!Tencent's stock took a significant hit, creating a noticeable gap in the chart. Nevertheless, for now, our primary assumption remains that the price is currently working on the turquoise wave 3 and will soon move toward the resistance at HK$715. Afterward, a corrective movement should follow during
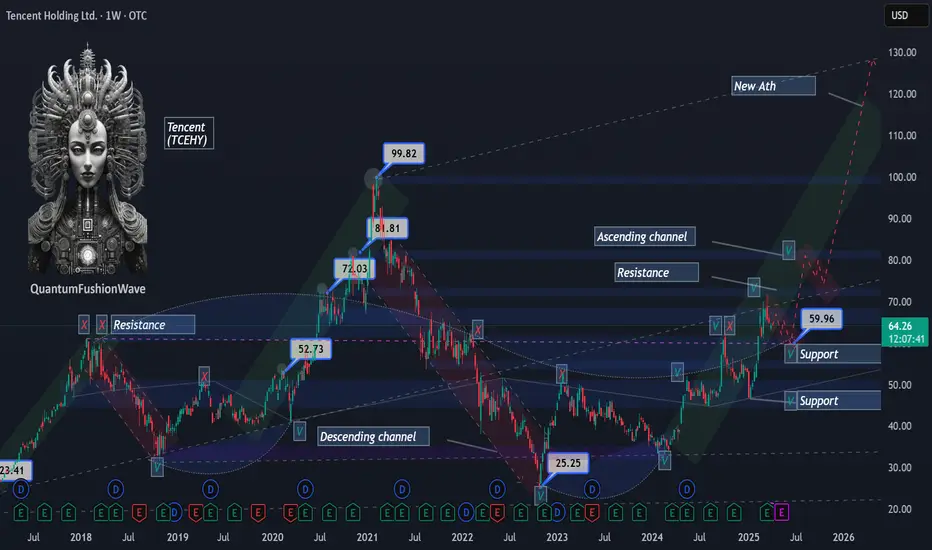
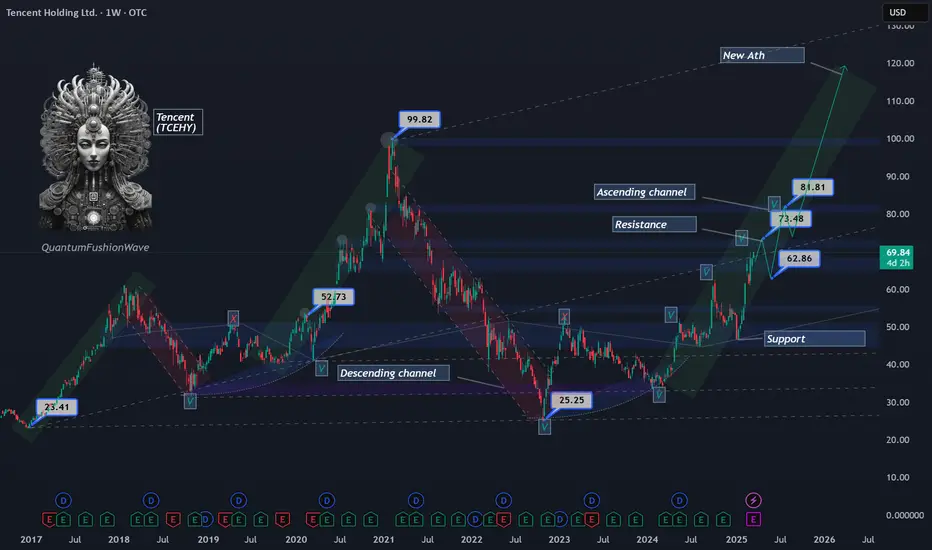
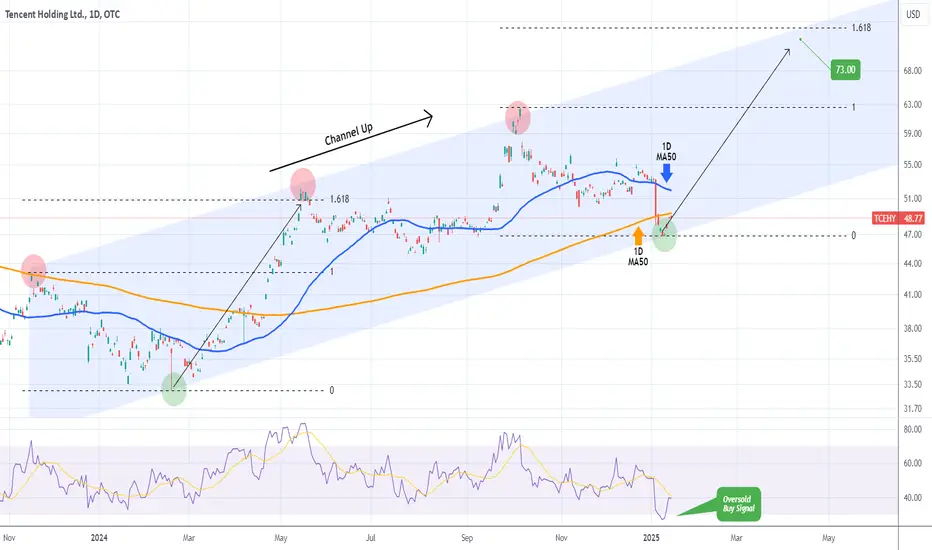
Tencent Holdings (TCEHY) – Technical & Fundamental OutlookTencent Holdings Limited (TCEHY) is currently trading between $62–$64, maintaining structure within a well-defined ascending channel. After testing the $73 resistance level—a key price from 2020—the stock faced rejection, triggering a retracement phase and a shift into a daily consolidation range.
Tencent Holdings LtdIs Tencent Stock a Buy Now?
Tencent posted its third quarter earnings report on Nov. 16. The Chinese tech giant's revenue fell 2% year over year to 140.1 billion yuan ($19.8 billion), which represented its second consecutive quarter of declining revenue since its IPO in 2004. Its net profit rose 1%
Tencent Holdings (TCEHY) Poised for a Breakout Toward New HighsTencent Holdings Limited (TCEHY) is currently trading within a well-defined ascending channel, with price action averaging $68–$69. The key resistance level at $73—a price last seen in 2020—appears weak and could be easily broken, given the company’s strong positioning in China’s expanding economy.
Stock Trading, a more 'calmer' way to tradeFind a trend and stay on trend, take profit when you can and when happy.
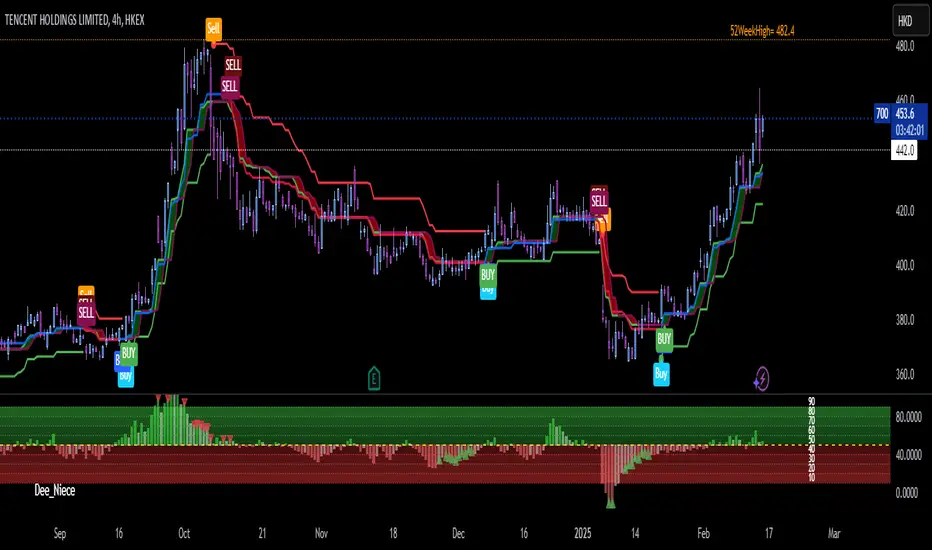
TENCENT Buy signal at the bottom of the Channel Up.Tencent Holding (TCEHY) has been trading within a Channel Up since the November 15 2023 High and on Monday it made contact with the pattern's bottom (Higher Lows trend-line). As the 1D RSI turned oversold and rebounded, we believe that this is the best buy opportunity in almost 1 year.
Technically
See all ideas
Summarizing what the indicators are suggesting.
Neutral
SellBuy
Strong sellStrong buy
Strong sellSellNeutralBuyStrong buy
Neutral
SellBuy
Strong sellStrong buy
Strong sellSellNeutralBuyStrong buy
Neutral
SellBuy
Strong sellStrong buy
Strong sellSellNeutralBuyStrong buy
An aggregate view of professional's ratings.
Neutral
SellBuy
Strong sellStrong buy
Strong sellSellNeutralBuyStrong buy
Neutral
SellBuy
Strong sellStrong buy
Strong sellSellNeutralBuyStrong buy
Neutral
SellBuy
Strong sellStrong buy
Strong sellSellNeutralBuyStrong buy
US88032WAW6
TENCENT HLDG 20/60 MTNYield to maturity
6.90%
Maturity date
Jun 3, 2060
US88032WAV8
TENCENT HLDG 20/50 MTNYield to maturity
6.82%
Maturity date
Jun 3, 2050
TCEH4995312
Tencent Holdings Limited 3.29% 03-JUN-2060Yield to maturity
6.76%
Maturity date
Jun 3, 2060
TCEH4995310
Tencent Holdings Limited 3.24% 03-JUN-2050Yield to maturity
6.69%
Maturity date
Jun 3, 2050
US88032WBC9
TENCENT HLDG 21/51 MTNYield to maturity
6.54%
Maturity date
Apr 22, 2051
TCEH5167983
Tencent Holdings Limited 3.84% 22-APR-2051Yield to maturity
6.50%
Maturity date
Apr 22, 2051
TCEH5167985
Tencent Holdings Limited 3.94% 22-APR-2061Yield to maturity
6.39%
Maturity date
Apr 22, 2061
US88032XAQ7
TENCENT HLDG 19/49 MTNYield to maturity
6.22%
Maturity date
Apr 11, 2049
TCEH5167994
Tencent Holdings Limited 3.68% 22-APR-2041Yield to maturity
6.10%
Maturity date
Apr 22, 2041
US88032XAH7
TENCENT HLDGS 18/38 MTNYield to maturity
5.56%
Maturity date
Jan 19, 2038
US88032XAM6
TENCENT HLDG 19/26 MTNYield to maturity
4.65%
Maturity date
Apr 11, 2026
See all 0700 bonds
Curated watchlists where 0700 is featured.


Frequently Asked Questions
The current price of 0700 is 52.468 CHF — it has increased by 2.68% in the past 24 hours. Watch TENCENT HLDGS LTD stock price performance more closely on the chart.
Depending on the exchange, the stock ticker may vary. For instance, on BX exchange TENCENT HLDGS LTD stocks are traded under the ticker 0700.
0700 stock has risen by 2.68% compared to the previous week, the month change is a −2.47% fall, over the last year TENCENT HLDGS LTD has showed a −9.33% decrease.
We've gathered analysts' opinions on TENCENT HLDGS LTD future price: according to them, 0700 price has a max estimate of 75.57 CHF and a min estimate of 40.64 CHF. Watch 0700 chart and read a more detailed TENCENT HLDGS LTD stock forecast: see what analysts think of TENCENT HLDGS LTD and suggest that you do with its stocks.
0700 reached its all-time high on Feb 21, 2025 with the price of 60.750 CHF, and its all-time low was 47.879 CHF and was reached on Apr 7, 2025. View more price dynamics on 0700 chart.
See other stocks reaching their highest and lowest prices.
See other stocks reaching their highest and lowest prices.
0700 stock is 2.64% volatile and has beta coefficient of 1.19. Track TENCENT HLDGS LTD stock price on the chart and check out the list of the most volatile stocks — is TENCENT HLDGS LTD there?
Today TENCENT HLDGS LTD has the market capitalization of 483.63 B, it has decreased by −0.80% over the last week.
Yes, you can track TENCENT HLDGS LTD financials in yearly and quarterly reports right on TradingView.
TENCENT HLDGS LTD is going to release the next earnings report on Aug 13, 2025. Keep track of upcoming events with our Earnings Calendar.
0700 earnings for the last quarter are 0.80 CHF per share, whereas the estimation was 0.78 CHF resulting in a 3.27% surprise. The estimated earnings for the next quarter are 0.72 CHF per share. See more details about TENCENT HLDGS LTD earnings.
TENCENT HLDGS LTD revenue for the last quarter amounts to 21.95 B CHF, despite the estimated figure of 21.42 B CHF. In the next quarter, revenue is expected to reach 19.82 B CHF.
0700 net income for the last quarter is 5.82 B CHF, while the quarter before that showed 6.49 B CHF of net income which accounts for −10.34% change. Track more TENCENT HLDGS LTD financial stats to get the full picture.
Yes, 0700 dividends are paid annually. The last dividend per share was 0.48 CHF. As of today, Dividend Yield (TTM)% is 0.87%. Tracking TENCENT HLDGS LTD dividends might help you take more informed decisions.
TENCENT HLDGS LTD dividend yield was 1.08% in 2024, and payout ratio reached 19.82%. The year before the numbers were 1.16% and 25.25% correspondingly. See high-dividend stocks and find more opportunities for your portfolio.
As of Jul 20, 2025, the company has 110.56 K employees. See our rating of the largest employees — is TENCENT HLDGS LTD on this list?
EBITDA measures a company's operating performance, its growth signifies an improvement in the efficiency of a company. TENCENT HLDGS LTD EBITDA is 32.52 B CHF, and current EBITDA margin is 38.80%. See more stats in TENCENT HLDGS LTD financial statements.
Like other stocks, 0700 shares are traded on stock exchanges, e.g. Nasdaq, Nyse, Euronext, and the easiest way to buy them is through an online stock broker. To do this, you need to open an account and follow a broker's procedures, then start trading. You can trade TENCENT HLDGS LTD stock right from TradingView charts — choose your broker and connect to your account.