SLB: Schlumberger updateIt seems SLB is at good valuation now, but a risk in dropping international revenue still need to be figured out.
if this can be solved, then SLB is good to go.
Disclaimer: This content is NOT a financial advise, it is for educational purpose only.
SCL trade ideas

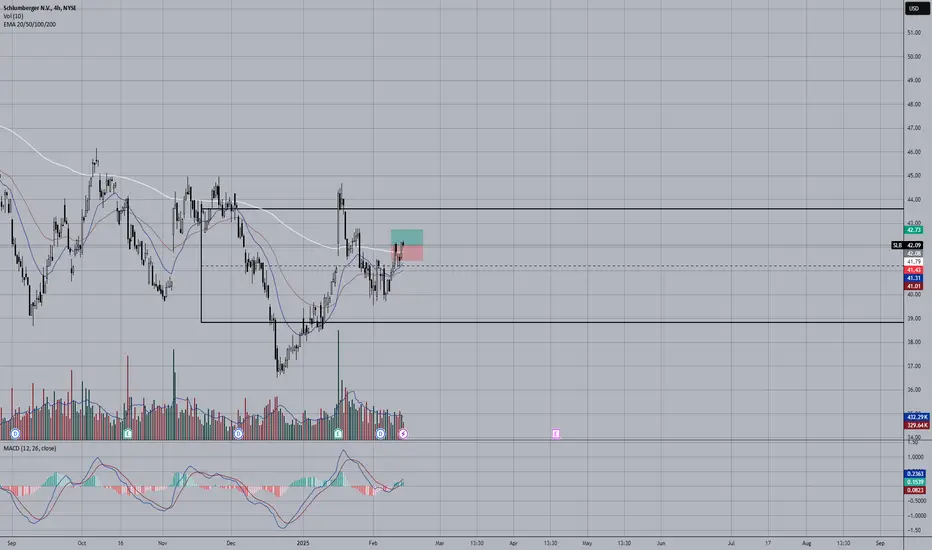
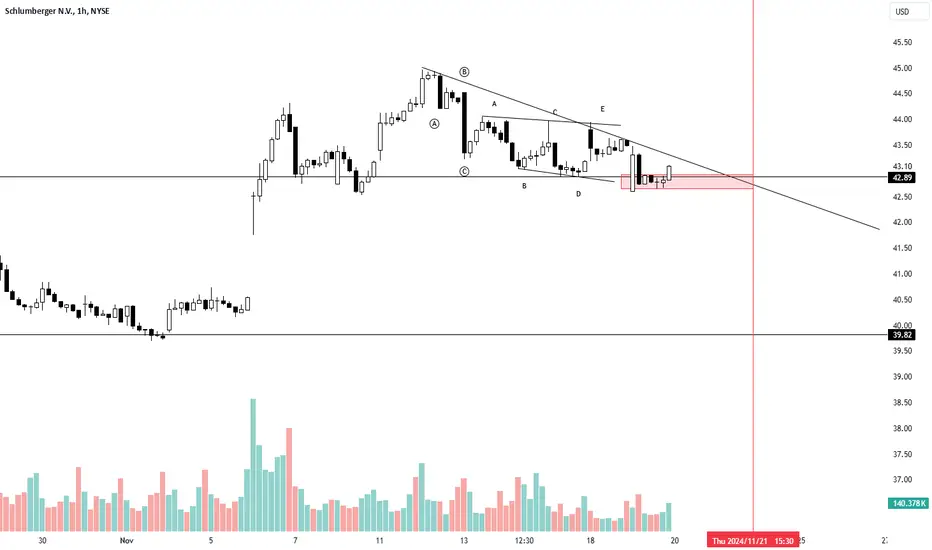
Quick View: $SLB- Great consolidaiton on the daily with EMAs+Price ready to make THE Move.
- The hourly looks good with a perfect box
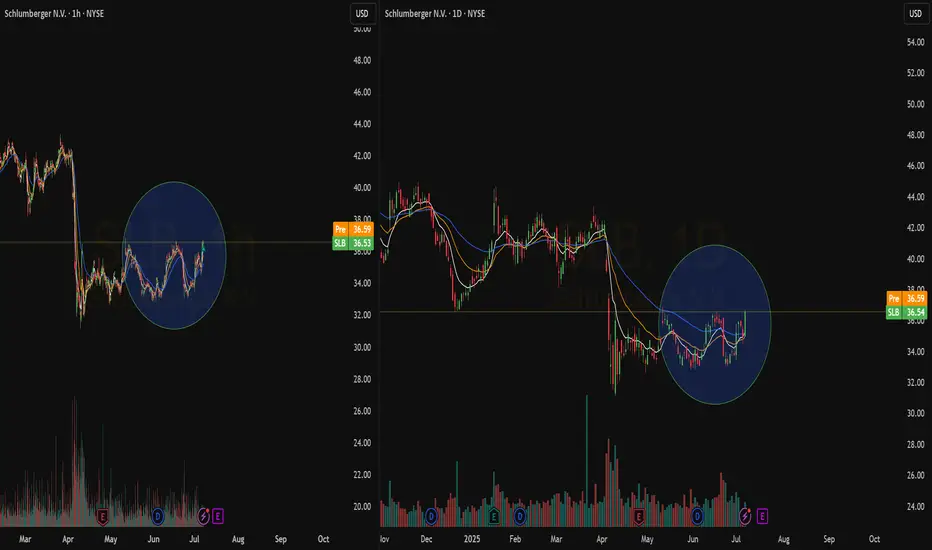
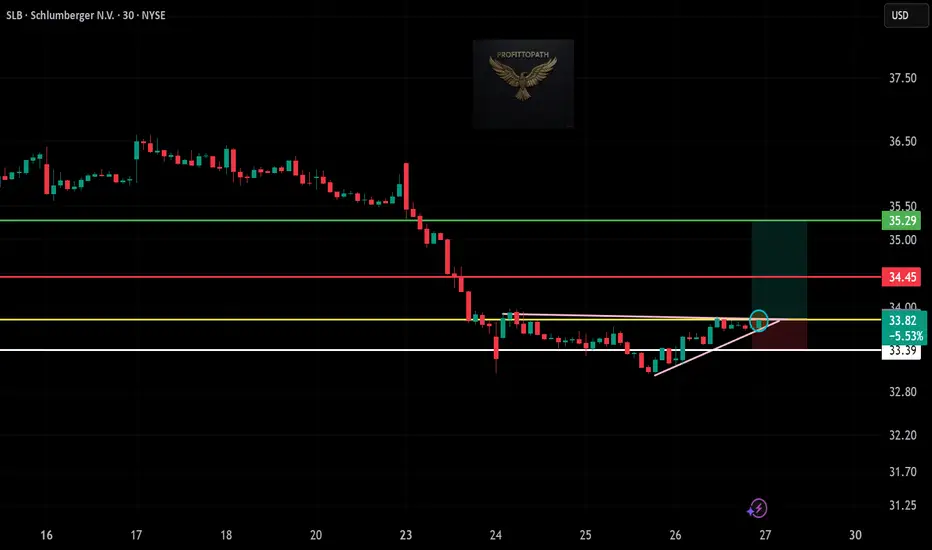
SLB Long Trade Setup!📈 🔥
Recovering from sharp drop — trendline breakout forming 📊
Entry: $33.82 ✅ | Stop: $33.39 🛑
Target: $35.29 🎯 — potential reversal in play 📶
#SLB #LongTrade #EnergyStocks #StockMarket #TechnicalAnalysis #TradingView
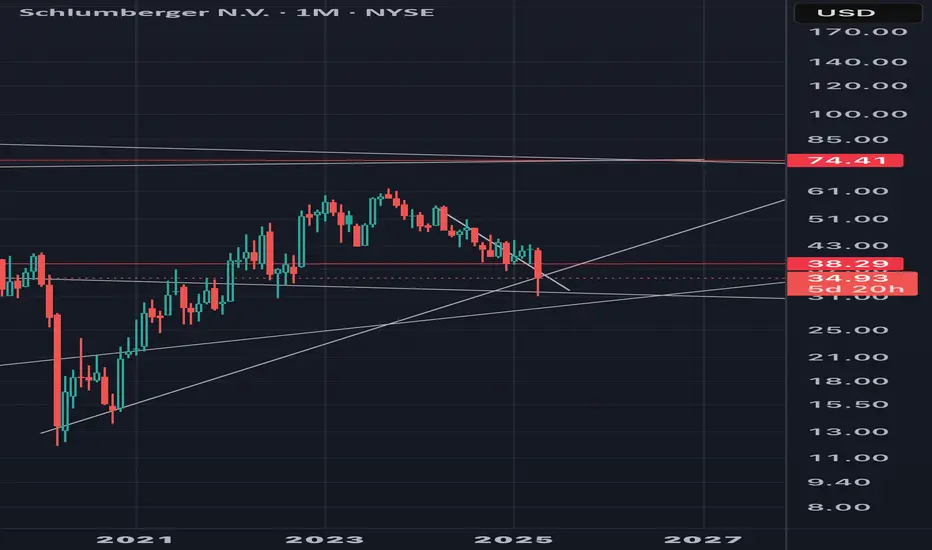
SLB could bounce SLB is still in a down trend but we could’ve found bottom. Tomorrow is earnings and it sure looks like a D1 breakout to the upside. If correct tomorrow’s earnings report hopefully will send us higher. Long term 1st target $74.41. (I may close my original investment here) I see oil reaching all time highs in the future if so SLB will as well. I’m already in collecting dividends.
Schlumberger Stock Chart Fibonacci Analysis 050925Trading Idea
1) Find a FIBO slingshot
2) Check FIBO 61.80% level
3) Entry Point > 33/61.80%
Chart time frame: D
A) 15 min(1W-3M)
B) 1 hr(3M-6M)
C) 4 hr(6M-1year)
D) 1 day(1-3years)
Stock progress: A
A) Keep rising over 61.80% resistance
B) 61.80% resistance
C) 61.80% support
D) Hit the bottom
E) Hit the top
Stocks rise as they rise from support and fall from resistance. Our goal is to find a low support point and enter. It can be referred to as buying at the pullback point. The pullback point can be found with a Fibonacci extension of 61.80%. This is a step to find entry level. 1) Find a triangle (Fibonacci Speed Fan Line) that connects the high (resistance) and low (support) points of the stock in progress, where it is continuously expressed as a Slingshot, 2) and create a Fibonacci extension level for the first rising wave from the start point of slingshot pattern.
When the current price goes over 61.80% level , that can be a good entry point, especially if the SMA 100 and 200 curves are gathered together at 61.80%, it is a very good entry point.
As a great help, tradingview provides these Fibonacci speed fan lines and extension levels with ease. So if you use the Fibonacci fan line, the extension level, and the SMA 100/200 curve well, you can find an entry point for the stock market. At least you have to enter at this low point to avoid trading failure, and if you are skilled at entering this low point, with fibonacci6180 technique, your reading skill to chart will be greatly improved.
If you want to do day trading, please set the time frame to 5 minutes or 15 minutes, and you will see many of the low point of rising stocks.
If want to prefer long term range trading, you can set the time frame to 1 hr or 1 day.

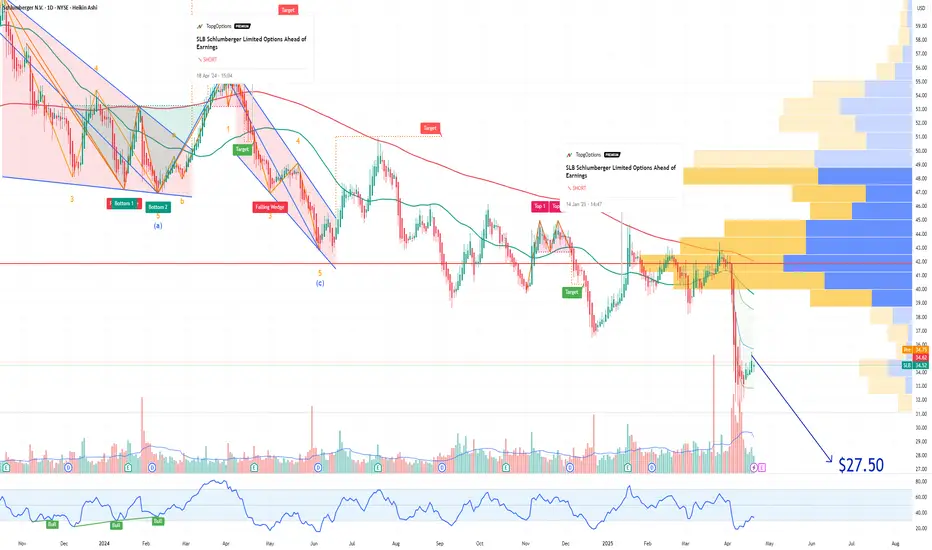
SLB Schlumberger Limited Options Ahead of EarningsIf you haven`t sold SLB before the previous earnings:
Now analyzing the options chain and the chart patterns of SLB Schlumberger Limited prior to the earnings report this week,
I would consider purchasing the 27.50usd strike price Puts with
an expiration date of 2026-3-20,
for a premium of approximately $2.01.
If these options prove to be profitable prior to the earnings release, I would sell at least half of them.
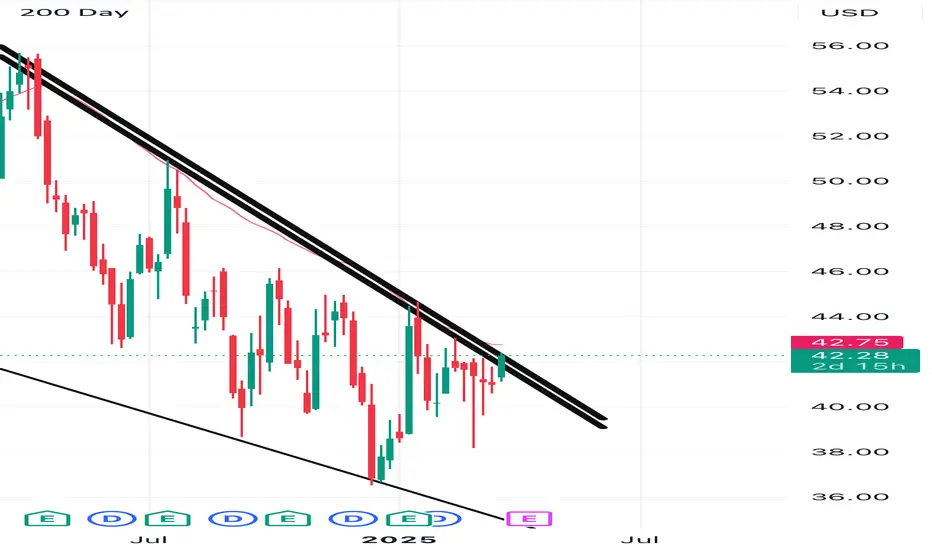
SLB watch $34.76-35.11: Key support to start/continue recovery SLB has crashed along with oil prices of course.
Sitting on a well proven support $34.76-35.11
Look for a launch into double fib targets above.

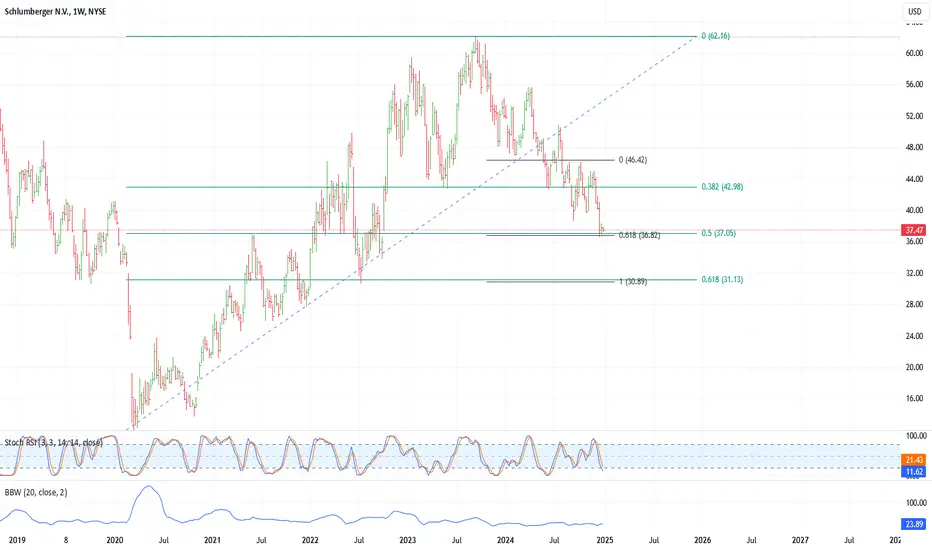
SLB: Bounce Loading or Basement Dive?After tagging my target around $60, SLB (Schlumberger) has been chillin’ in consolidation mode for a while now. We’re sitting on a solid support zone, and honestly, the odds of a bounce look better than a full-on dump here. Textbook vibes too—Fibo 0.618 lands right around $31, which lines up perfectly if this is where it decides to base out.
If we do get the bounce, next stop could be in the $90–$95 range. 🚀 On the flip side though… if this thing keeps bleeding, we might not see a floor until the $20–$22 area.
I’ve got a position, so here’s to hoping we take the high road! 🤞Good luck out there!
$SLBSLB looking to break out of this wedge after posting its largest volume day in atleast a year. Sheeeeeiddd
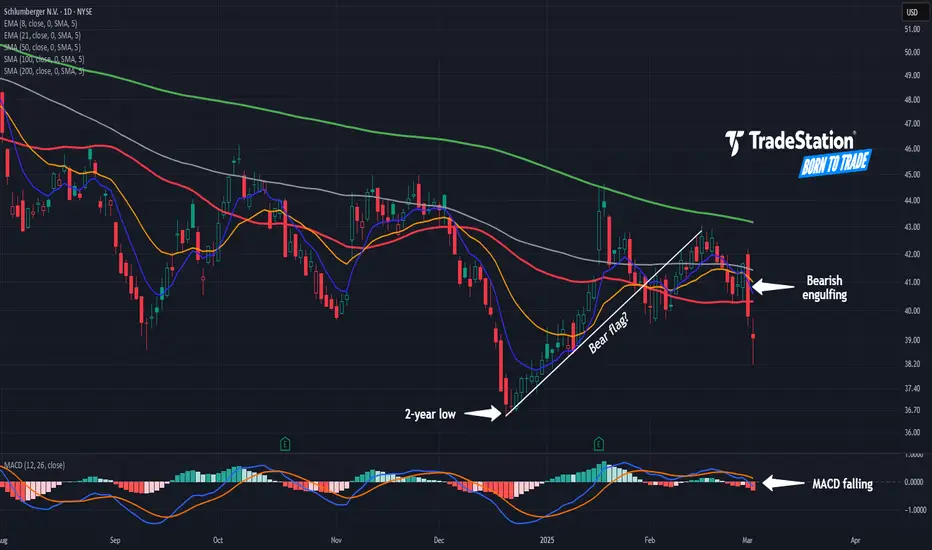
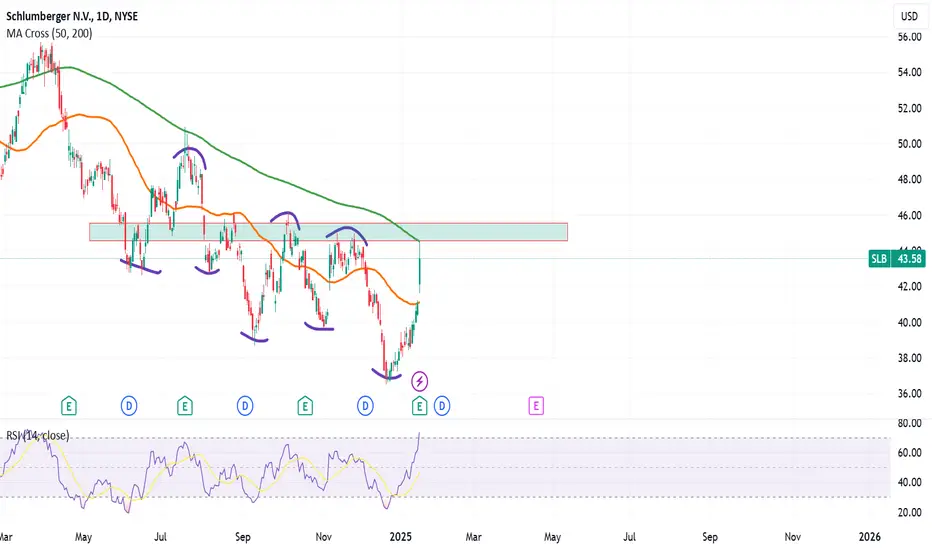
Schlumberger Has Been SlidingSchlumberger has been sliding for more than a year, and some traders may see further downside risk.
The first pattern on today’s chart is the series of higher lows between mid-December and early January. The oilfield-services company dipped below the line in late January and spent all of February below it. That may be viewed as a bear flag breakdown.
Second, SLB made a higher daily high in a failed rally on Monday. But then it crossed below Friday’s low. The resulting bearish engulfing candle may suggest that sellers remain in control.
Third, the 50-day simple moving average (SMA) is below the 100-day SMA. Both are under the 200-day SMA. Such a configuration is potentially consistent with bearishness over the longer run.
Flipping to the short run, traders may also see bearish patterns: The 8-day exponential moving average (EMA) has crossed below the 21-day EMA and MACD has been falling.
TradeStation has, for decades, advanced the trading industry, providing access to stocks, options and futures. If you're born to trade, we could be for you. See our Overview for more.
Past performance, whether actual or indicated by historical tests of strategies, is no guarantee of future performance or success. There is a possibility that you may sustain a loss equal to or greater than your entire investment regardless of which asset class you trade (equities, options or futures); therefore, you should not invest or risk money that you cannot afford to lose. Online trading is not suitable for all investors. View the document titled Characteristics and Risks of Standardized Options at www.TradeStation.com . Before trading any asset class, customers must read the relevant risk disclosure statements on www.TradeStation.com . System access and trade placement and execution may be delayed or fail due to market volatility and volume, quote delays, system and software errors, Internet traffic, outages and other factors.
Securities and futures trading is offered to self-directed customers by TradeStation Securities, Inc., a broker-dealer registered with the Securities and Exchange Commission and a futures commission merchant licensed with the Commodity Futures Trading Commission). TradeStation Securities is a member of the Financial Industry Regulatory Authority, the National Futures Association, and a number of exchanges.
TradeStation Securities, Inc. and TradeStation Technologies, Inc. are each wholly owned subsidiaries of TradeStation Group, Inc., both operating, and providing products and services, under the TradeStation brand and trademark. When applying for, or purchasing, accounts, subscriptions, products and services, it is important that you know which company you will be dealing with. Visit www.TradeStation.com for further important information explaining what this means.
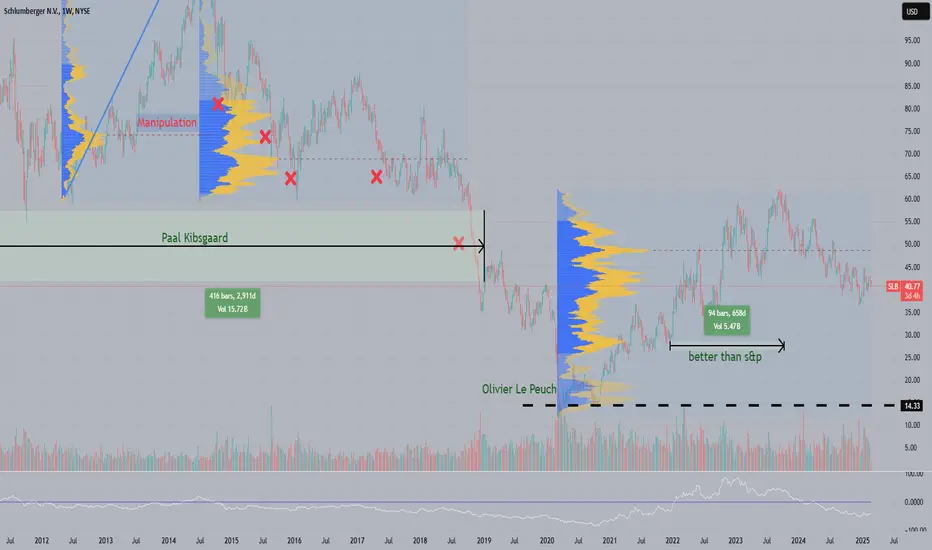
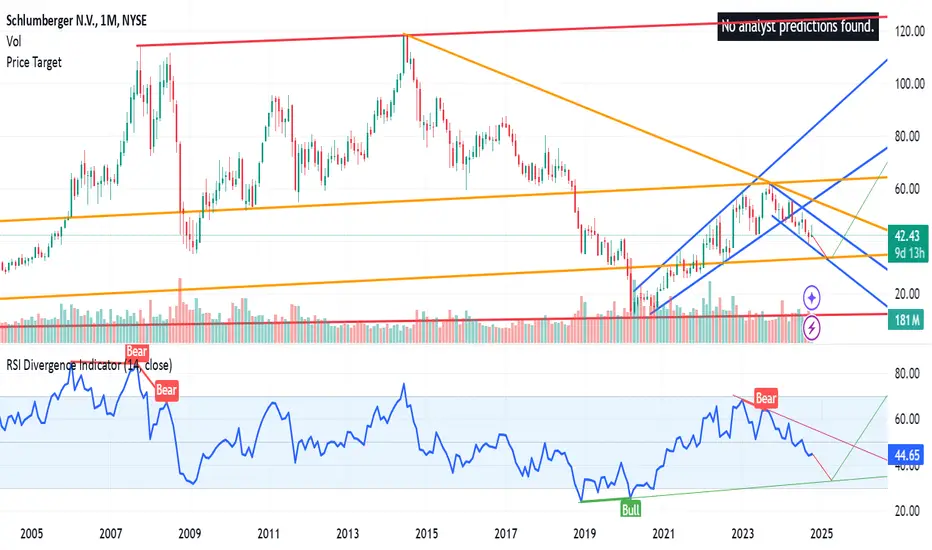
SLB (former Schlumberger). Dig deep ...Schlumberger, the world’s largest oil and gas company, has been through two key phases in recent years. The sustained decline from 2018-2020 and growth in 21-23. Although the movement was partly correlated with oil prices, there were other factors.
Fall period:
1) Since 2016, the company has been actively investing in North America. By 2020, the company was gradually, roughly speaking, defeated.
2) In the 19-20’s, more than 10 billion dollars were written off, including drilling assets in North America.
3)The company approached a global crisis (price war of Russia and CA, covid) with high debt load (about 17 billion).
4) In 2019, the new CEO was Olivier Le Peuch, who replaced Paal Kibsgaard. He was forced to accelerate the exit from loss-making assets and restructure the business.
Growth period:
After the 2020 crisis, SLB managed not only to recover, but also to outpace the market by about 100%.
1) The company has made a focus on the Middle East and Latin America.
2) Reduction of the debt burden, optimization of costs, discipline in expenses.
3) Digital transformation and technology (you can search for 'Delfi').
4) Buyback and dividends.
War in Ukraine:
The company left the Russian market relatively late, and not completely, but limited operations while maintaining its presence. Managed to catch criticism and reputational pressure (Ukraine included in the list of "international sponsors of war"). Also, the company took a minor advantage of rising prices, but eventually reduced the importance of the Russian market (although it compensated for this by expanding in BE and LA). In this context, it should be noted that the war has led to increased attention to energy security issues in Europe and elsewhere, which has stimulated investment in exploration and production in new territories.
It was a fundamental, in-depth analysis. Has the company passed "bottom" or are current prices still high? It is not clear yet...
SLB SL-$41,54 TP-$43,76Technical Analysis:
Accumulation
Daily 20-50 EMA Crossover
Daily MACD Crossover
The daily gap might act as a technical magnet

HI SCHLUMBERGER I love this company so much that I love it to go up...however the chart are looking pretty wacky
It's a bear market for this asset
Pull out or diversify your portfolio cause the next target is the $34 and $20 mark respectively
Hopefully the investors and economy turns it around swiftly

SLB SL- $41,43 TP-$42,73Technical Analysis:
Accumulation
Progressive increase in volume on the daily chart
Double crossover (MACD and EMAs) on the daily chart
Momentum
Schlumberger could break outNYSE:SLB has been making lower lows and lower highs for a while, so clearly in a bearish trend. However, with a recent grind and positive earnings report, future looks quite alright. I'm looking for a breakout above ~$45.50, if confirmed with volume i'll buy the breakout.
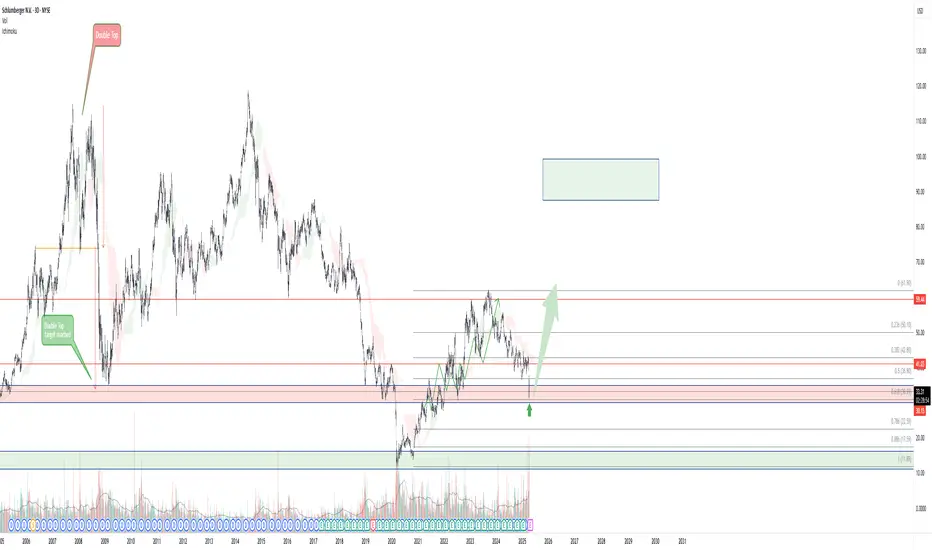
SLB Schlumberger Limited Options Ahead of EarningsIf you haven`t sold the Double Top on SLB:
Now analyzing the options chain and the chart patterns of SLB Schlumberger prior to the earnings report this week,
I would consider purchasing the 40usd strike price Puts with
an expiration date of 2025-6-20,
for a premium of approximately $3.17.
If these options prove to be profitable prior to the earnings release, I would sell at least half of them.

SLB: Bullish Falling WedgeIf the new administration is going to push “Drill Baby Drill”, then a breakout could be in near future.
This is not advice to buy or sell. Exercise your own due diligence and feel free to share your comments.
SLB - Will Trump Presidency Turn This One Around?2024 has not been a good year for Oil stocks, SLB suffering more than others. But could the drill, baby, drill mantra from the incoming president change the fortunes of SLB and other drillers?
From a Fibonacci perspective, price has fallen 50% of the last impulse wave, sometimes considered an appropriate correction. On a corrective wave basis, the current move appears to be .618% of wave A. A common move would be C = A, bringing price down to 31. at that price level the overall correction level from the last major impulse move would be .618, Also a possibility.
Should the current market selloff pull this stock any lower, could be worth a pilot position. Unknown how effective Trump's oil policies will be and how oil stocks will be affected. But clearly, the recent correction has brought prices to a reasonable level with a P/E at a low 12 level.
SLB 5M Daytrade Long Aggressive CounterTrend tradeAggressive CounterTrend trade
- short impulse
+ support level
- unvolumed T1 level
+ volumed 2Sp-
- weak test closed below T1
+ first bullish bar closed entry
- target beyond 5M / 1H range
Calculated affordable stop limit
1 to 2 R/R take profit expandable to swing / investment trade
1 Hour CounterTrend
"- short balance
+ expanding ICE
+ support level
+ biggest volume manipulation"
1 Day Trend
"+ long impulse
+ SOS test level
+ support level
+ 1/2 correction"
1 Month Trend
"+ long balance
+ expanding ICE level
+ support level
+ 1/2 correction
+ volumed manipulation"
Sell SLB Limit 44.54, GTC
Sell SLB Stop 42.29 LMT 43.06, GTC

$SLB with a bearish outlook following its earnings #StocksThe PEAD projected a bearish outlook for NYSE:SLB after a positive over reaction following its earnings release placing the stock in drift B with an expected accuracy of 62.5%.
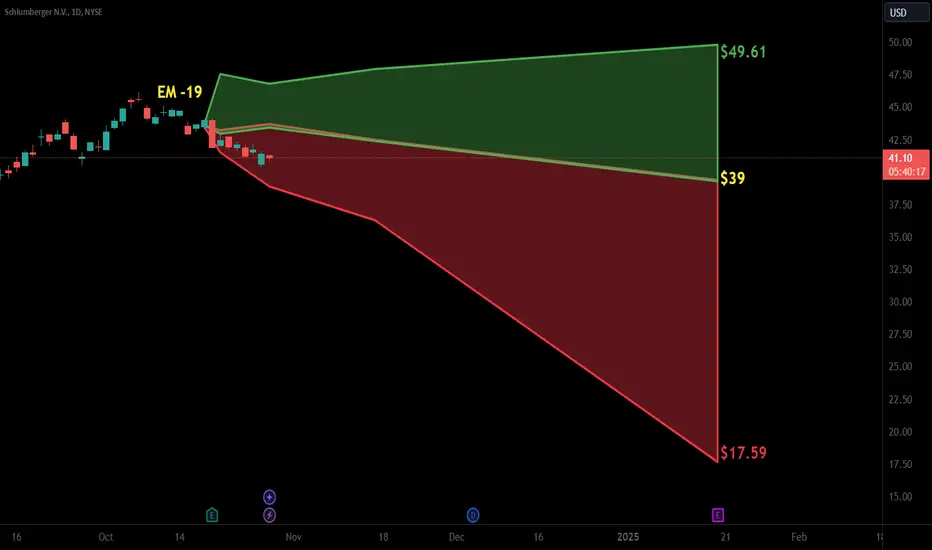
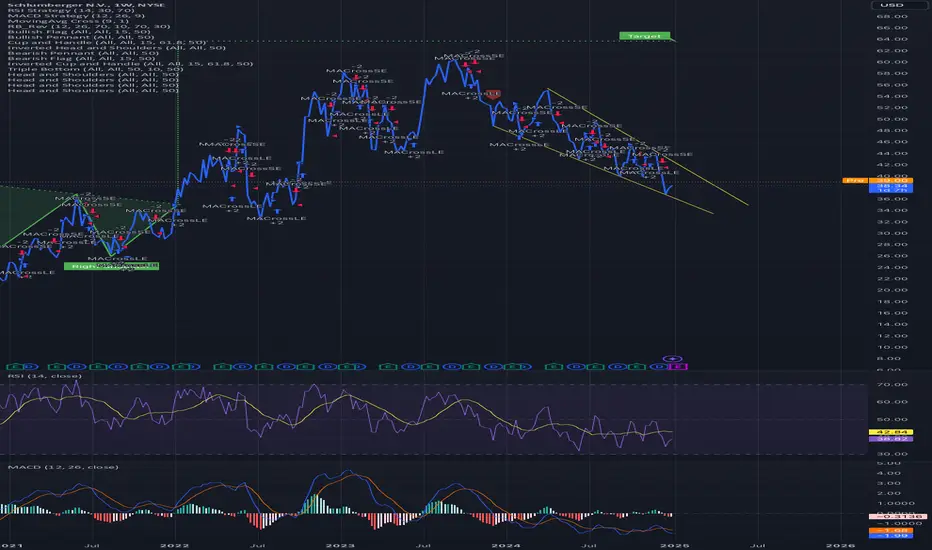
SLB best guessingSLB best guessing for 6 months
based on historical trends and levels
willing to get above 60, preferably 70+, most probably might be correlated with oil price grow....
Drill baby drill !!! Hold long termPlanning to enter before earnings on friday. Hold this position for a long term. Target 130$. If Trump wins this stock will go up easily. To be part of my 3 stocks long term portafolio ASML - ALLY - SLB.
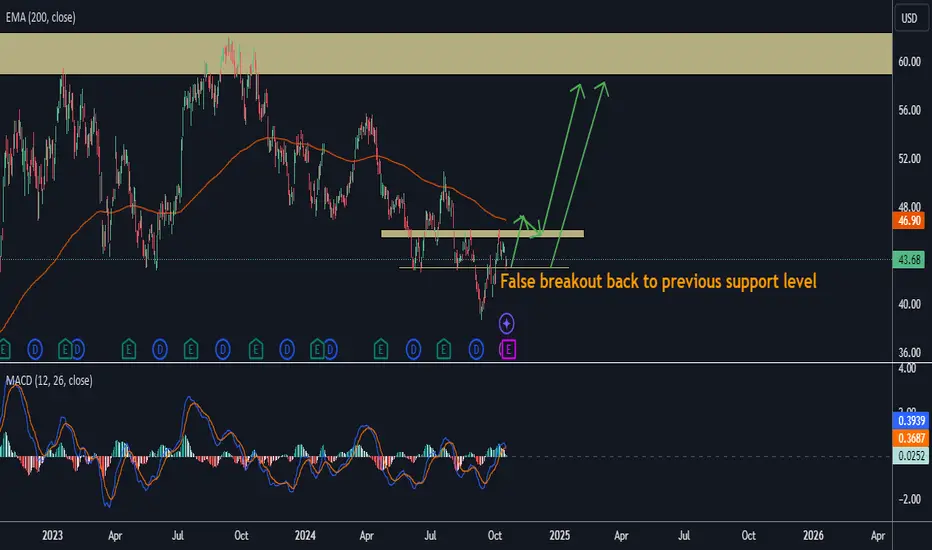
Technically analysis. Price breakdown previous support but bounced back. Possibly Double bottom on daily chart.
DRILL BABY DRILL.