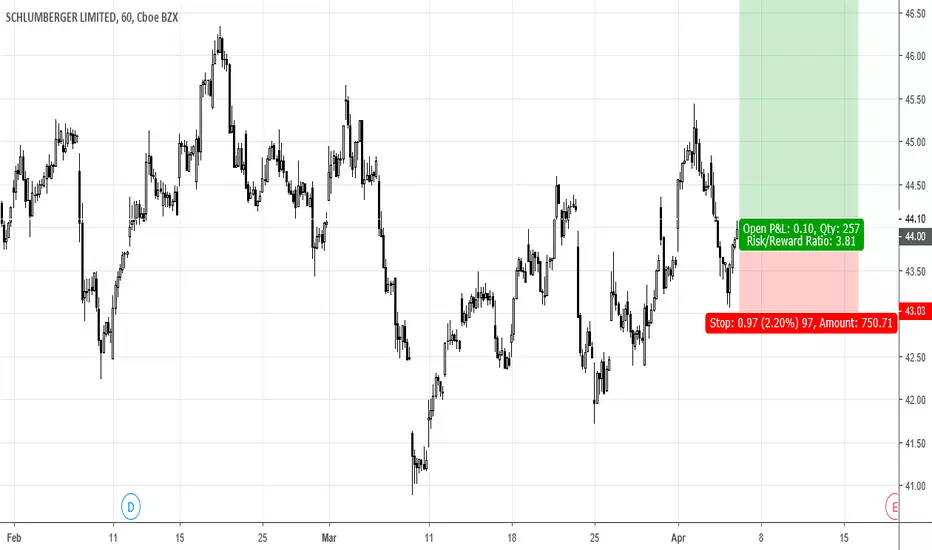
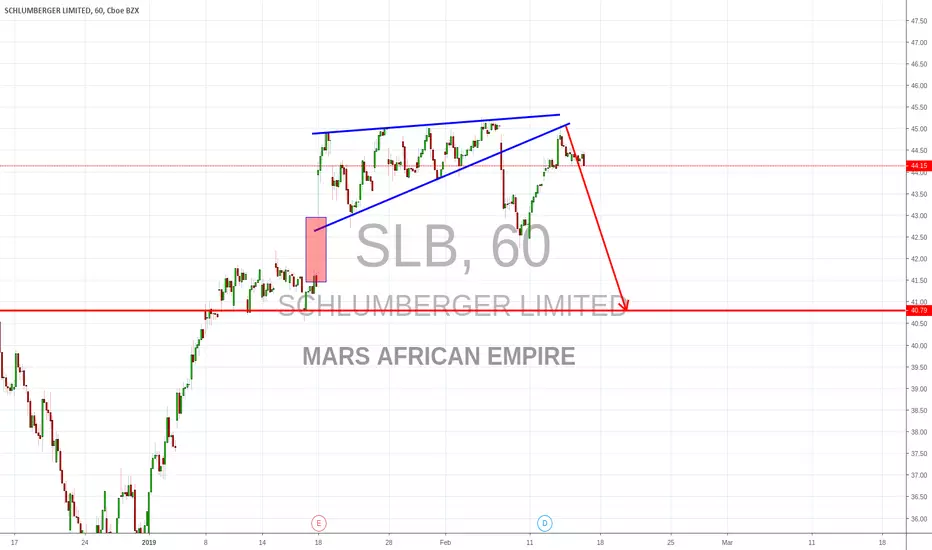
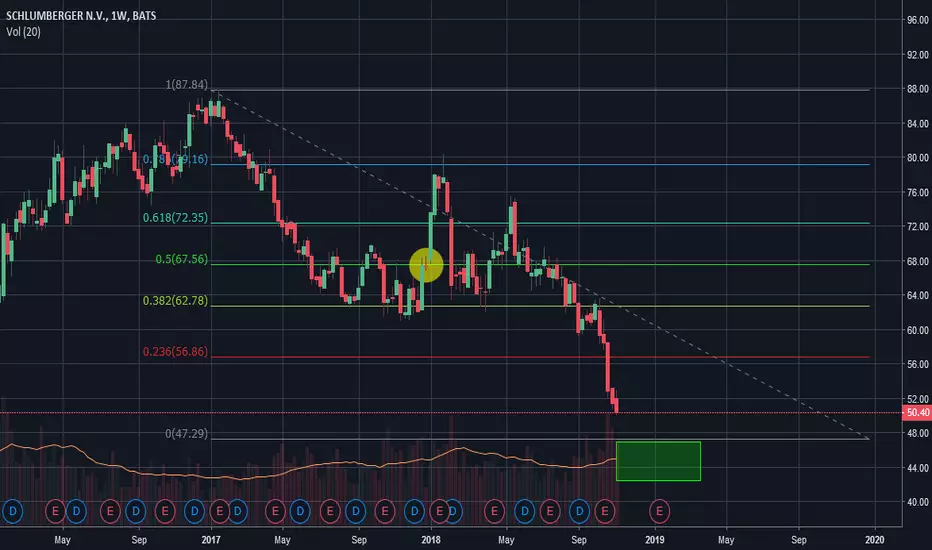
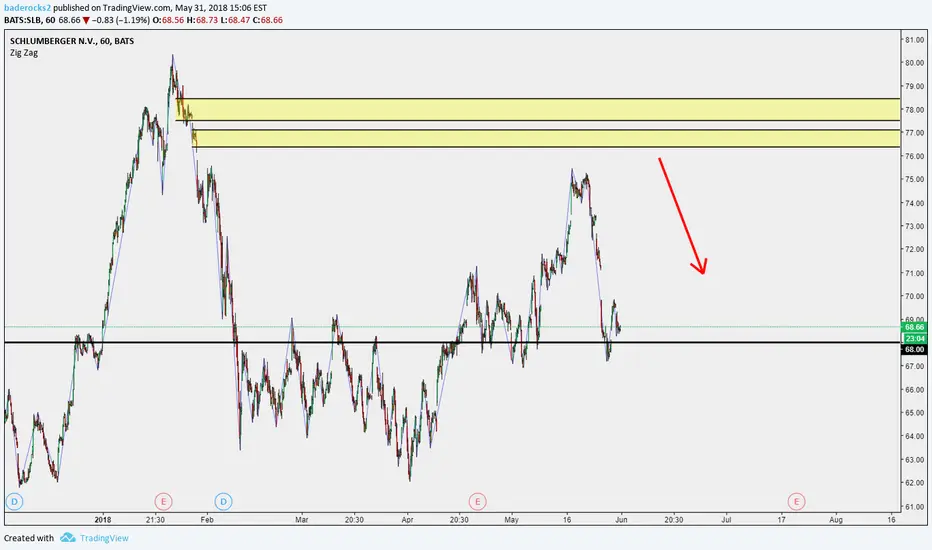
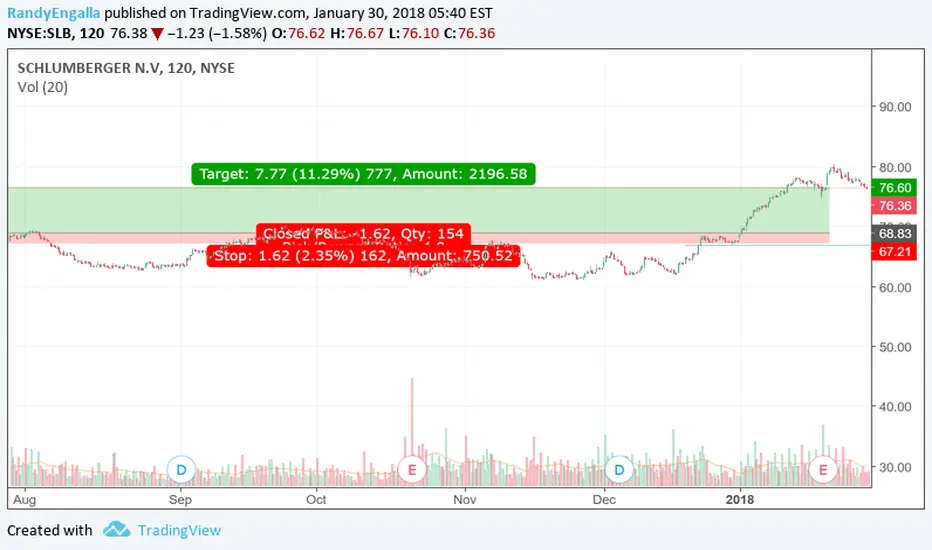
SLB: Sort opportunityAn intraday high potential, Back Tested Sort Analysis.
We ll try to enter into the correction of the uptrend movement.
DETAILS ON THE CHART
NOTE: Entry range area above the entry point, is calculated upon 80% of the recorded pullback back tested past performances
DISCLAIMER: This is a technical analysis study, not an advice or recommendation to invest money on.
SCL trade ideas

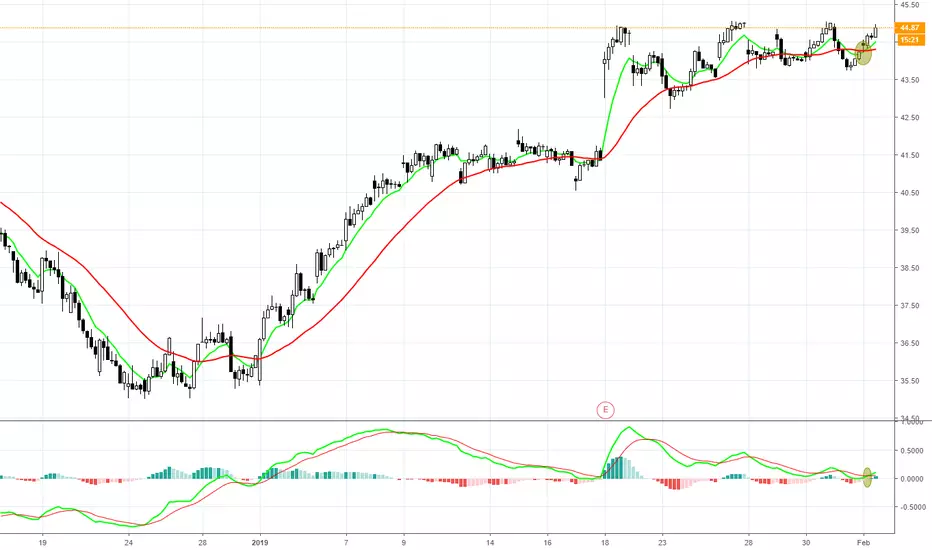
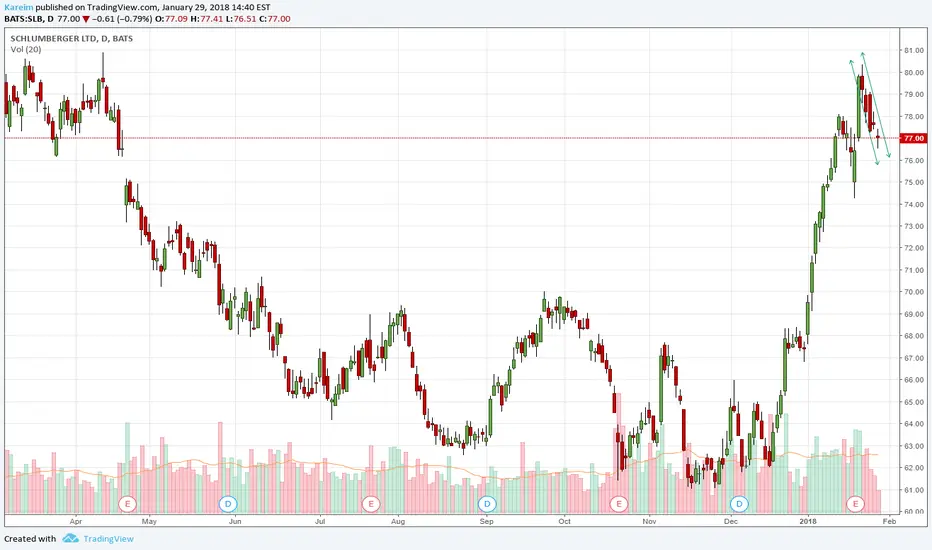
Trade 1Hello, I am new to publishing but have been trading for a while. I plan to post a few trades a month which usually run for 3-6weeks (if they're winners). Its worth noting my stop is a mental stop but I use strict risk management (1.5%). I will comment when I have closed the trade. Also, I do not use any indicators and only trade US Stocks.
Many thanks.
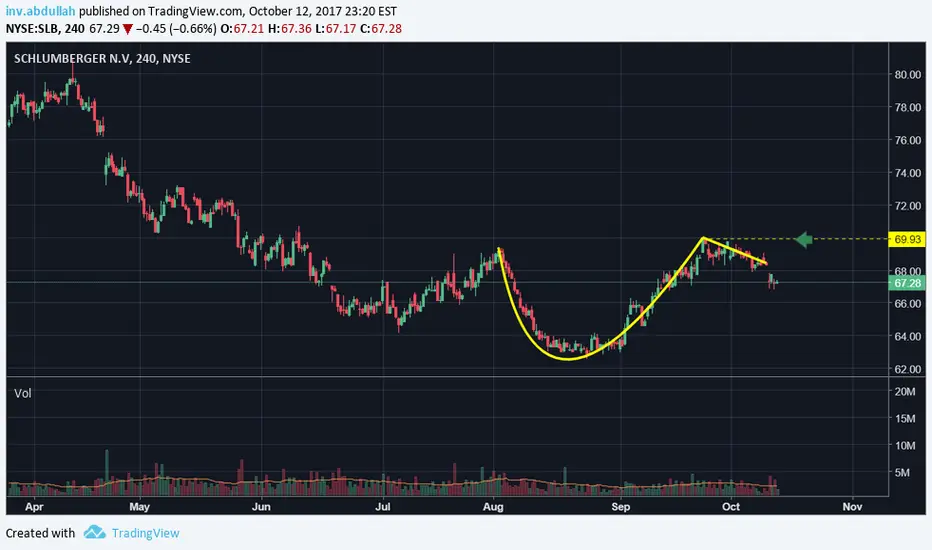
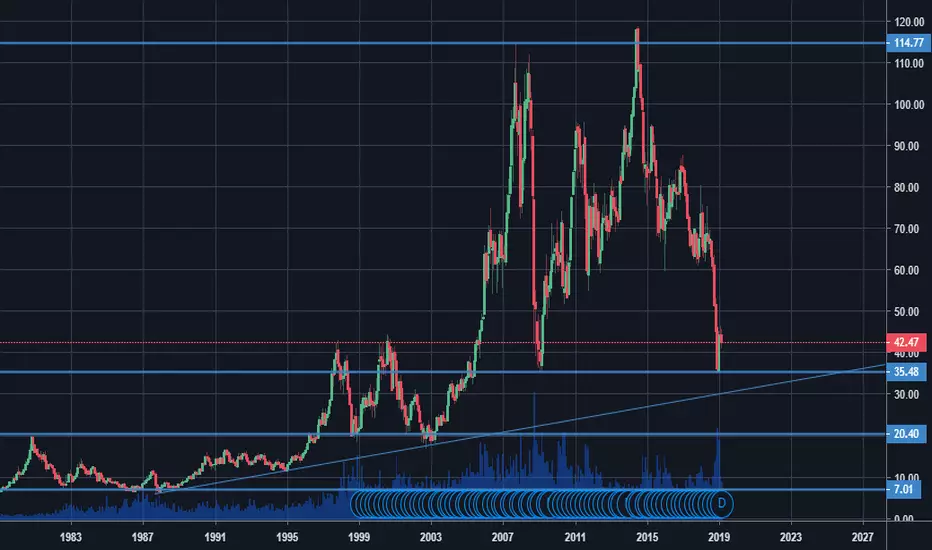
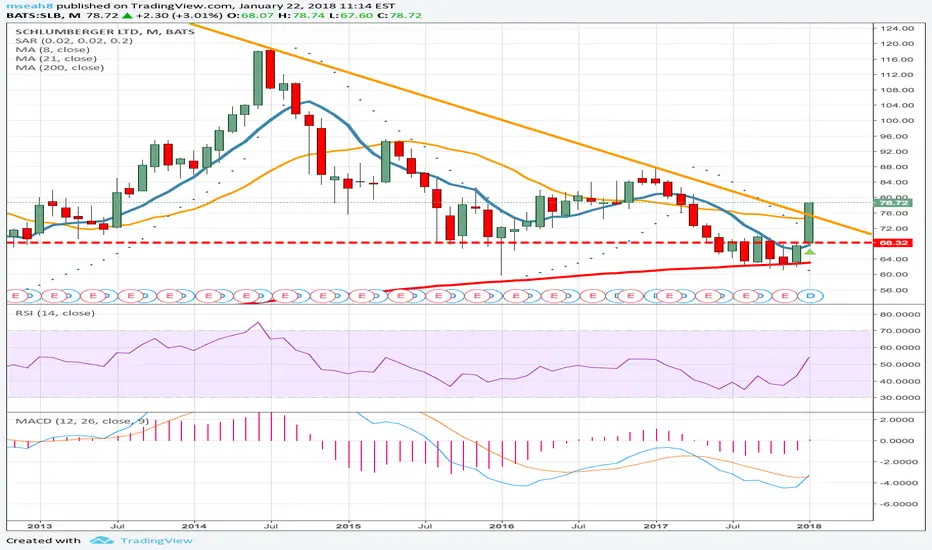
№1 Oil stock to buy and hold for long-term?Everything is perfectly shown on the chart. The company has quite good fundamental indicators, really good and stable dividends. I think that now is a great technical situation to buy this stock for long-term run.
SLB to fallThe SLB might face a little drop to close the market gap and also as we just saw it broke the triangle that just recently been retested!!!
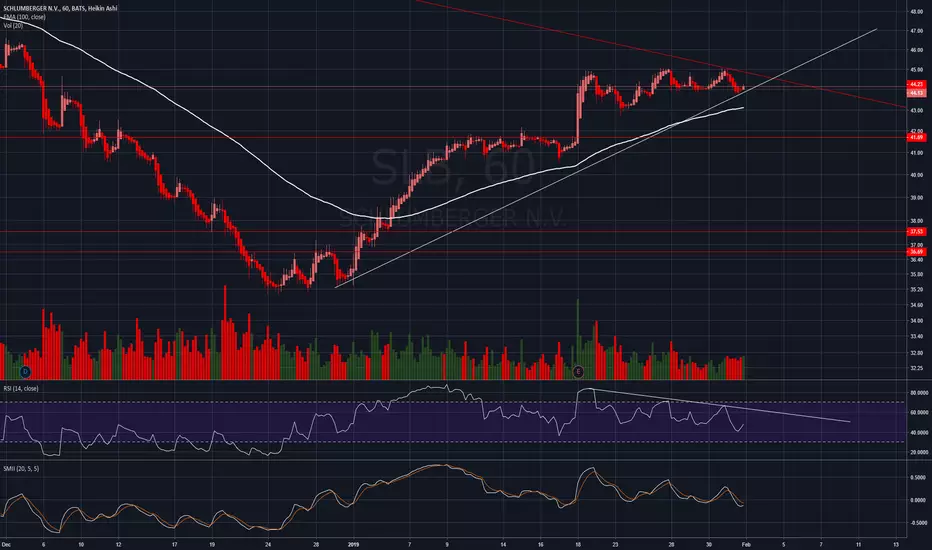
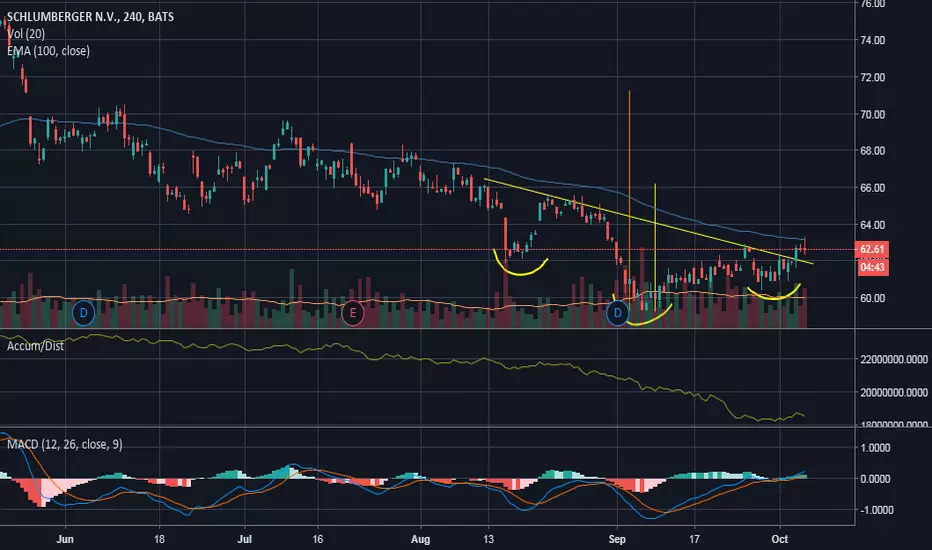
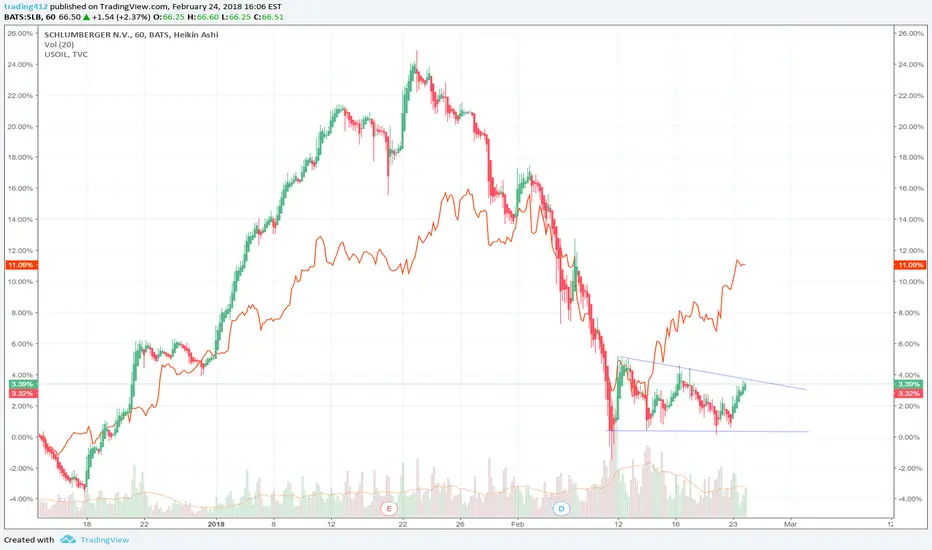
Schlumberger Key Battle, Breakout or Breakdown???On the Hourly chart SLB is in a short term bull trend (White Diagonal Line), meeting the long term downtrend resistance (Red Diagonal Line). Although WTI seems to be on an uptrend, it does not look like it may have a positive correlation for price for SLB in terms of a swing trade.
Beatish Sentiment:
The RSI has shown oversold and the SMII is down trending, which points to a most probable scenario of a breakdown in the short term swing trade. Should price breakdown below the diagonal white line and below the 100 EMA, an opportunity to enter a short is on the table. The red horizontal lines are support/resistance for price should there be a breakdown.
Bullish Sentiment:
If the price makes a clear break above the long term diagonal red line, then this could be an opportunity to enter a long trade on the breakout.
Eyes will be on SLB for the next 2 days, to see which direction it will take.
Happy Trading :0)
This is not advice to buy or sell, it is only meant for educational perspective.
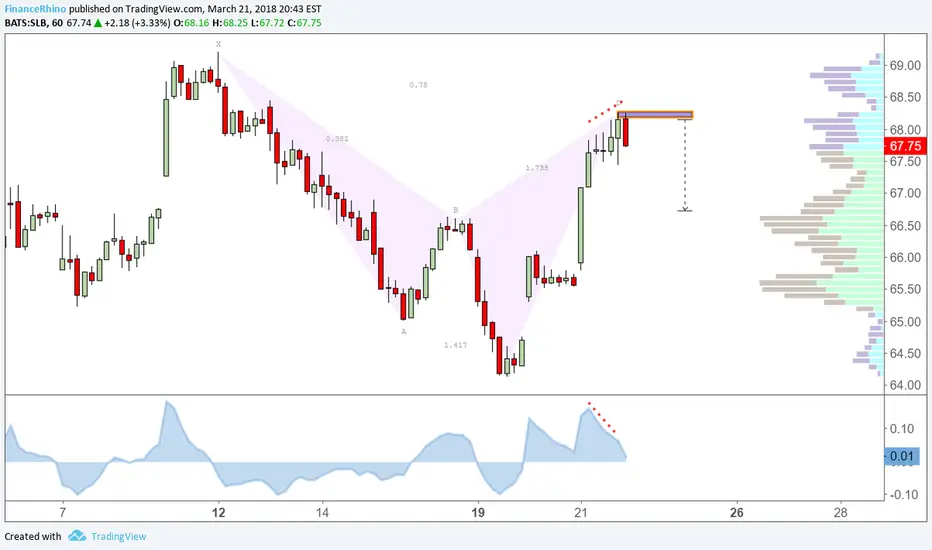
90% chance of breaking the top - German Oil StockHave been waiting for it to break the low. Very bullish abc regular flat pattern.
Where will Energy bottom? part 2Another midpoint here suggesting at least an intermittent bounce in energy coming up.
Looking for Schlumberger, a good proxy for oil, to bounce off 27.30 zone... will it hit this zone at the same time my previous heating oil chart bottoms?
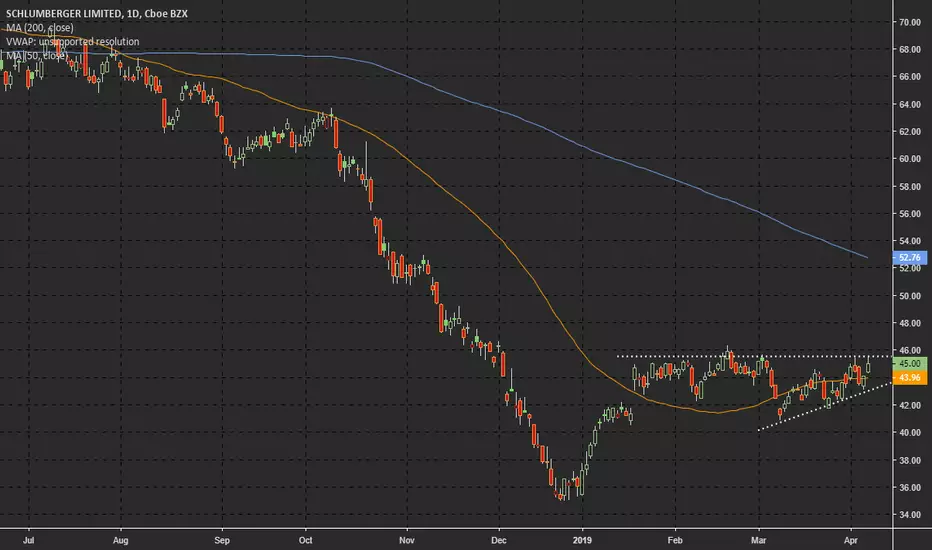
SLB Inverse H&S BreakoutInverse H&S pattern for SLB broke out at $62.13. Neckline is pretty slanted, so conservative target $66.11, ambitious target of $71.23
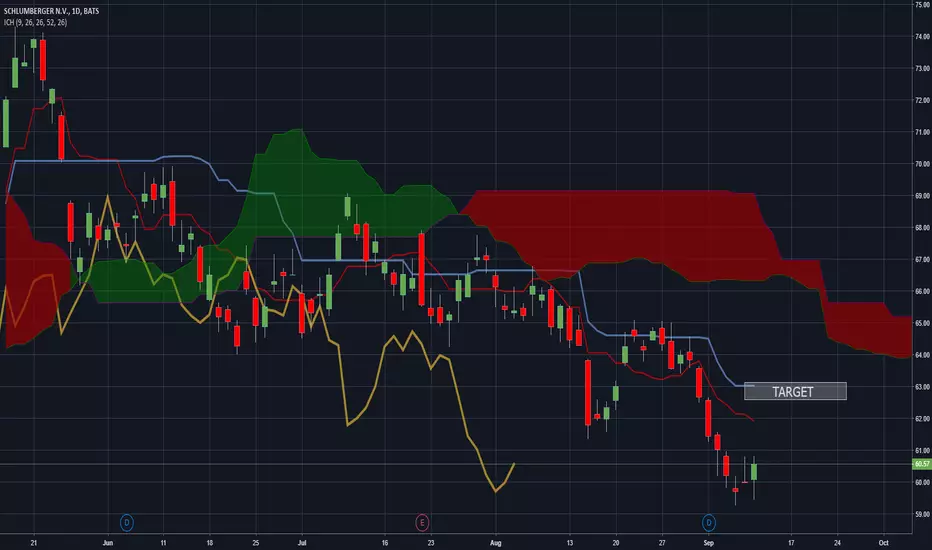
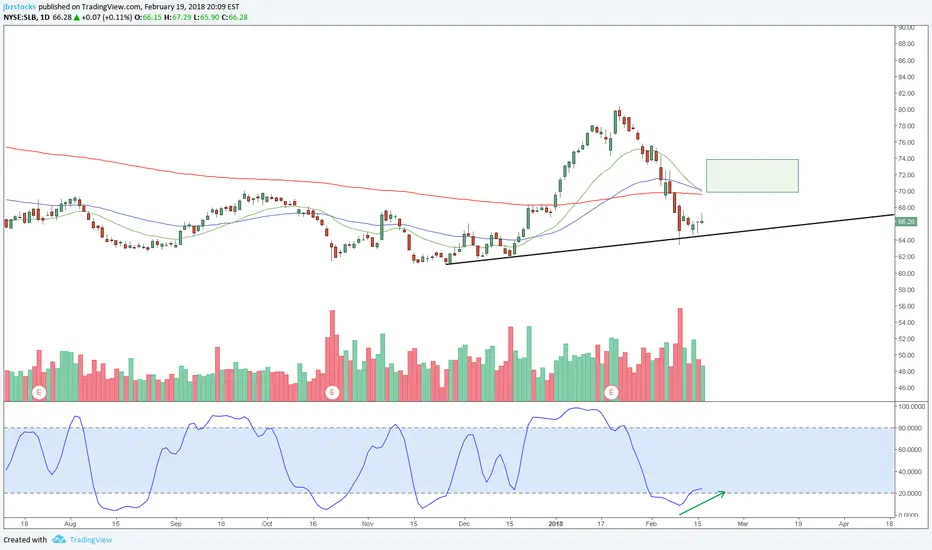
SCHLUMBERGER LOOKING BULLISH ON D1* Some indicators are bullish.
*Target is Kijun-Sen (blue line) area and fibonacci ret. 0,618 for this week.
SLB shortWait for price to rally to 76.54
confirm IV 1/2
buy 80/70 bear put spread with 100+ DTE
Exit at target

set up to break outmay follow oil higher, bullish if SLB can breakout of this wedge, haven't considered potential future supply-demand change in oil
Early Jump Into DowntrendShort but sharp downtrend may be forming; placing early (riskier) PUT option
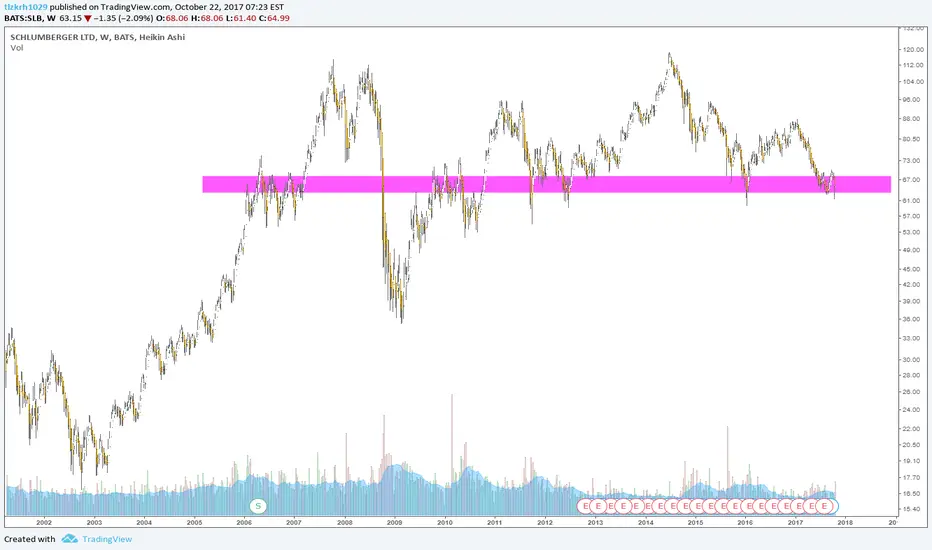
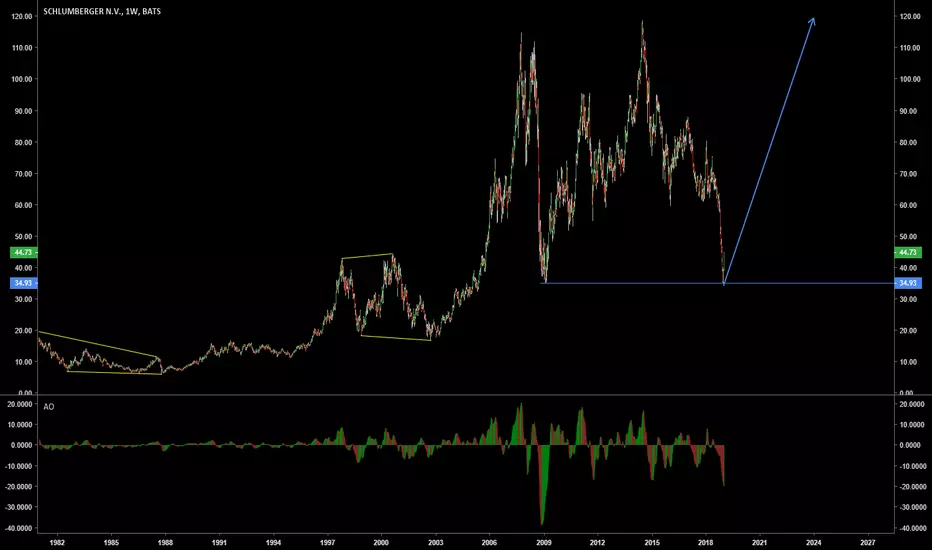
SLB, double bottom model, road to $100- broken trendline in monthly chart, confirmed long term uptrend
- double bottom in both WEEKLY AND MONTHLY CHART
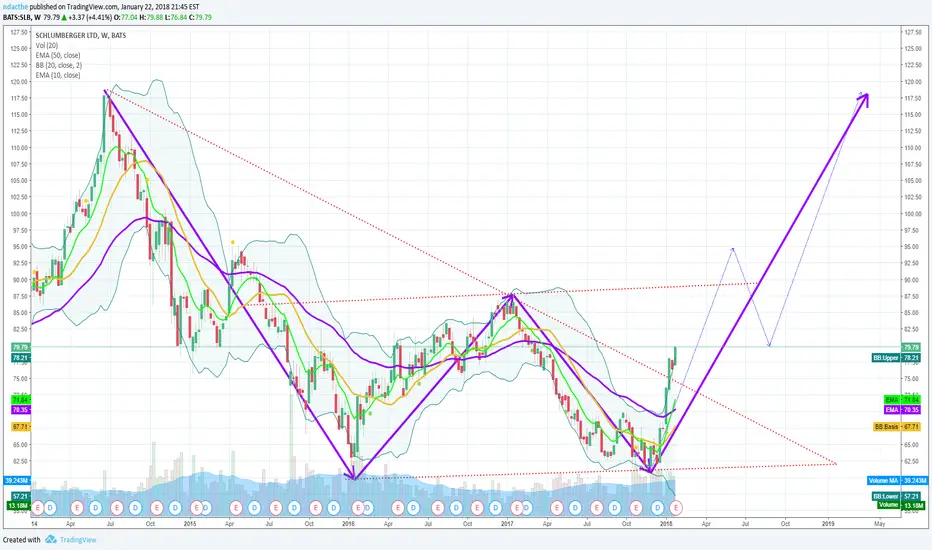
SLB has double bottom (W) model in weekly chart, it is going toW model, already reached bottom, SLB is now going to follow a long-term uptrend

within the Strong support areaif it breaks completely,
i'd sell this stock
it's for educational only.