Stock Earnings Watch: August 12th - 13thInvestors, mark your calendars! A few notable companies are set to report their quarterly results on Monday and Tuesday. Let’s take a closer look at what’s expected:
Monday, August 12th
Rumble (RUM 📹)
The video-sharing platform is expected to post an EPS of -0.15 and revenue of 19.69M. With a beat rate of 42%, investors will be watching closely to see if Rumble can outperform expectations. Last year, they reported an EPS of -0.15 and revenue of 24.97M.
TeraWulf (WULF 🐺)
TeraWulf, involved in cryptocurrency mining, is set to announce an EPS of -0.01 and revenue of 35.43M. The company has a beat rate of 40%, so it will be interesting to see if they can manage a surprise. Last year, they posted an EPS of -0.08 and revenue of 15.45M.
Tuesday, August 13th
Home Depot (HD 🏡)
The home improvement giant is anticipated to report an EPS of 4.50 and revenue of 43.37B. With a stellar beat rate of 95%, will Home Depot continue to deliver strong results? Last year, they reported an EPS of 4.65 and revenue of 42.91B.
🔍 As these companies reveal their financial health, it's crucial to pay attention not just to the numbers but to the broader implications for their industries and the economy as a whole. Stay tuned and keep your portfolios ready for any market-moving surprises!
#EarningsSeason #StockMarket #InvestmentInsights
4HD trade ideas

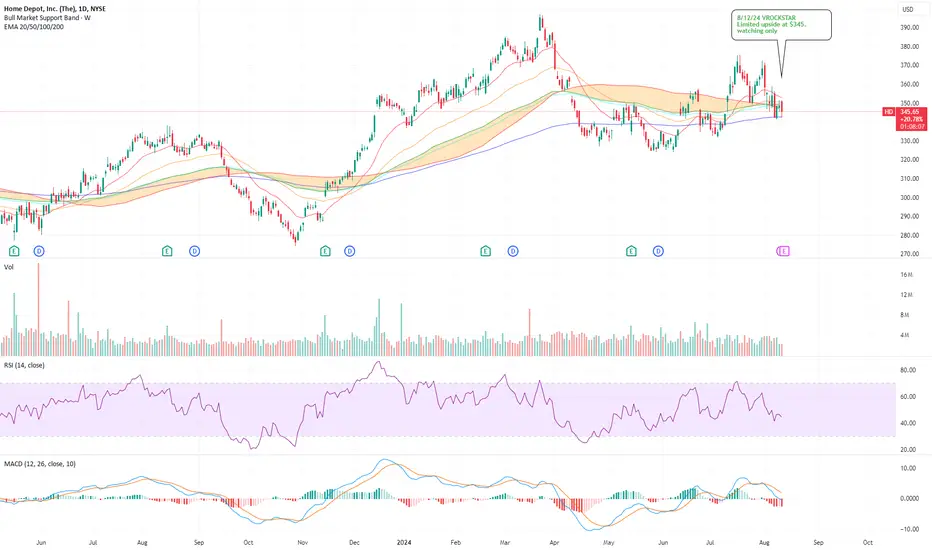
8/12/24 - $hd - Limited upside at $345. watching only8/12/24 :: VROCKSTAR :: NYSE:HD
Limited upside at $345. watching only
- we've seen the housing starts linger
- rate cuts probably need 3-6 mo to drive inflection on build capex
- HD remains excellent biz, but at nearly 27x PE (when you adj. for net debt), and flat EPS that's a tough one for me to stomach.
- feels like this is sticky valuation for the fact that it's such a large cap and being supported by passive flows
- "feels" to me like a good result gets trimmed/ right sized lower (by institutions) and a bad result is a tough one to buy esp w the macro backdrop.
- at 4.5% fcf yield even with zero growth this looks better than cash (but honestly there's a lot of stuff that's large cap that does) which means the downside is probably not one of these wicked drawdowns we've been seeing on the sub $1 bn cap stuff.
- i'd be interested in dip buy/ swing on a big enough drawdown or bad CC speech or w/e.
- just don't see the upside r/r playing this to the long side into print
gl to the holders. lmk if u see it differently.
V
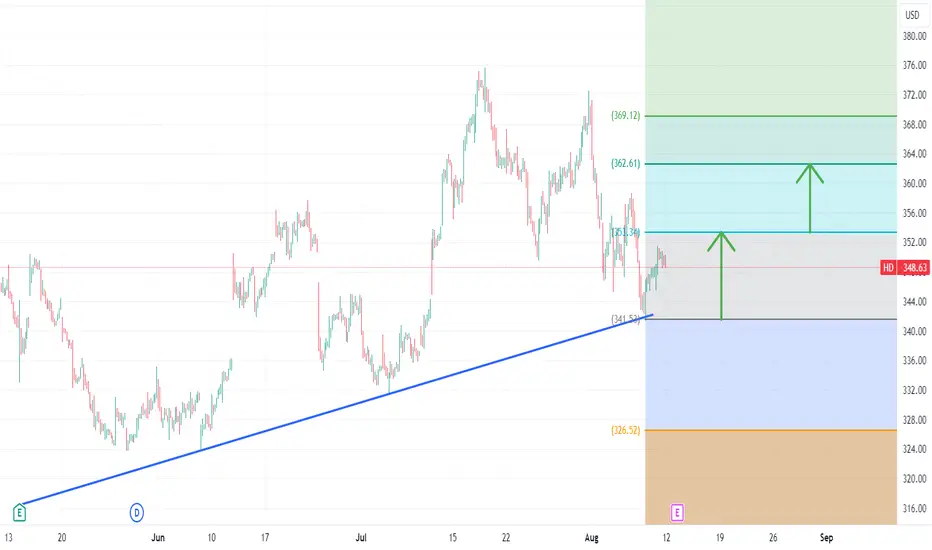
Home Depot (NYSE:HU) UptrendLine Rejection At $341.53 12.08.2024Apply risk management
Risk Warning: Trading in CFDs is highly speculative and carries a high level of risk. It is possible to lose all of your invested capital. These products may not be suitable for everyone, and you should ensure that you fully understand the risks taking into consideration your investment objectives, level of experience, personal circumstances as well as personal resources. Speculate only with funds that you can afford to lose. Seek independent advice if necessary. Please refer to our Risk Disclosure.
BDSwiss is a trading name of BDS Markets and BDS Ltd.
BDS Markets is a company incorporated under the laws of the Republic of Mauritius and is authorized and regulated by the Financial Services Commission of Mauritius ( FSC ) under license number C116016172, address: 6th Floor, Tower 1, Nexteracom Building 72201 Ebene.
BDS Ltd is authorized and regulated by the Financial Services Authority Seychelles (FSA) under license number SD047, address: Suite 3, Global Village, Jivan’s Complex, Mont Fleuri, Mahe, Seychelles. Payment transactions are managed by BDS Markets (Registration number: 143350)
Disclaimer
Buying $HD august16 370 callsSee chart above al anchored vwaps from key areas , this one does include there earnings report but if we are at or above strike before earnings day i will probably take some profits off
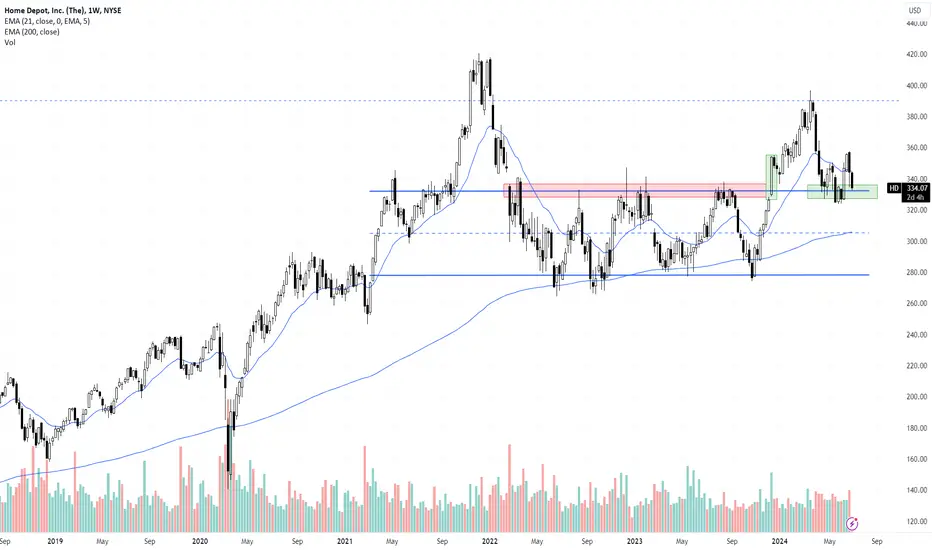
HD in weekly chart (Update)Hello
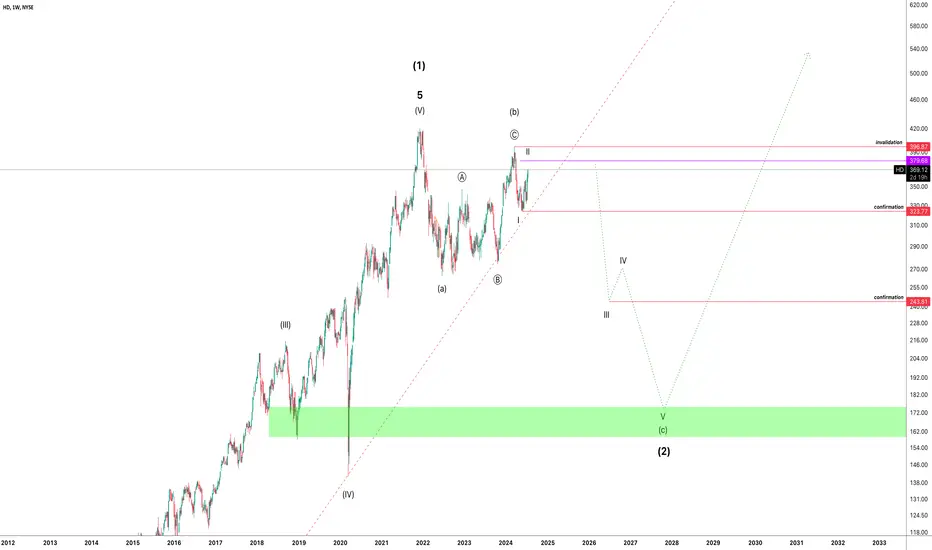
Nothing changed from may last published idea about HD and I just want to share a bigger scale of my view. These days index charts are more complicated. For example in Nasdaq some symbols (AI based technologies for example) are unpredictably rising and this happens in the opposite direction of others and they are making a large over buy zone that is so much powerful. In my opinion HD might continue more for its deeper corrections before start a huge rally as wave (3) Millennium.
Do not forget confirmations.
Thanks
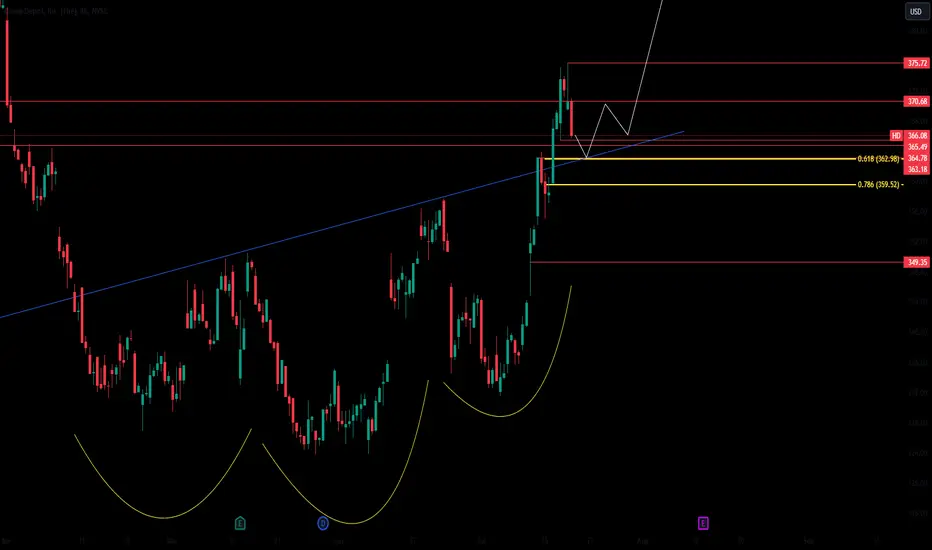
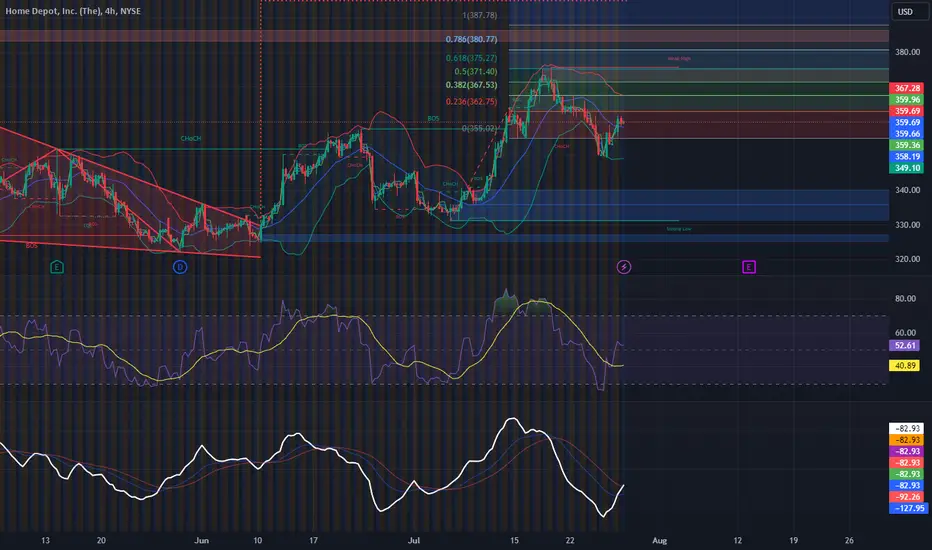
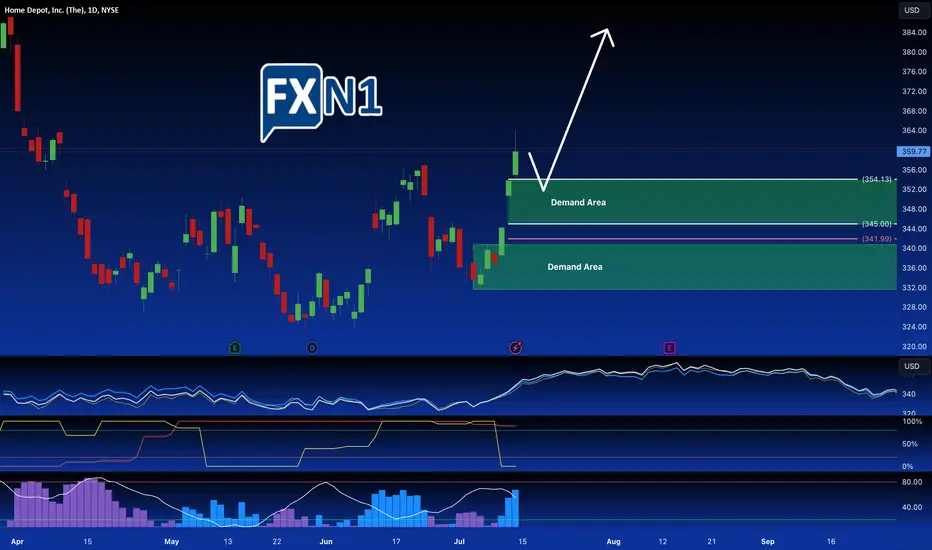
The Home Depot Stock Embarks on Seasonal Bullish TrendThe Home Depot Inc. (HD) stock is entering a seasonal uptrend following the formation of a potential head and shoulders pattern at its recent bottom. This technical formation, often indicative of a reversal, has paved the way for a new bullish impulse, with the current price standing at $359.77.
Our analysis suggests a promising opportunity for a long position as the stock embarks on this upward trajectory. The bullish sentiment is further reinforced by the seasonal patterns historically observed in Home Depot's stock performance during this period. With this backdrop, we are closely monitoring the price action for a retest of the previous demand area at $354.13.
This demand area, which previously provided substantial support, is a critical level to watch. A successful retest and bounce from this zone would validate our bullish outlook and provide a favorable entry point for a long position. The target for this move extends through to September, aligning with the typical seasonal strength observed in Home Depot's stock.
The head and shoulders pattern observed at the bottom is a classic reversal signal, suggesting that the prior downtrend has likely concluded, and a new uptrend is underway. The recent bullish impulse from this pattern adds credence to the potential for continued upward movement.
Investors should consider the broader market environment and Home Depot’s fundamental strengths. As a leading retailer in the home improvement sector, Home Depot benefits from strong consumer demand, especially during the summer months when home improvement projects typically increase. Additionally, any positive economic indicators or consumer confidence data could further bolster the stock’s performance.
In conclusion, with Home Depot stock currently priced at $359.77 and showing signs of a seasonal bullish trend, we are preparing to open a long position on a retest of the $354.13 demand area. This strategy aims to capitalize on the anticipated bullish momentum through September, supported by the head and shoulders reversal pattern and historical seasonal trends. Investors should remain vigilant, keeping an eye on key support and resistance levels to make informed trading decisions.
✅ Please share your thoughts about HD in the comments section below and HIT LIKE if you appreciate my analysis. Don't forget to FOLLOW ME; you will help us a lot with this small contribution.
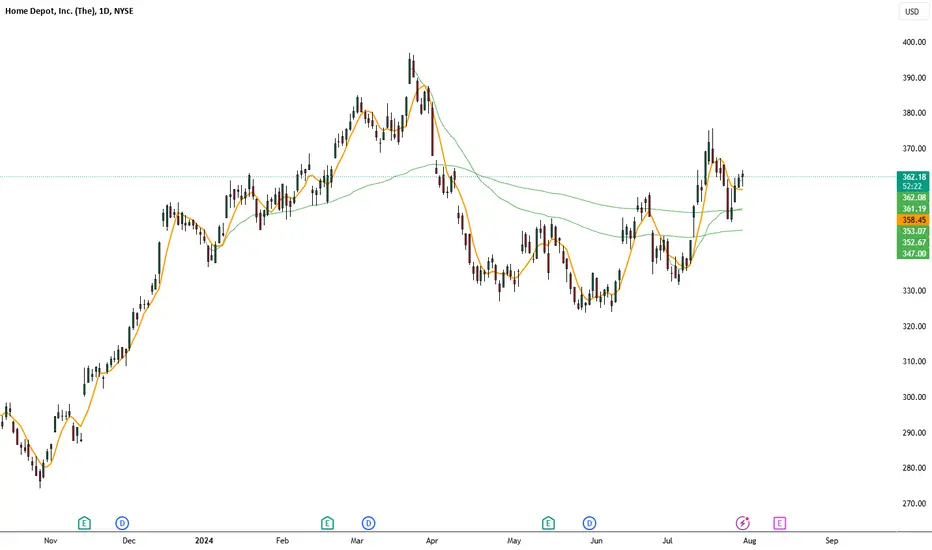
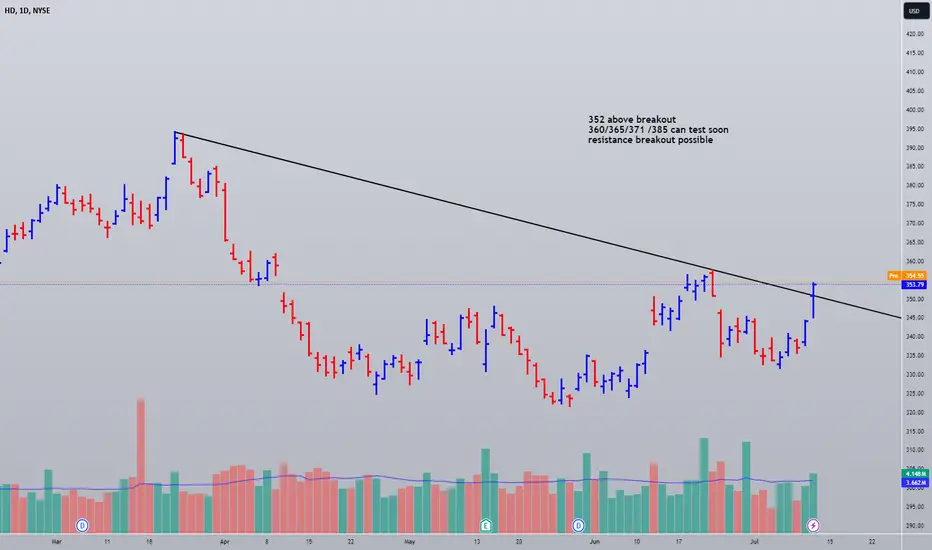
HD Trendline breakout 352 above breakout
360/365/371 /385 can test soon
resistance breakout possible
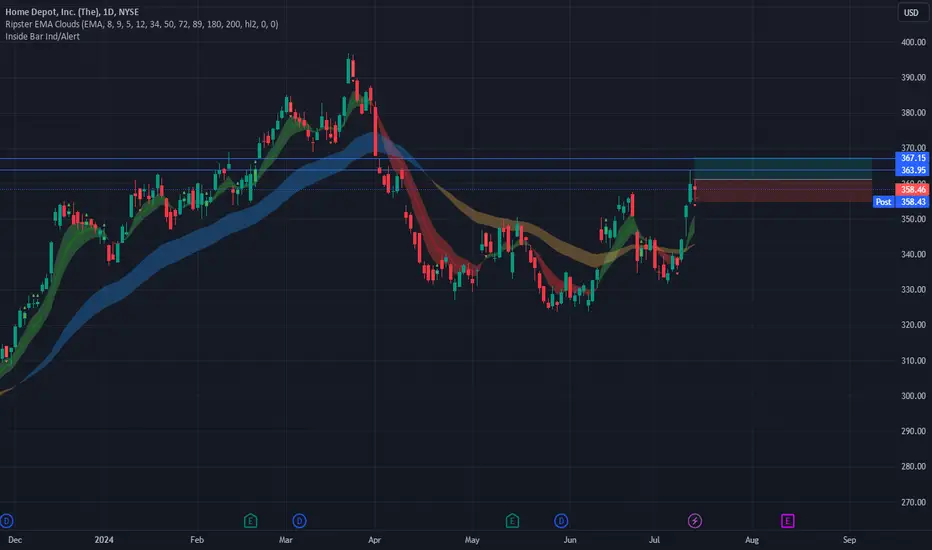
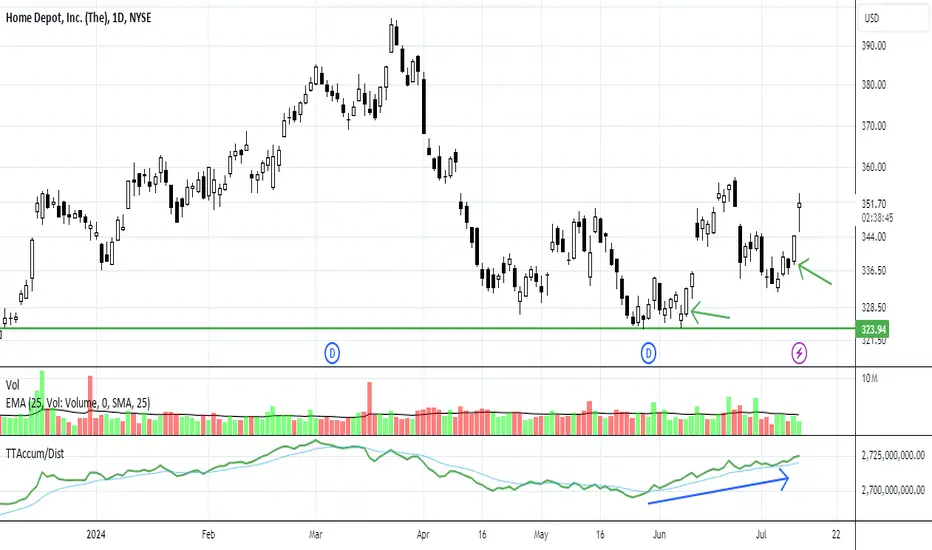
ETF Developers Buying Ahead of Q2 Earnings Reports: HDThis Dow component was the highest gainer for the average with a modest 2.10% gain yesterday. NYSE:HD price action was very controlled. Volume was slightly below average indicating it was likely ETF developers buying ahead of the earnings report.
Accumulation/Distribution indicator confirms this price range is a buy zone.
This is a technical setup to watch for pre-earnings runs for swing trading.
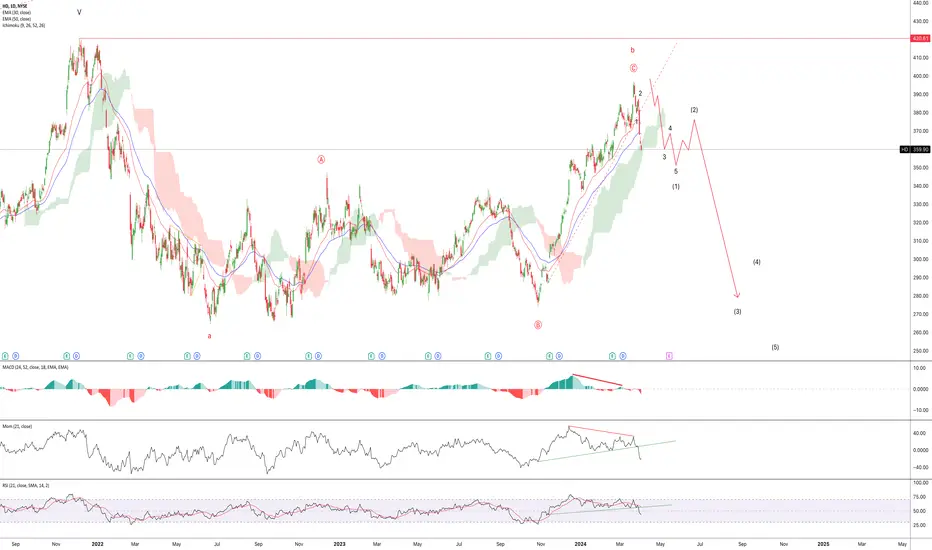
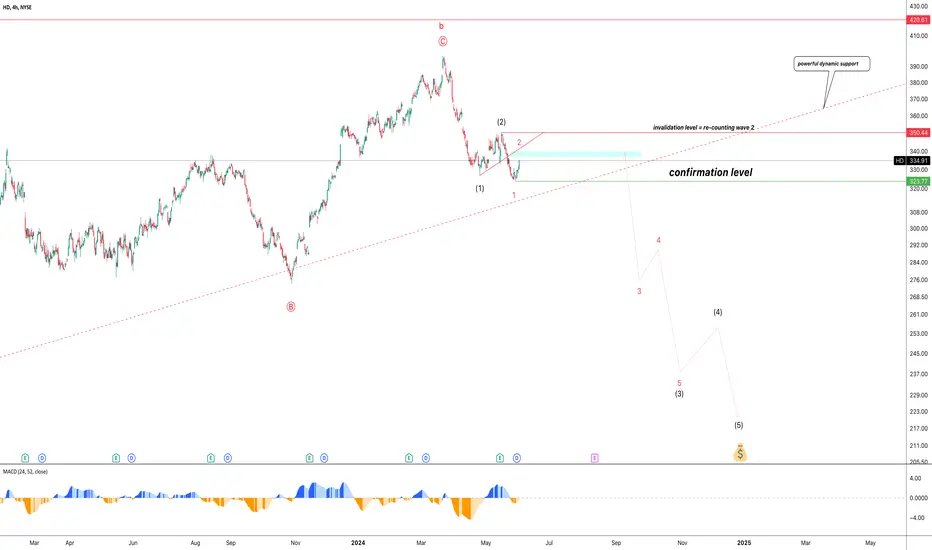
Home Depot (HD) in Daily ChartHello
After Oct 2023 HD started to make a rally and now it seems that it is tired and reversed but I do not confirm a bearish market for HD unless I can count a bearish impulse wave. According to the chart, wave 1 and 2 minor ended and we in wave 3 unless it was an abc and trend continutes to its bullish movements.
What makes it clear for us is that we can complete 5 waves minor (Wave 1 Intermediate) and then its correction as an ABC (Wave 2 Intermediate) and after all these confirmations and also trigger break out, momentum, Ichimochu and MACD and RSI and .... (Whatever you have for your technical confirmations) we can get a SELL POSITION.
ENJOY THIS CHART
Thanks
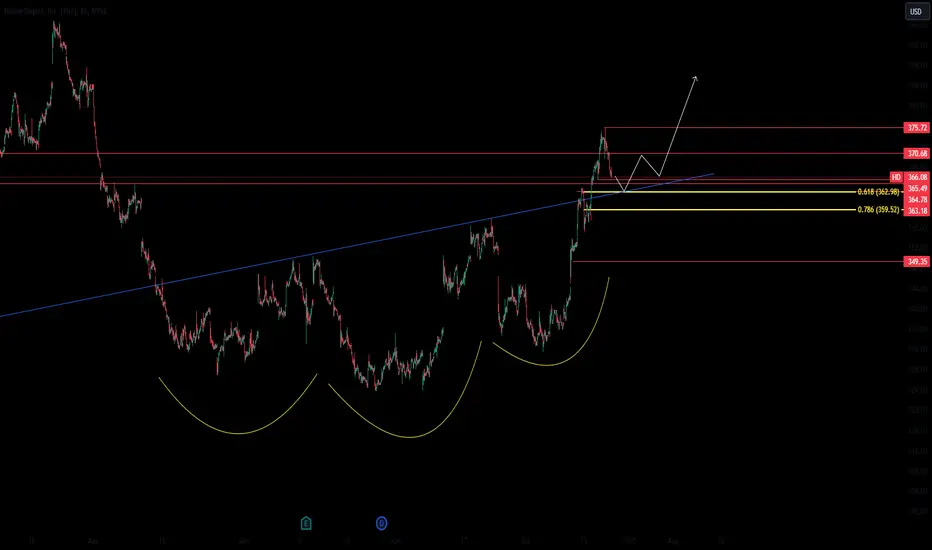
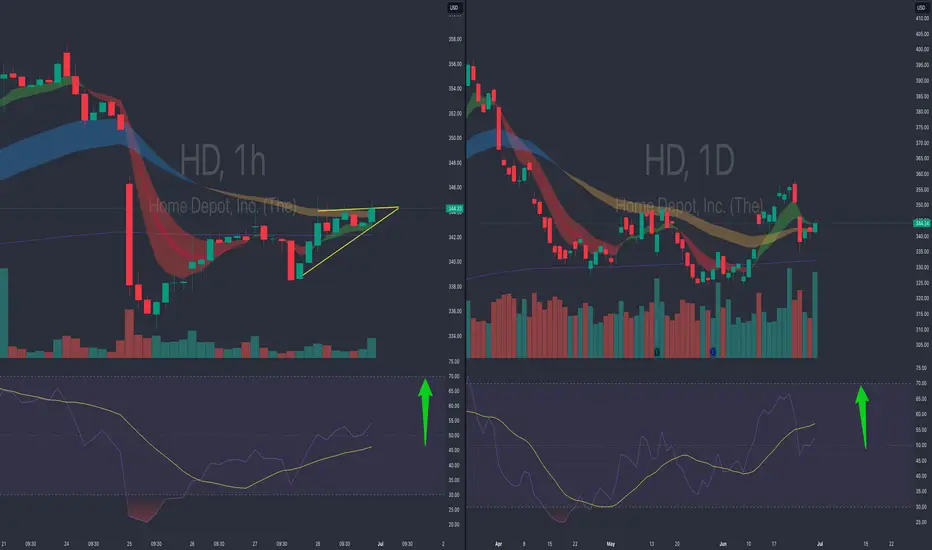
HD update in H4 chart Hello
We have discussed about this trend and its opportunities in our last published idea and nothing is changed. I just want to give a complementary wave counting.
In addition, the best wave for trade in EW method is wave 3 of 3 specifically in bearish market. I do not know if this counting is true or not, but we can confirm it if it drops down.
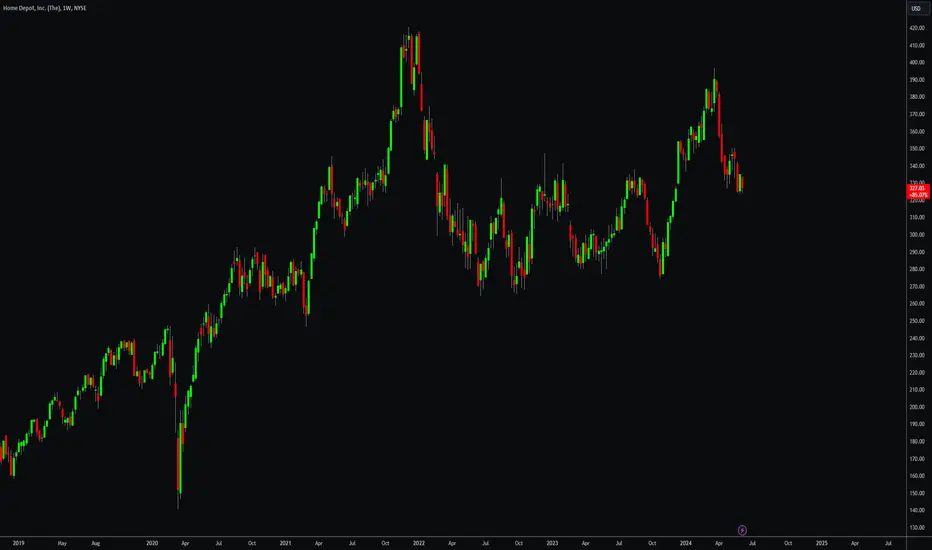
HD (Home Depot) Weekly Chart AnalysisHD's share price has been choppy around the last quarter of 2021 and has been trading between the $270 to $330 range in 2022 and for most of 2023. In the last quarter of 2023, HD's share price broke out of the range of $330 and has pulled back to the top of the range where it was once resistance (highlighted red). It now shows support and consolidation in the $330 price range, which can be viewed as a good price level for entry. If the price were to break down below $330, the next potential level will be $300 and $280.
HD - Double Top DropDouble top at the red top horizontal
Could drop down to the dotted white line
I dont know if the green trend line will persist any longer
Daily chart
$HDNYSE:HD setting up nice ascending triangle on hourly timeframe, once we get able 345, we should fill that gap above 350-360, Consolidation is building nicely on the daily as well.
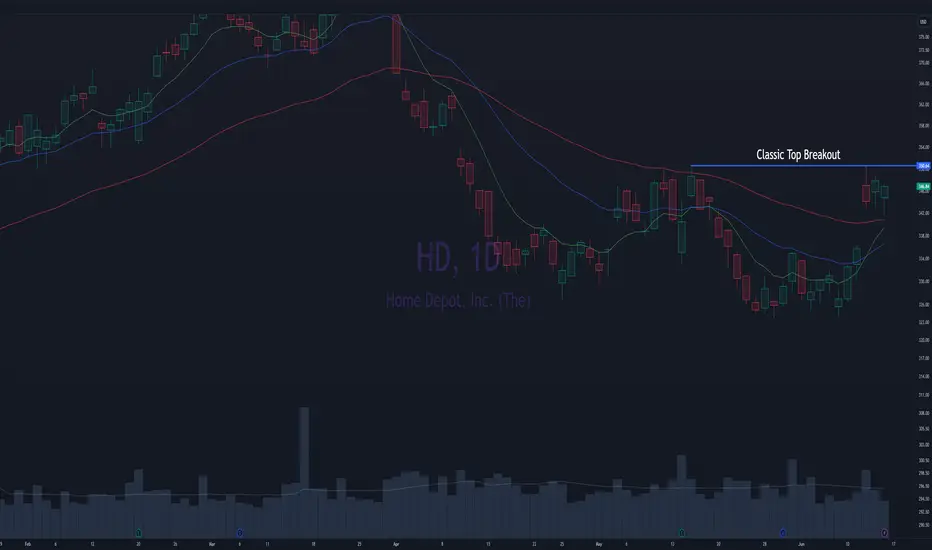
Home Depot Classic Top Breakout/Cup & HandleHome Depot setting up for a top bullish breakout. You might call it as a cup and handle as well.
1st Profit Target: 365
Stop Loss: 335
Never forget to manage your risk and ensure the broader market has your back.
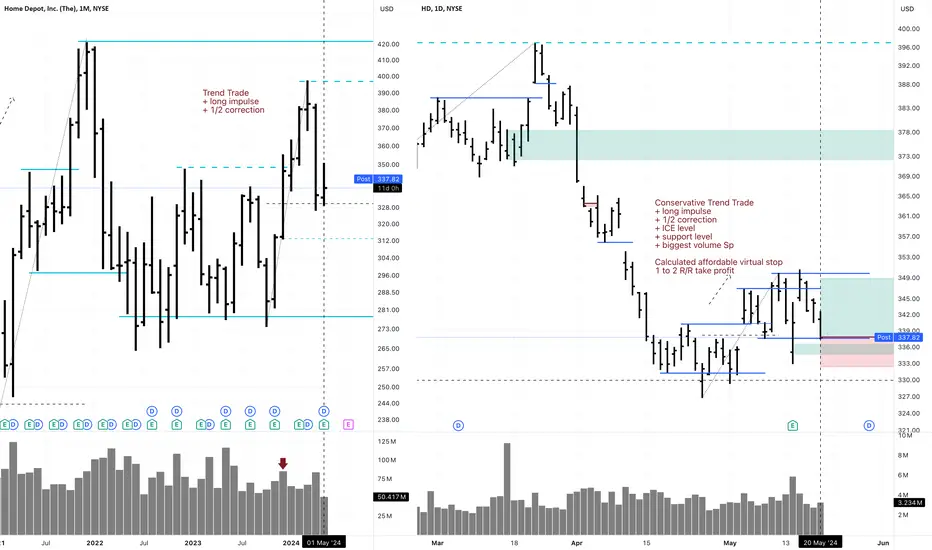
Conservative Investment Trend Trade HD LongMonthly Trend Trade
" + long impulse
+ 1/2 correction"
Daily Conservative Trend trade
"+ long impulse
+ 1/2 correction
+ ICE level
+ support level
+ biggest volume Sp"
Calculated affordable virtual stop loss
1 to 2 R/R take profit
Broker set up:
May-20-2024
Buy HD at Market (Day)
May-20-2024
OCO 3A: Sell HD Stop at $332.37 Limit at $337.86 (Good 'til Canceled)
May-20-2024
OCO 3B: Sell HD Limit at $348.84 (Good 'til Canceled)
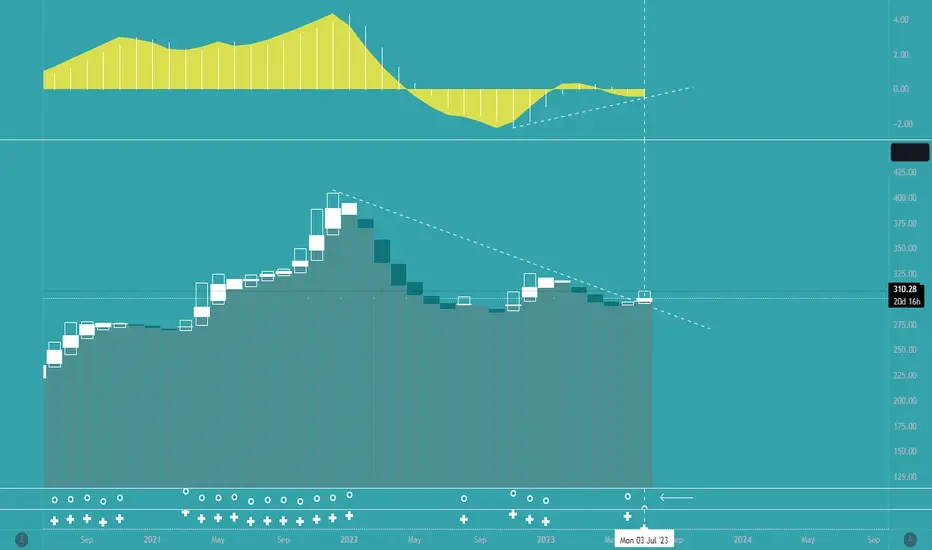
HD, New long term base created, expect NEW PRICE GROWTH!NEW BASE created for new GROWTH.
With a company like HD with solid fundamentals -- this should be a no brainer be part of your portfolio.
KEY NOTES: MONTHLY DATA
HIGHER Lows on monthly data:
Double bottom rebound.
78.6 FIB level touch (bargain), currently bouncing off with precision.
Monthly descending trendline BREAK. Huge hint.
Massive net buying volume at current range.
Spotted at 310.
-------------------------------------------------------
*Something to factor in as well
Last earning calls May 2023
EARNINGS: 3.82
REVENUE : 37.25
Upcoming earning calls (expected) August 2023
EARNINGS: 4.44
REVENUE : 42.2
-------------------------------------------------------
TAYOR.
Safeguard capital always.
BUY HDInvesting differs from trading as it focuses on long-term growth and sustainability of assets rather than quick gains. An investment idea involves committing money to ventures, projects, or assets expected to grow in value over time, such as stocks, bonds, or real estate.
Investing requires understanding the fundamental factors that drive growth and stability. It involves detailed analysis of opportunities, like evaluating a company's financial health and potential for innovation, to minimize risk and maximize long-term gains.
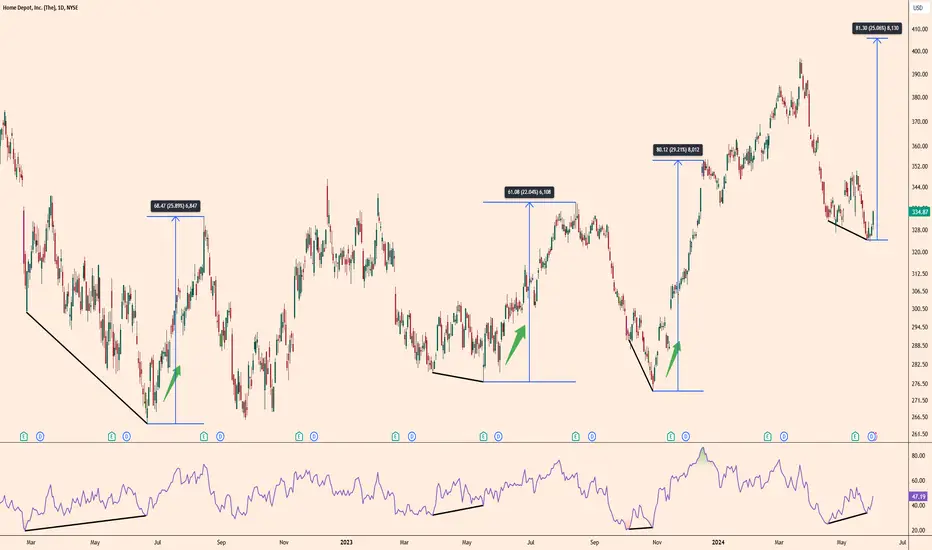
Home Depot DivergenceHome Depot is a stock that loves bull and bear divergences in technical terms. There have been 3 bullish divergences since 2022, all of which have brought an average return of around 25%. The last divergence is now in place and a potential 25% return would push the stock over $400.
Home Depot Posted First-Quarter Earnings That Beat Expectations Home Depot ( NYSE:HD ) reported disappointing first-quarter earnings and revenue that missed Wall Street's expectations. The company is experiencing customers deferring major home projects due to high interest rates, which has led to a focus on building its business with professionals, including through its acquisition of SRS Distribution. The company expects total sales to grow about 1% in fiscal 2024, including an additional week from the prior year. However, it anticipates comparable sales, which take out the impact of store openings and closures, to decline about 1%, excluding that additional week.
Home Depot's Chief Financial Officer Richard McPhail said customers are in a waiting game that began in the second half of last year, as they responded to mortgage rates climbing. He said the company anticipated those trends would continue. "The home improvement customer is extremely healthy from a financial perspective," he said. "What they tell us is they're just simply deferring these projects as given higher rates, it just doesn't seem the right moment to execute."
Home Depot's sales for the three months that ended April 28 compared with what Wall Street expected, based on a survey of analysts by LSEG:
Earnings per share: $3.63 vs. $3.60 expected. Revenue: $36.42 billion vs. $36.66 billion expected. Net income for the fiscal first quarter decreased to $3.6 billion, or $3.63 per share, from $3.87 billion, or $3.82 per share, in the year-ago period. Net sales fell 2.3% from $37.26 billion. Comparable sales dropped 2.8% in the fiscal first quarter across the business and declined 3.2% in the U.S.
Home Depot ( NYSE:HD ) has seen sales moderate after more than two years of explosive demand during the COVID-19 pandemic. The company posted its worst revenue miss in nearly two decades and cut its forecast in the year-ago first quarter. Home Depot's sales totaled $152.7 billion in the fiscal year that ended in late January, a drop of 3% year over year.
Inflation may also be playing a role in that pullback, as consumers spend more money on essentials and have to make trade-offs when spending discretionary income. However, McPhail said Home Depot is not seeing customers trade down to cheaper items, like less expensive power tools or appliances. He pinned the company's softer sales in large part on consumers' "deferral mindset" and a housing market that has slowed dramatically.
To overcome slower sales, Home Depot ( NYSE:HD ) has revved up its strategy to attract pros, since they tend to buy larger quantities and offer a steadier source of sales. In March, Home Depot announced that it would acquire SRS Distribution, a Texas-based specialty distributor of roofing, landscaping, and pool supplies, for $18.25 billion in the largest acquisition in the company's history.
Along with wooing pros, Home Depot ( NYSE:HD ) is poised to drive growth by opening about a dozen new stores this fiscal year and adding features to improve its online and in-store experience. Shares of Home Depot closed Monday at $340.96. So far this year, Home Depot's shares have fallen about 2% compared with the roughly 9% gains of the S&P 500.
