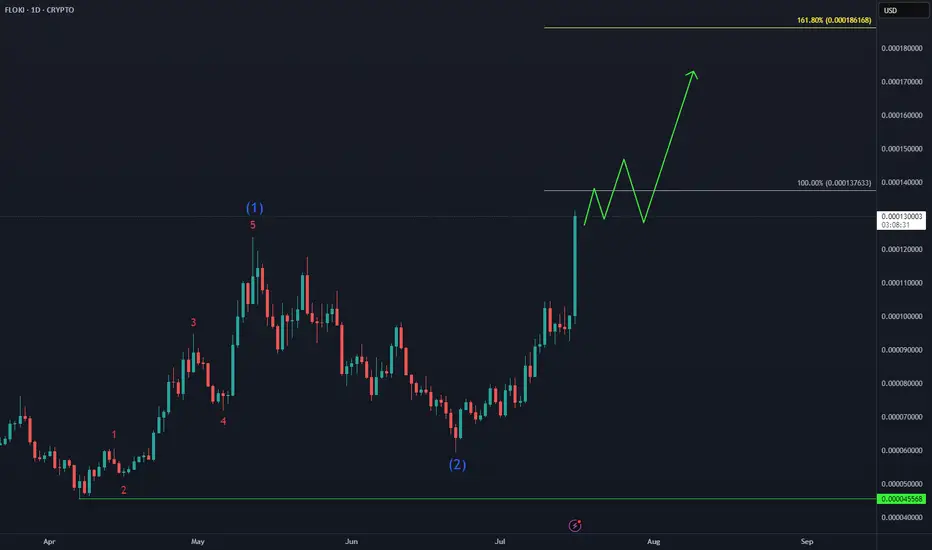
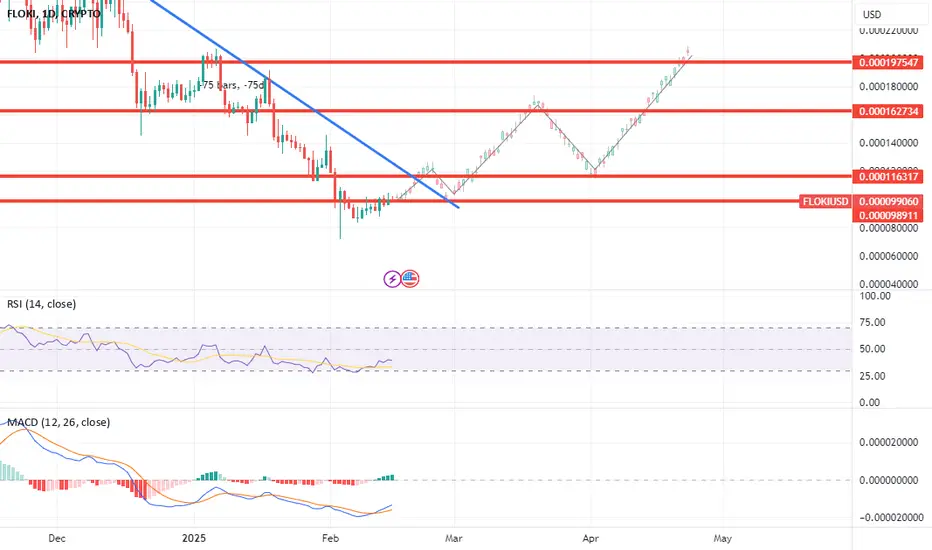
FLOKI Isn’t Missing the Party🚀 CRYPTO:FLOKIUSD Price has broken above the May peak, confirming a bullish continuation. With momentum building, price is now eyeing the next upside target near $0.00018.
#elliottwave #memecoins #altseason
Trading activity
Transactions 62
BuysSells
3923
Volume 2.88 KUSD
Buys volumeSells volume
1.59 K1.29 K
Traders 51
BuyersSellers
3021
About FLOKIVVS_3B3AE4.USD
Related DEX pairs
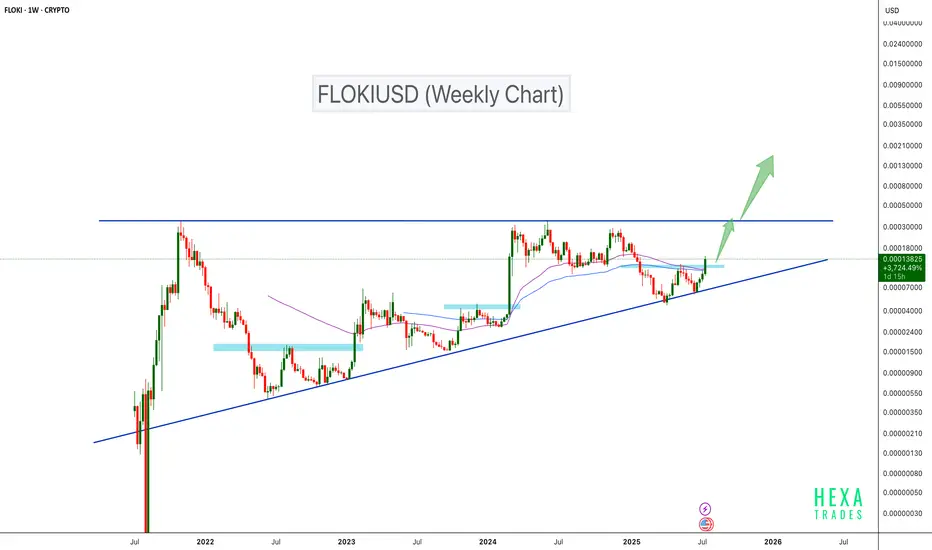
FLOKIUSDT Breaks Key Resistance – Bullish Continuation Ahead?BINANCE:FLOKIUSDT is trading inside its longest ascending triangle. The price has respected the triangle's support and bounced back. It has now broken a key resistance zone. As seen in the chart, every time the price breaks a major resistance, a bullish move follows, and we can expect a similar sce
Floki nice 100% trade!!Looks like a head and shoulder pattern is forming. Nice 99%. Put buyorder on right shoulder. Take profit on 2.0 fib
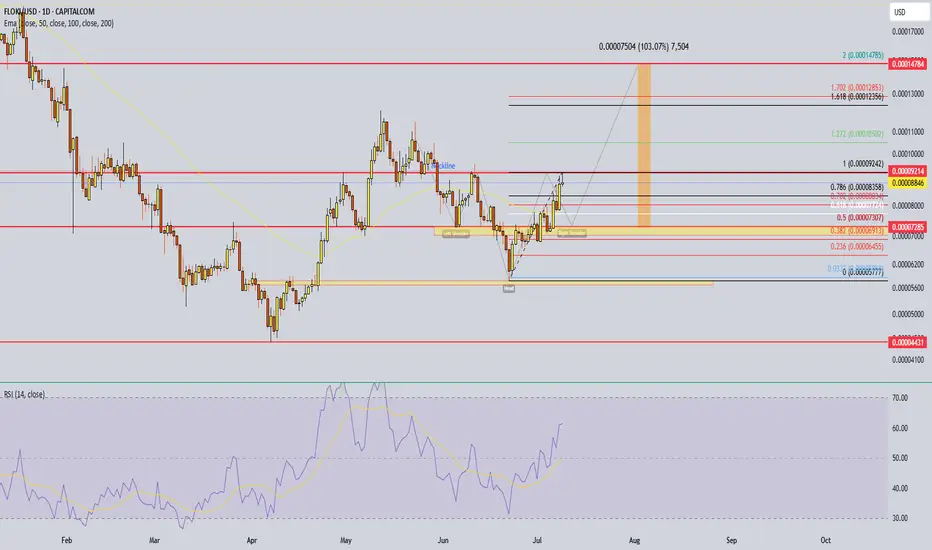
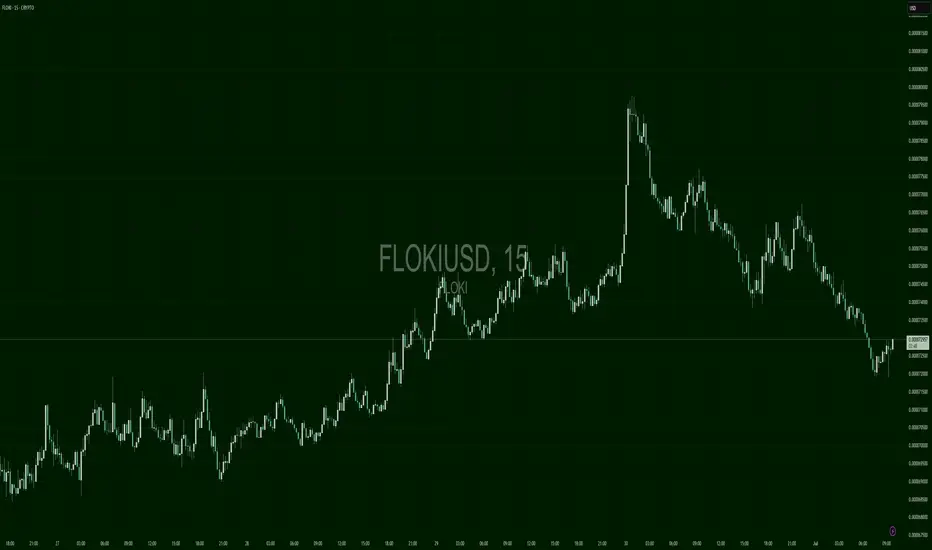
FLOKIUSD – Impulse and ReturnFloki launched into a sharp rally from below 0.00007200, peaking just shy of 0.00008100 before retracing. Despite the correction, the move set a new short-term high and shifted the structure bullish. Current action shows a clean pullback into a former breakout zone (~0.00007250), where price is begi
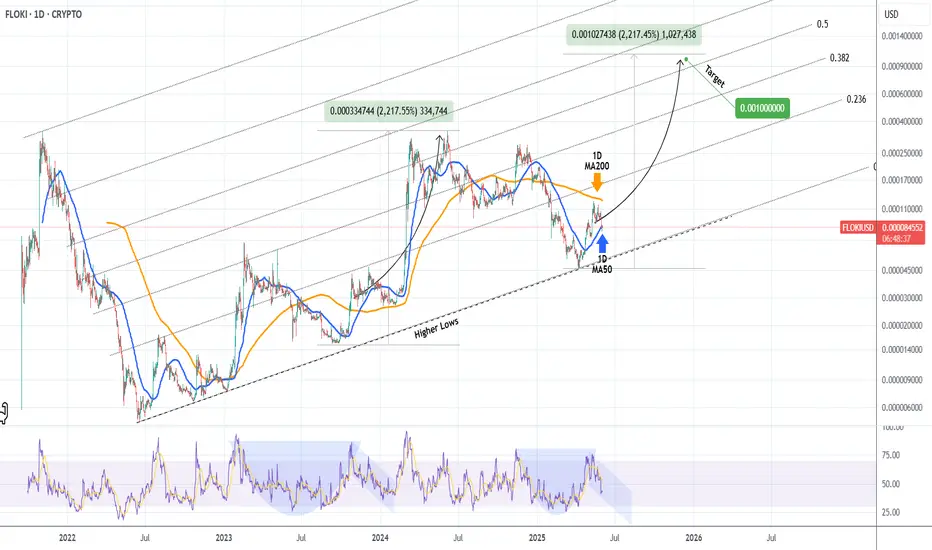
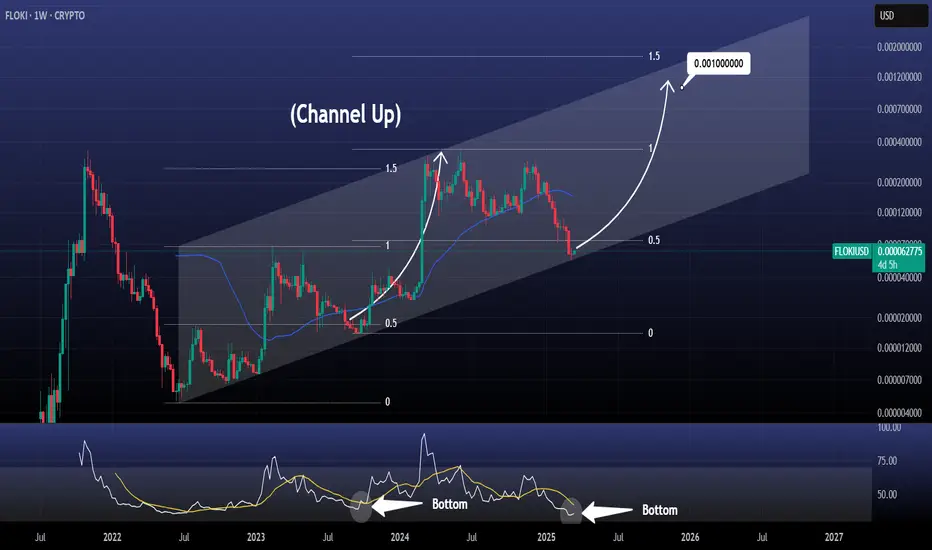
FLOKI Can it hit $0.0010 by the end of the year?Floki Inu (FLOKIUSD) made a strong rebound from its April 08 bottom, which happened to be on the Higher Lows trend-line from its 2022 Bear Cycle Low. That was a major Buy Signal long-term and right now the price has found itself ranged within the 1D MA200 (orange trend-line) and 1D MA50 (blue trend-
Solvery IG: Top 3 Meme Coins Set for a Bullish Run by End of MayAs traditional crypto markets remain volatile, meme coins are once again stealing the spotlight with rapid, speculative surges. What began as internet jokes has evolved into a category of high-risk, high-reward digital assets that traders can't afford to ignore.
The expert team at Solvery IG, known
FLOKI time for breakoutFLOKI is bouncing up and when comparing it with BTC we see same pattern in play. What I expect is breakout from ascending triangle, quick test of breakout (what BTC did recently) and then push to a meassured move target at fibb 2.0 range.
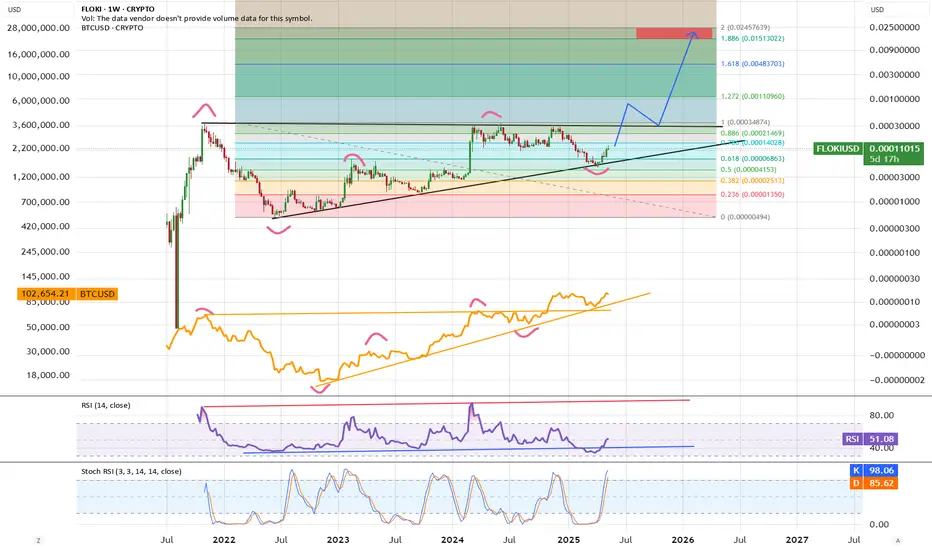
FLOKIUSD: The buy opportunity of the year.FLOKI is bearish on its 1W technical outlook (RSI = 34.609, MACD = 0.000, ADX = 19.895) hitting this week the bottom of the 3 year Bullish Megaphone. The 1W RSI is posting a sequence similar to the previous bottom on September 11th 2023. Technically a rally of identical proportions should begin to p
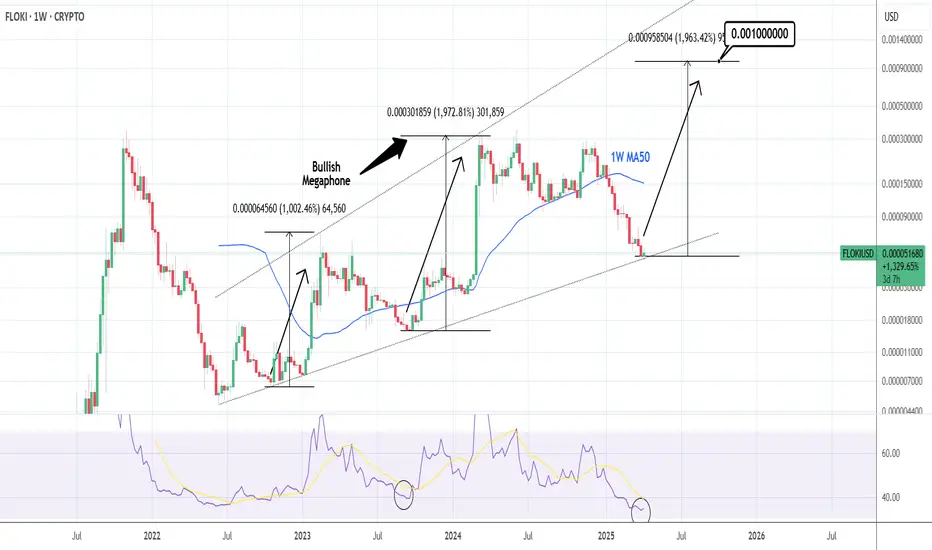
FLOKIUSD Channel Up bottomed. Best buy level for $0.001FLOKI is trading inside a Channel Up since the June 13th 2022 Bear Cycle bottom.
As the 1week RSI touched 35.00 and is holding, this is technically a strong buy indicator long term.
The price just broke below the 0.5 Fibonacci level and touched the bottom of the 3 year Channel Up.
There is no bet
raise of flokiConsidering the recent decline of floki, it seems to have a good growth. Based on this, the movement of this digital currency is probably high. Please support us by liking and sharing ideas
See all ideas
Summarizing what the indicators are suggesting.
Oscillators
Neutral
SellBuy
Strong sellStrong buy
Strong sellSellNeutralBuyStrong buy
Oscillators
Neutral
SellBuy
Strong sellStrong buy
Strong sellSellNeutralBuyStrong buy
Summary
Neutral
SellBuy
Strong sellStrong buy
Strong sellSellNeutralBuyStrong buy
Summary
Neutral
SellBuy
Strong sellStrong buy
Strong sellSellNeutralBuyStrong buy
Summary
Neutral
SellBuy
Strong sellStrong buy
Strong sellSellNeutralBuyStrong buy
Moving Averages
Neutral
SellBuy
Strong sellStrong buy
Strong sellSellNeutralBuyStrong buy
Moving Averages
Neutral
SellBuy
Strong sellStrong buy
Strong sellSellNeutralBuyStrong buy