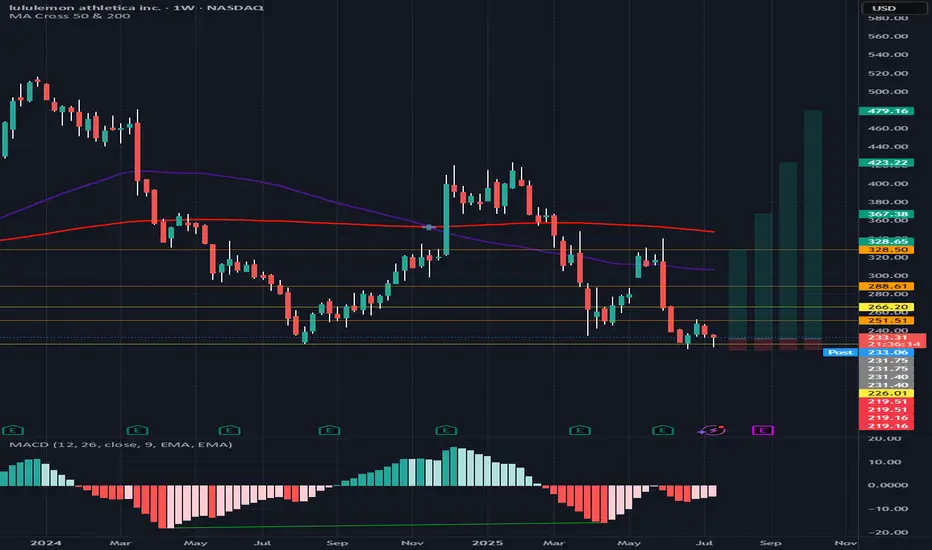
LULU bullyou see it, we all see it. triple bottom with class A divergence and clear TP and SL, good luck!
Next report date
—
Report period
—
EPS estimate
—
Revenue estimate
—
12.96 EUR
1.75 B EUR
10.22 B EUR
104.43 M
About lululemon athletica
Sector
Industry
CEO
Calvin R. McDonald
Website
Headquarters
Vancouver
Founded
1998
FIGI
BBG000RTY6N0
lululemon athletica, Inc. engages in the business of designing, distributing, and retailing technical athletic apparel, footwear, and accessories. It operates through the following segments: Company-Operated Stores, Direct to Consumer, and Other. The company was founded by Dennis James Wilson in 1998 and is headquartered in Vancouver, Canada.
Related stocks
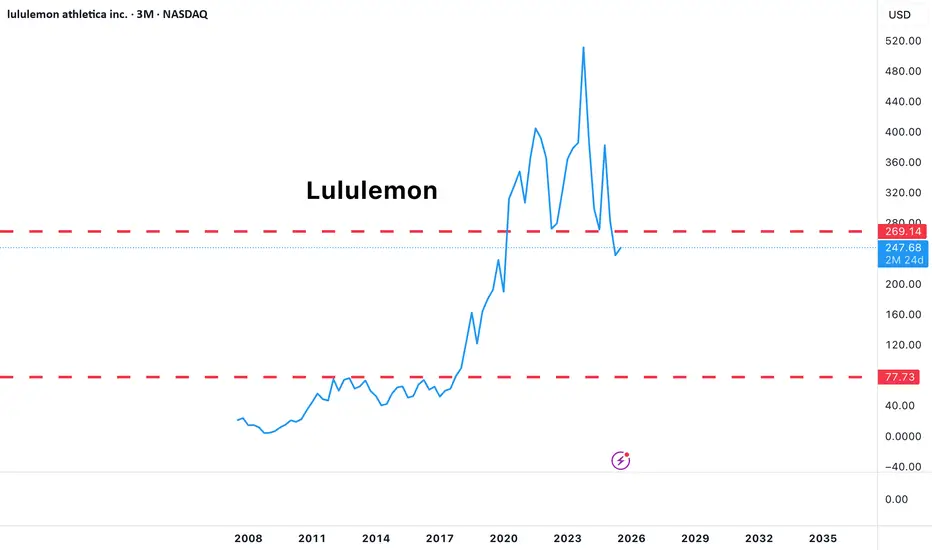
Higher end consumption has officially broken downThe charts of Lululemon, Louis Vuitton, Restoration Hardware & Target are showing significant signs of weakness as all of them have broken important 3M closing support lows. Regardless of what you hear, these charts show that the high end consumer has been slowing consumption for quite some time and
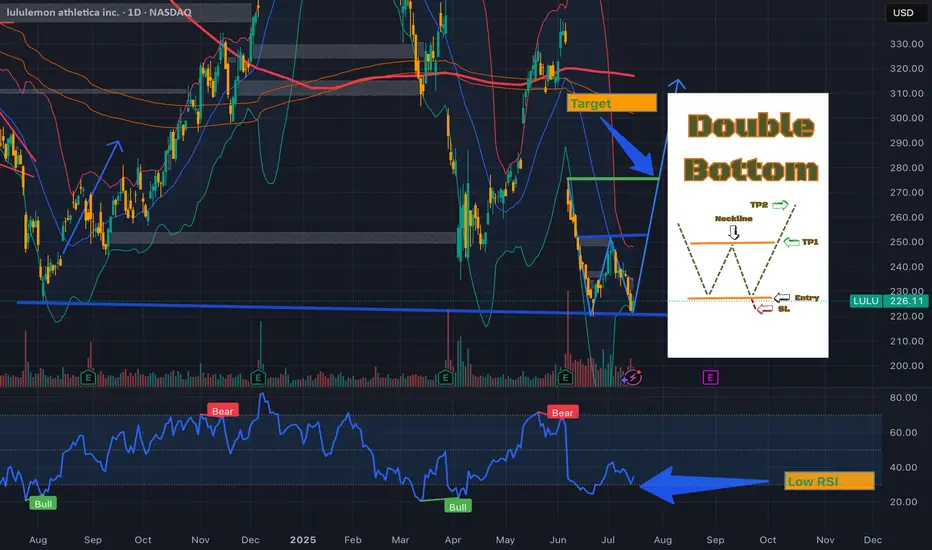
LULU – Double Bottom + RSI Divergence: Multi-Target Setup After LULU NASDAQ:LULU is showing signs of a potential bullish reversal after forming a double bottom structure around the $220 support zone , along with a bullish divergence on the RSI indicator.
Two vertical lines highlight the divergence: while price made a lower low, RSI formed a higher lo
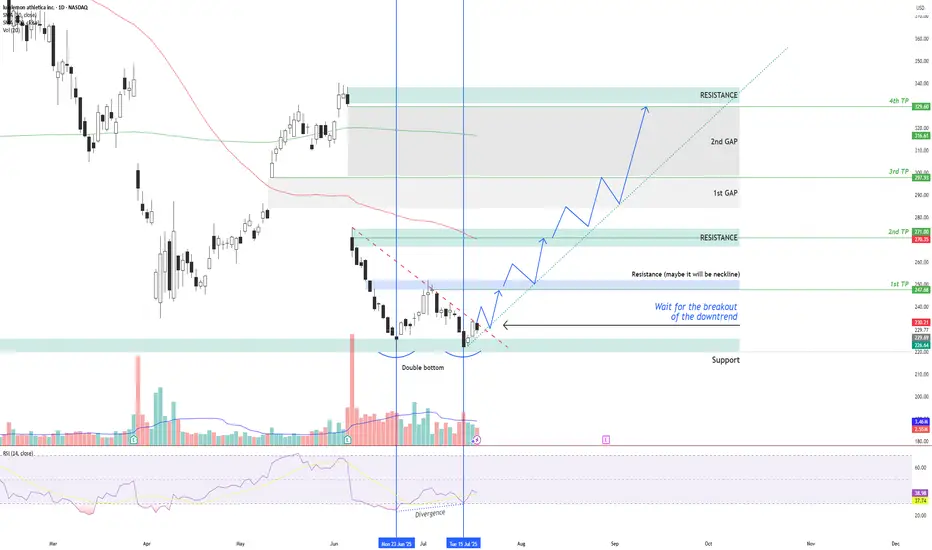
Double Bottom Pattern on LULU“LULU is forming a potential Double Bottom on the daily chart, with two lows around $222 (support) and a neckline at $252. The pattern suggests a bullish reversal if the price breaks above $252 with strong volume. RSI is showing bullish divergence, and the 50-day MA is converging near the neckline,
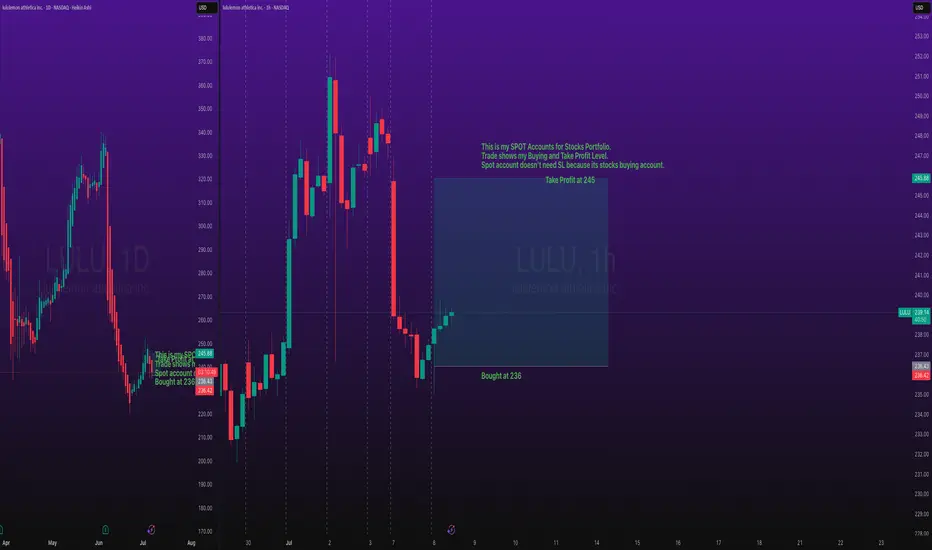
Stocks SPOT ACCOUNT: LULU stocks my buy trade with take profitStocks SPOT ACCOUNT: NASDAQ:LULU stocks my buy trade with take profit.
Bought at 236 and take profit at 245.
This is my SPOT Accounts for Stocks Portfolio.
Trade shows my Buying and Take Profit Level.
Spot account doesn't need SL because its stocks buying account.
LULU LongMarket Structure Analysis
Break of Structure (BOS): A clean BOS was confirmed following a strong bullish impulse off the low at $219. This suggests a transition from a bearish trend into potential accumulation.
Higher Lows and Re-accumulation: After the BOS, price is forming a clear series of highe
Looking for a leap on LULU. OptionsMastery:
🔉Sound on!🔉
📣Make sure to watch fullscreen!📣
Thank you as always for watching my videos. I hope that you learned something very educational! Please feel free to like, share, and comment on this post. Remember only risk what you are willing to lose. Trading is very risky but it can c

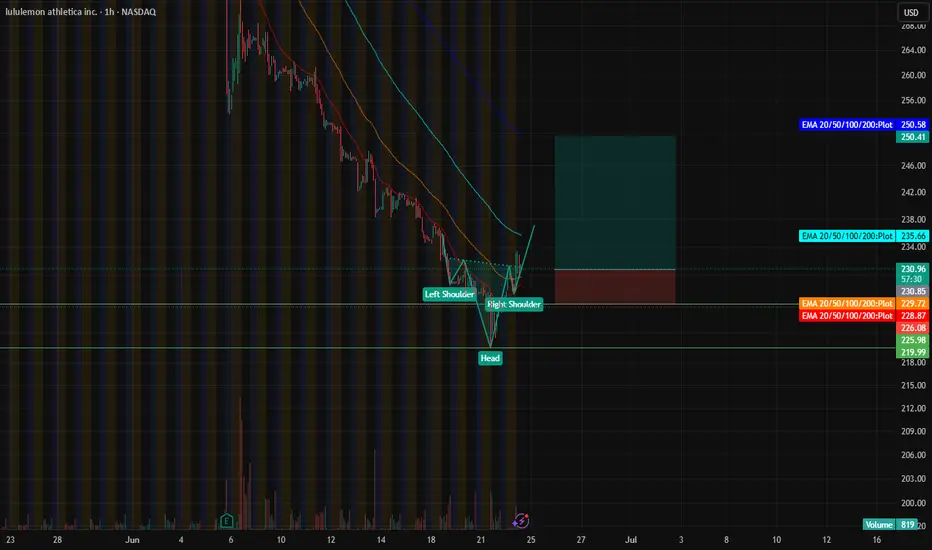
Lulu Long15-Minute Chart: Head and Shoulders Pattern
A head and shoulders pattern has formed on the 15-minute chart, signaling a potential reversal from a short-term downtrend, suggesting bullish momentum may be building.
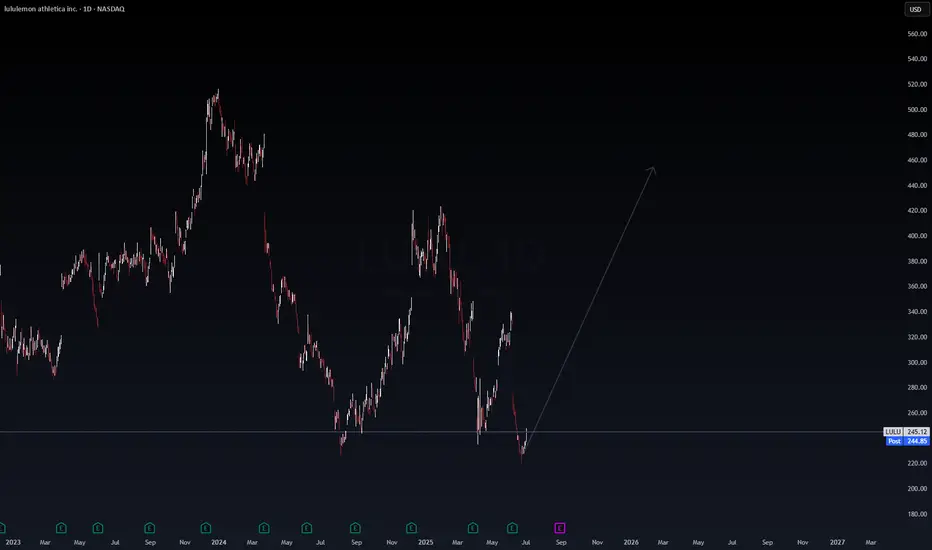
Daily Chart: Hammer Candlestick & RSI Oversold
The daily chart shows a hammer candle
LULU – Compression Complete? Reversal in Progress | WaverVanir PTicker: NASDAQ:LULU
Timeframe: 1D (Daily)
Posted by: WaverVanir International LLC | VolanX DSS Framework
🧠 Technical Thesis:
LULU is showing signs of a potential macro reversal after a sharp capitulation and retest of key demand (~$235–240). The double-bottom formation and absorption at prior sup
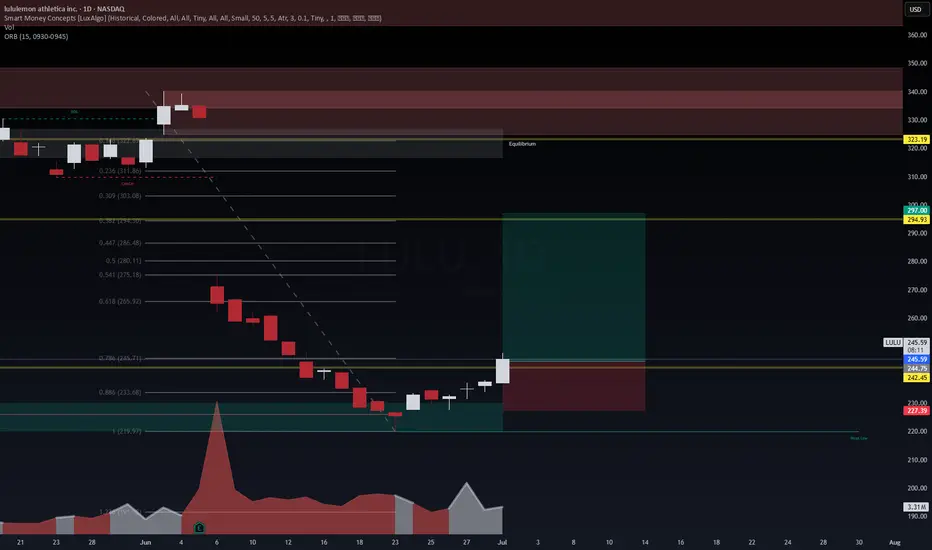
LULU Daily | Smart Money + Fibonacci Reversal Setup📢
📆 July 1, 2025 | ⏱ 1D Chart
🔹 SMC + Volume + FVG Confluence
🔹 Powered by WaverVanir DSS Protocol
📍 Context:
LULU printed a strong bullish engulfing off the 0.786–0.886 Fibonacci retracement zone, following a BOS and liquidity sweep at $233.
Volume surged near the bottom — potential institutional
See all ideas
Summarizing what the indicators are suggesting.
Neutral
SellBuy
Strong sellStrong buy
Strong sellSellNeutralBuyStrong buy
Neutral
SellBuy
Strong sellStrong buy
Strong sellSellNeutralBuyStrong buy
Neutral
SellBuy
Strong sellStrong buy
Strong sellSellNeutralBuyStrong buy
An aggregate view of professional's ratings.
Neutral
SellBuy
Strong sellStrong buy
Strong sellSellNeutralBuyStrong buy
Neutral
SellBuy
Strong sellStrong buy
Strong sellSellNeutralBuyStrong buy
Neutral
SellBuy
Strong sellStrong buy
Strong sellSellNeutralBuyStrong buy
Displays a symbol's price movements over previous years to identify recurring trends.
Curated watchlists where 33L is featured.

Frequently Asked Questions
The current price of 33L is 200.56 EUR — it has increased by 2.51% in the past 24 hours. Watch LULULEMON ATHLETICA INC. stock price performance more closely on the chart.
Depending on the exchange, the stock ticker may vary. For instance, on FWB exchange LULULEMON ATHLETICA INC. stocks are traded under the ticker 33L.
33L stock has fallen by −1.16% compared to the previous week, the month change is a −2.08% fall, over the last year LULULEMON ATHLETICA INC. has showed a −25.13% decrease.
We've gathered analysts' opinions on LULULEMON ATHLETICA INC. future price: according to them, 33L price has a max estimate of 428.70 EUR and a min estimate of 132.90 EUR. Watch 33L chart and read a more detailed LULULEMON ATHLETICA INC. stock forecast: see what analysts think of LULULEMON ATHLETICA INC. and suggest that you do with its stocks.
33L stock is 2.45% volatile and has beta coefficient of 1.04. Track LULULEMON ATHLETICA INC. stock price on the chart and check out the list of the most volatile stocks — is LULULEMON ATHLETICA INC. there?
Today LULULEMON ATHLETICA INC. has the market capitalization of 23.75 B, it has decreased by −0.58% over the last week.
Yes, you can track LULULEMON ATHLETICA INC. financials in yearly and quarterly reports right on TradingView.
LULULEMON ATHLETICA INC. is going to release the next earnings report on Aug 28, 2025. Keep track of upcoming events with our Earnings Calendar.
33L earnings for the last quarter are 2.30 EUR per share, whereas the estimation was 2.28 EUR resulting in a 0.60% surprise. The estimated earnings for the next quarter are 2.49 EUR per share. See more details about LULULEMON ATHLETICA INC. earnings.
LULULEMON ATHLETICA INC. revenue for the last quarter amounts to 2.09 B EUR, despite the estimated figure of 2.08 B EUR. In the next quarter, revenue is expected to reach 2.19 B EUR.
33L net income for the last quarter is 277.77 M EUR, while the quarter before that showed 722.56 M EUR of net income which accounts for −61.56% change. Track more LULULEMON ATHLETICA INC. financial stats to get the full picture.
No, 33L doesn't pay any dividends to its shareholders. But don't worry, we've prepared a list of high-dividend stocks for you.
As of Jul 19, 2025, the company has 39 K employees. See our rating of the largest employees — is LULULEMON ATHLETICA INC. on this list?
EBITDA measures a company's operating performance, its growth signifies an improvement in the efficiency of a company. LULULEMON ATHLETICA INC. EBITDA is 2.66 B EUR, and current EBITDA margin is 27.83%. See more stats in LULULEMON ATHLETICA INC. financial statements.
Like other stocks, 33L shares are traded on stock exchanges, e.g. Nasdaq, Nyse, Euronext, and the easiest way to buy them is through an online stock broker. To do this, you need to open an account and follow a broker's procedures, then start trading. You can trade LULULEMON ATHLETICA INC. stock right from TradingView charts — choose your broker and connect to your account.
Investing in stocks requires a comprehensive research: you should carefully study all the available data, e.g. company's financials, related news, and its technical analysis. So LULULEMON ATHLETICA INC. technincal analysis shows the sell today, and its 1 week rating is sell. Since market conditions are prone to changes, it's worth looking a bit further into the future — according to the 1 month rating LULULEMON ATHLETICA INC. stock shows the sell signal. See more of LULULEMON ATHLETICA INC. technicals for a more comprehensive analysis.
If you're still not sure, try looking for inspiration in our curated watchlists.
If you're still not sure, try looking for inspiration in our curated watchlists.