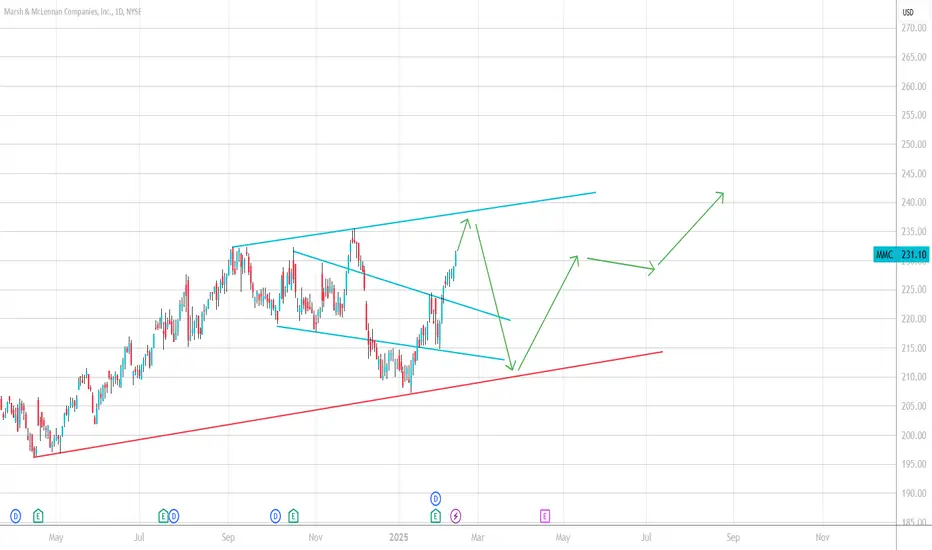
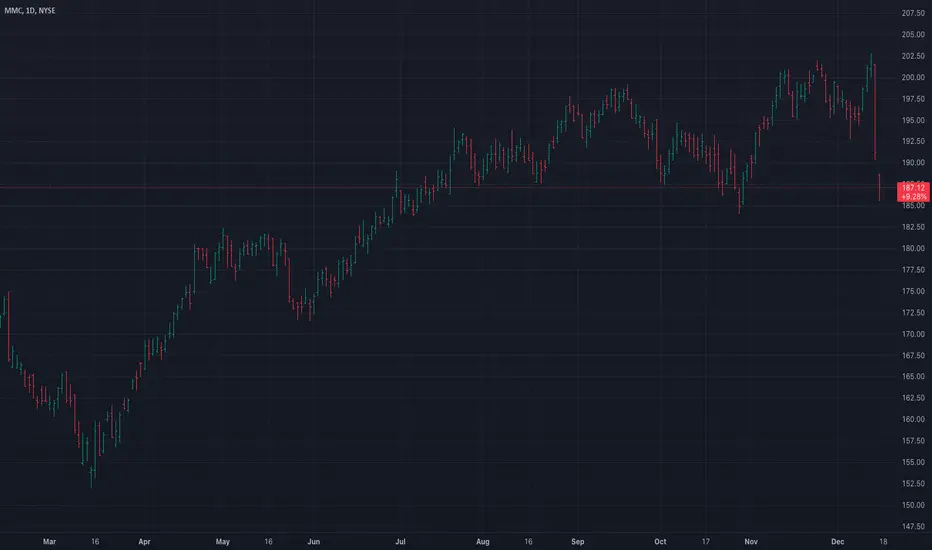
MMC Too late for now?This is my view how this may play out the next weeks.
no good entry idea coming to my head now. let's see. let's discuss, i d be happy to chat with you guys or read your comments.
cheers!
Next report date
—
Report period
—
EPS estimate
—
Revenue estimate
—
7.10 EUR
3.92 B EUR
23.58 B EUR
491.56 M
About Marsh & McLennan Companies, Inc.
Sector
Industry
CEO
John Q. Doyle
Website
Headquarters
New York
Founded
1871
FIGI
BBG000G7G9Z1
Marsh & McLennan Cos., Inc. is a professional services firm, which engages in offering clients advice and solutions in risk, strategy, and people. It operates through the Risk and Insurance Services, and Consulting segments. The Risk and Insurance Services segment is involved in risk management activities, as well as insurance and reinsurance broking and services. The Consulting segment offers health, wealth, and career solutions and products, and specialized management, strategic, economic, and brand consulting services. The company was founded by Henry W. Marsh and Donald R. McLennan in 1871 and is headquartered in New York, NY.
Related stocks
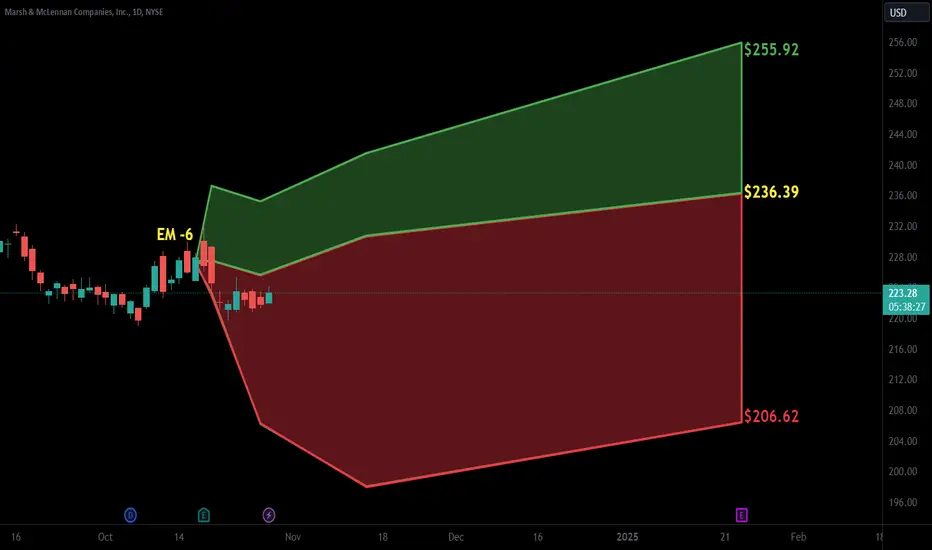
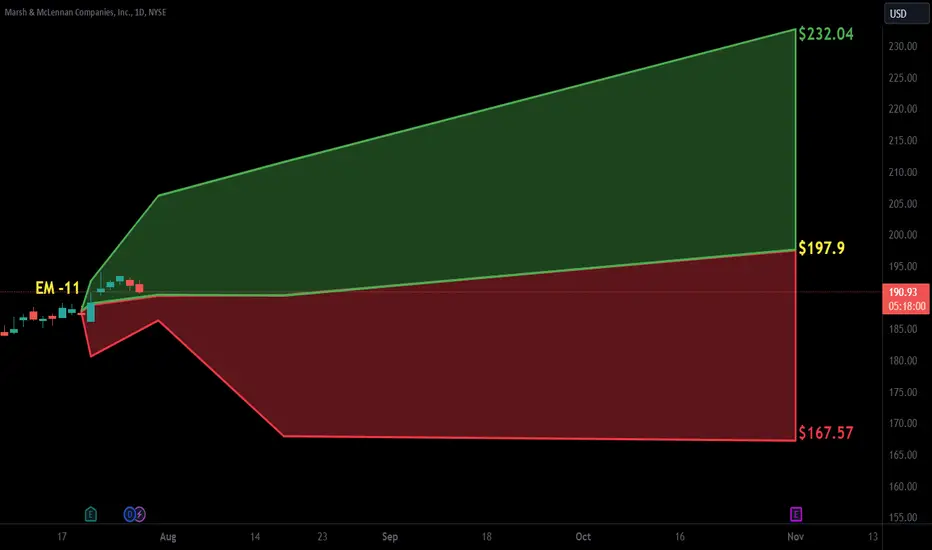
$MMC with a bullish outlook following its earnings #StocksThe PEAD projected a bullish outlook for NYSE:MMC after a positive over reaction following its earnings release placing the stock in drift B with an expected accuracy of 60%.
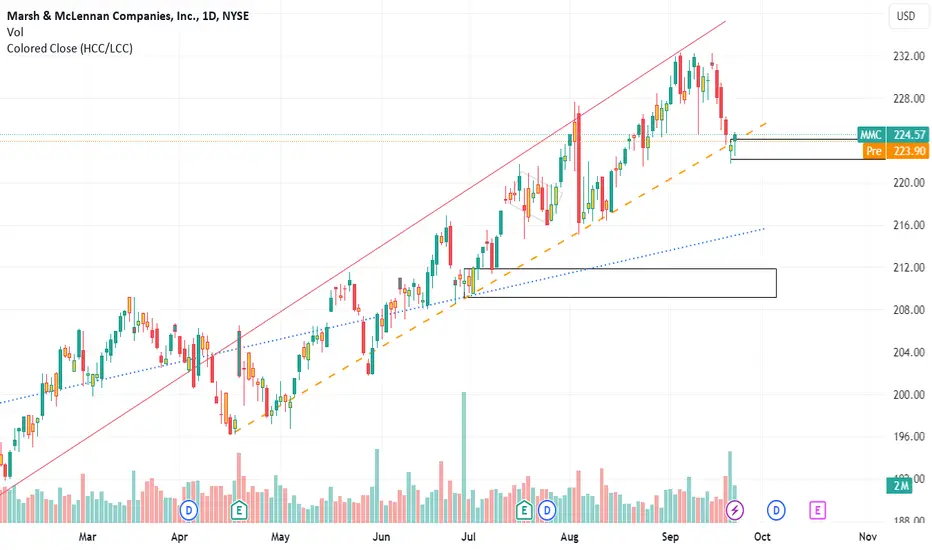
Watching the support to the channel for continuation sidewayMoving back up after consolidation is possible as the framework, pivot point, and oversold levels are ready to regain momentum. Very conservative as it is still high and still inside the channel.
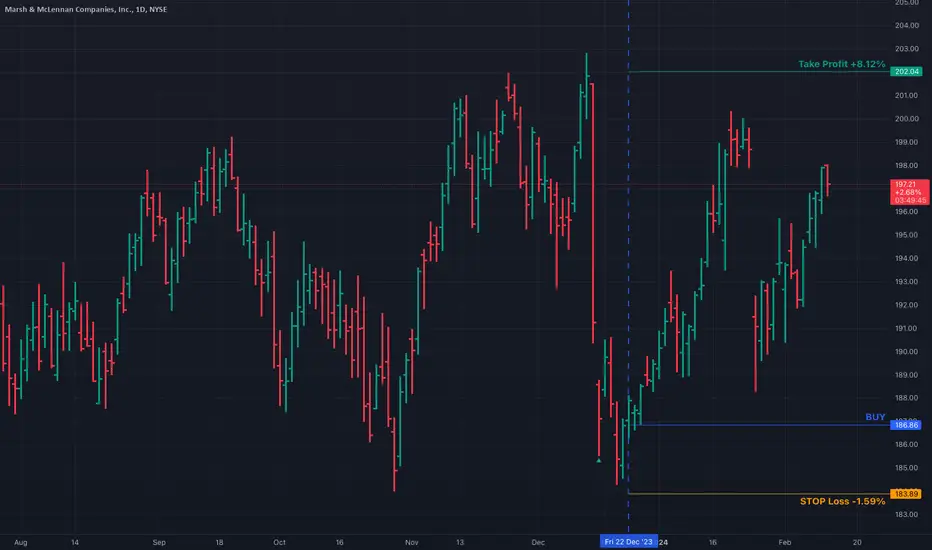
UpdatE: MMC, bought, Take Profit +8.12%, STOP Loss -1.59% NYSE:MMC
UpdatE: MMC, bought, Take Profit +8.12%, STOP Loss -1.59%
$MMC with a bullish outlook following its earnings #StocksThe PEAD projected a bullish outlook for NYSE:MMC after a negative over reaction following its earnings release placing the stock in drift C with an expected accuracy of 60%.
Marsh & McLennan Companies (MMC) Weekly Chart AnalysisCompany: Marsh & McLennan Companies
Ticker: MMC
Exchange: NYSE
Sector: Financial Services
Introduction:
Hello and thank you for taking the time to read my post. Today, we analyze the Marsh & McLennan Companies (MMC) chart on the weekly scale, focusing on a classic price pattern called the "Rect

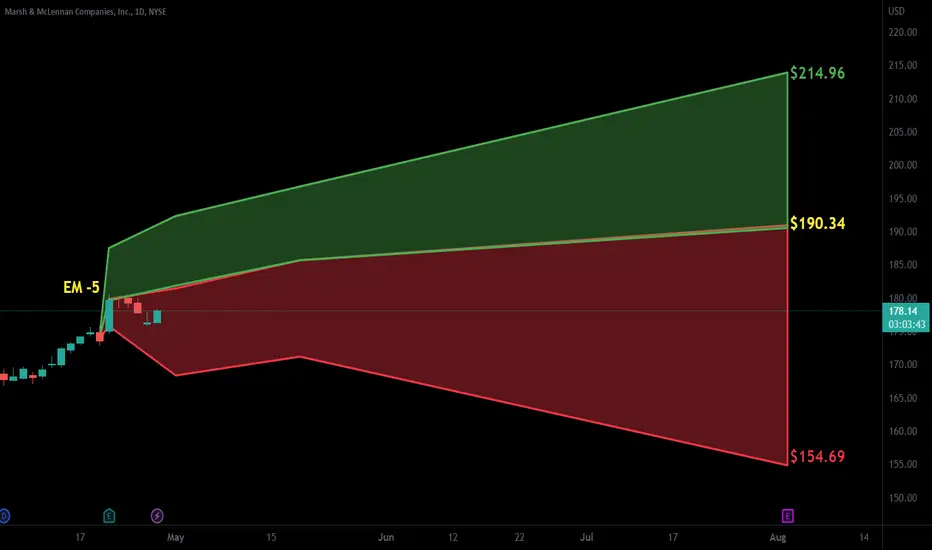
$MMC with a bullish outlook following its earnings #StocksThe PEAD projected a bullish outlook for NYSE:MMC after a positive under reaction following its earnings release placing the stock in drift A with an expected accuracy of 63.64%.
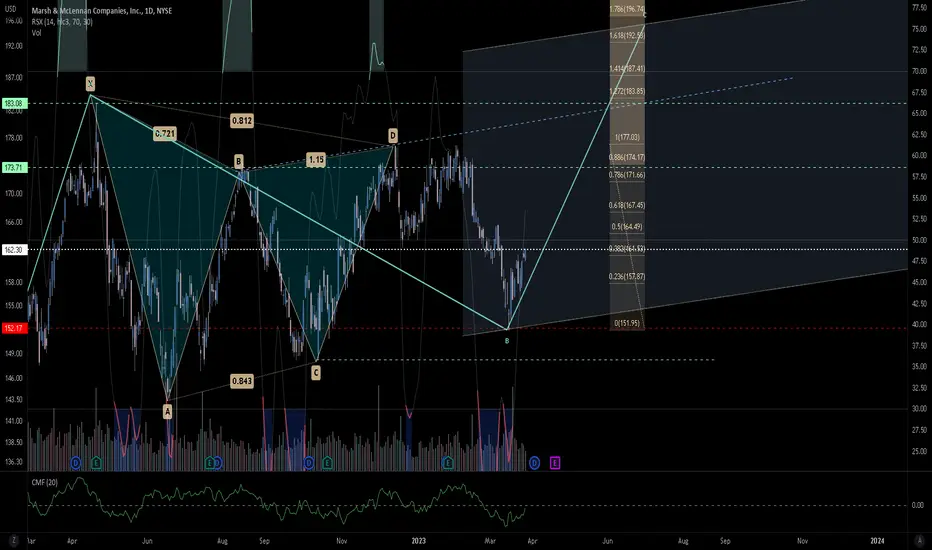
Bouncing up on Marsh&McLennan. MMCWithin a channel, looking like ABCDE according to Elliot. Volume flow toward longs, and I bet P/C Ratio is bullish also.
I never shared an idea on this one for a while, but you can see a Gartley painted in there and the result.
We are not in the business of getting every prediction right, no one
$MMC with a Bearish outlook following its earnings #Stocks The PEAD projected a Bearish outlook for $MMC after a Negative under reaction following its earnings release placing the stock in drift D with an expected accuracy of 66.67%.

See all ideas
Summarizing what the indicators are suggesting.
Neutral
SellBuy
Strong sellStrong buy
Strong sellSellNeutralBuyStrong buy
Neutral
SellBuy
Strong sellStrong buy
Strong sellSellNeutralBuyStrong buy
Neutral
SellBuy
Strong sellStrong buy
Strong sellSellNeutralBuyStrong buy
An aggregate view of professional's ratings.
Neutral
SellBuy
Strong sellStrong buy
Strong sellSellNeutralBuyStrong buy
Neutral
SellBuy
Strong sellStrong buy
Strong sellSellNeutralBuyStrong buy
Neutral
SellBuy
Strong sellStrong buy
Strong sellSellNeutralBuyStrong buy
Displays a symbol's price movements over previous years to identify recurring trends.
MMC5314900
Marsh & McLennan Companies, Inc. 2.9% 15-DEC-2051Yield to maturity
7.14%
Maturity date
Dec 15, 2051
MMC4606282
Marsh & McLennan Companies, Inc. 4.2% 01-MAR-2048Yield to maturity
6.32%
Maturity date
Mar 1, 2048
MMC4443339
Marsh & McLennan Companies, Inc. 4.35% 30-JAN-2047Yield to maturity
6.26%
Maturity date
Jan 30, 2047
MMC4786492
Marsh & McLennan Companies, Inc. 4.9% 15-MAR-2049Yield to maturity
6.12%
Maturity date
Mar 15, 2049
MMC5754704
Marsh & McLennan Companies, Inc. 5.45% 15-MAR-2054Yield to maturity
5.99%
Maturity date
Mar 15, 2054
MMC5930471
Marsh & McLennan Companies, Inc. 5.4% 15-MAR-2055Yield to maturity
5.98%
Maturity date
Mar 15, 2055
MMC5552133
Marsh & McLennan Companies, Inc. 5.45% 15-MAR-2053Yield to maturity
5.94%
Maturity date
Mar 15, 2053
MMC5647797
Marsh & McLennan Companies, Inc. 5.7% 15-SEP-2053Yield to maturity
5.88%
Maturity date
Sep 15, 2053
MMC5930470
Marsh & McLennan Companies, Inc. 5.35% 15-NOV-2044Yield to maturity
5.83%
Maturity date
Nov 15, 2044
MMC5494060
Marsh & McLennan Companies, Inc. 6.25% 01-NOV-2052Yield to maturity
5.74%
Maturity date
Nov 1, 2052
MMC4786489
Marsh & McLennan Companies, Inc. 4.75% 15-MAR-2039Yield to maturity
5.35%
Maturity date
Mar 15, 2039
See all MSN bonds
Curated watchlists where MSN is featured.

Frequently Asked Questions
The current price of MSN is 182.00 EUR — it has decreased by −0.66% in the past 24 hours. Watch MARSH+MCLENNAN COS.INC.D1 stock price performance more closely on the chart.
Depending on the exchange, the stock ticker may vary. For instance, on FWB exchange MARSH+MCLENNAN COS.INC.D1 stocks are traded under the ticker MSN.
MSN stock has fallen by −0.08% compared to the previous week, the month change is a −2.57% fall, over the last year MARSH+MCLENNAN COS.INC.D1 has showed a −9.27% decrease.
We've gathered analysts' opinions on MARSH+MCLENNAN COS.INC.D1 future price: according to them, MSN price has a max estimate of 226.80 EUR and a min estimate of 182.82 EUR. Watch MSN chart and read a more detailed MARSH+MCLENNAN COS.INC.D1 stock forecast: see what analysts think of MARSH+MCLENNAN COS.INC.D1 and suggest that you do with its stocks.
MSN stock is 1.24% volatile and has beta coefficient of 0.37. Track MARSH+MCLENNAN COS.INC.D1 stock price on the chart and check out the list of the most volatile stocks — is MARSH+MCLENNAN COS.INC.D1 there?
Today MARSH+MCLENNAN COS.INC.D1 has the market capitalization of 90.06 B, it has increased by 0.45% over the last week.
Yes, you can track MARSH+MCLENNAN COS.INC.D1 financials in yearly and quarterly reports right on TradingView.
MARSH+MCLENNAN COS.INC.D1 is going to release the next earnings report on Oct 16, 2025. Keep track of upcoming events with our Earnings Calendar.
MSN earnings for the last quarter are 2.31 EUR per share, whereas the estimation was 2.26 EUR resulting in a 2.04% surprise. The estimated earnings for the next quarter are 1.56 EUR per share. See more details about MARSH+MCLENNAN COS.INC.D1 earnings.
MARSH+MCLENNAN COS.INC.D1 revenue for the last quarter amounts to 5.92 B EUR, despite the estimated figure of 5.89 B EUR. In the next quarter, revenue is expected to reach 5.48 B EUR.
MSN net income for the last quarter is 1.03 B EUR, while the quarter before that showed 1.28 B EUR of net income which accounts for −19.47% change. Track more MARSH+MCLENNAN COS.INC.D1 financial stats to get the full picture.
Yes, MSN dividends are paid quarterly. The last dividend per share was 0.74 EUR. As of today, Dividend Yield (TTM)% is 1.54%. Tracking MARSH+MCLENNAN COS.INC.D1 dividends might help you take more informed decisions.
MARSH+MCLENNAN COS.INC.D1 dividend yield was 1.49% in 2024, and payout ratio reached 38.54%. The year before the numbers were 1.44% and 36.14% correspondingly. See high-dividend stocks and find more opportunities for your portfolio.
As of Jul 20, 2025, the company has 90 K employees. See our rating of the largest employees — is MARSH+MCLENNAN COS.INC.D1 on this list?
EBITDA measures a company's operating performance, its growth signifies an improvement in the efficiency of a company. MARSH+MCLENNAN COS.INC.D1 EBITDA is 6.32 B EUR, and current EBITDA margin is 28.15%. See more stats in MARSH+MCLENNAN COS.INC.D1 financial statements.
Like other stocks, MSN shares are traded on stock exchanges, e.g. Nasdaq, Nyse, Euronext, and the easiest way to buy them is through an online stock broker. To do this, you need to open an account and follow a broker's procedures, then start trading. You can trade MARSH+MCLENNAN COS.INC.D1 stock right from TradingView charts — choose your broker and connect to your account.
Investing in stocks requires a comprehensive research: you should carefully study all the available data, e.g. company's financials, related news, and its technical analysis. So MARSH+MCLENNAN COS.INC.D1 technincal analysis shows the sell today, and its 1 week rating is sell. Since market conditions are prone to changes, it's worth looking a bit further into the future — according to the 1 month rating MARSH+MCLENNAN COS.INC.D1 stock shows the neutral signal. See more of MARSH+MCLENNAN COS.INC.D1 technicals for a more comprehensive analysis.
If you're still not sure, try looking for inspiration in our curated watchlists.
If you're still not sure, try looking for inspiration in our curated watchlists.