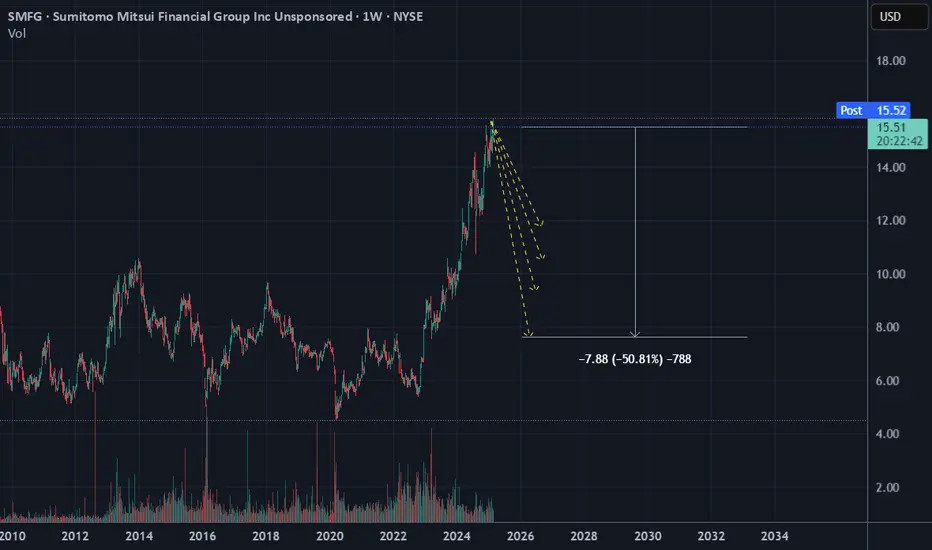
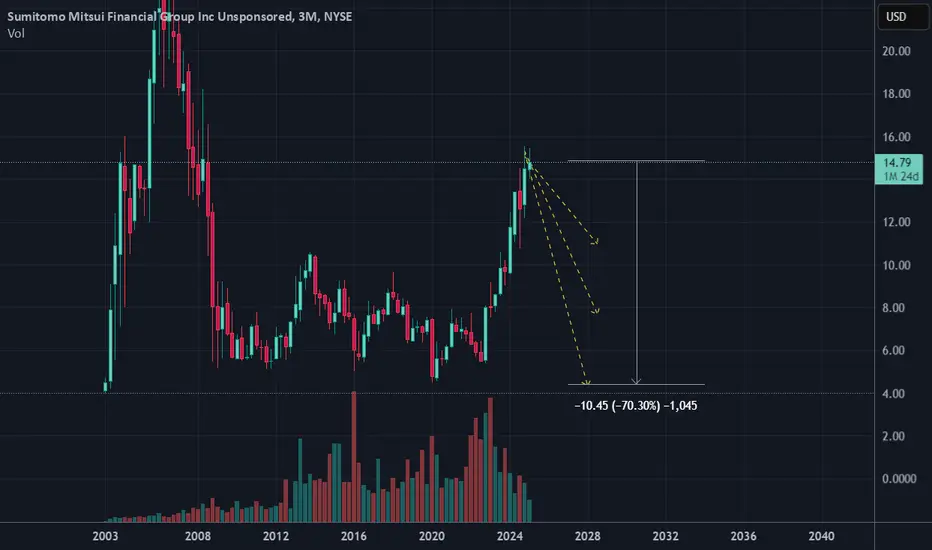
$SMFGNYSE:SMFG slightly rise as NIKKEI 225 crashes.
Expecting it to dip soon as we see Japanese stocks to dip 60%.
Next report date
—
Report period
—
EPS estimate
—
Revenue estimate
—
1.855 EUR
7.26 B EUR
61.17 B EUR
3.68 B
About SUMITOMO MITSUI FINANCIAL GROUP INC
Sector
Industry
CEO
Toru Nakashima
Website
Headquarters
Tokyo
Founded
2002
ISIN
JP3890350006
FIGI
BBG000BG6978
Sumitomo Mitsui Financial Group, Inc. operates as a holding company, which engages in the management of its subsidiaries that provide financial services. It operates through the following segments: Wholesale, Retail, Global, Market and Head Office Management. The Wholesale Business segment dealings with domestic large corporations and small and medium-sized enterprises. The Retail Business segment dealings with domestic individual customers. The Global Business segment dealings with overseas Japanese and non-Japanese companies. The Market Business segment operations related to financial markets. The Head Office Management segment that does not belong to any of the above business divisions. The company was founded on December 2, 2002 and is headquartered in Tokyo, Japan.
Related stocks
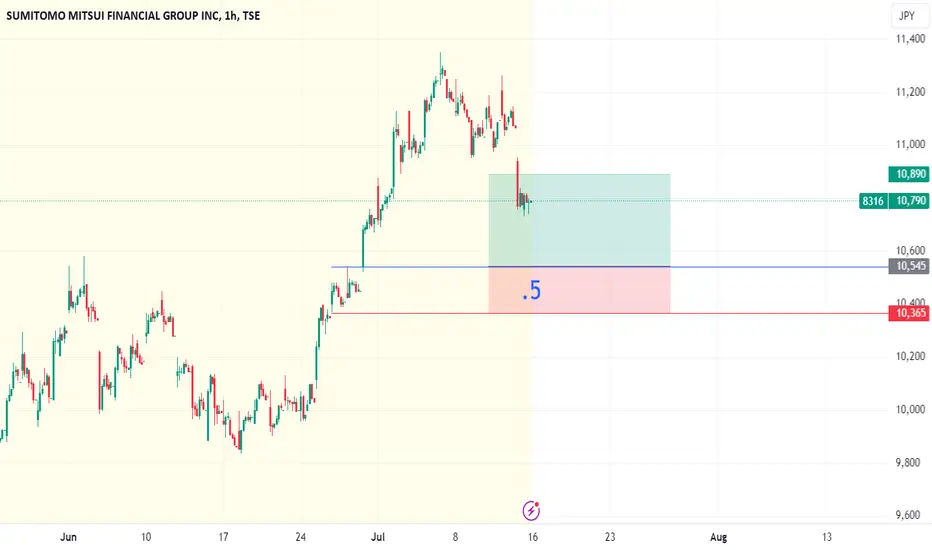
8316 on TSEThe market is on uptrend so the predominant decisions should be buying. This level is not really good but because of the trend I will risk half as I normally would do. Should manage it once it moved for more than 1:1
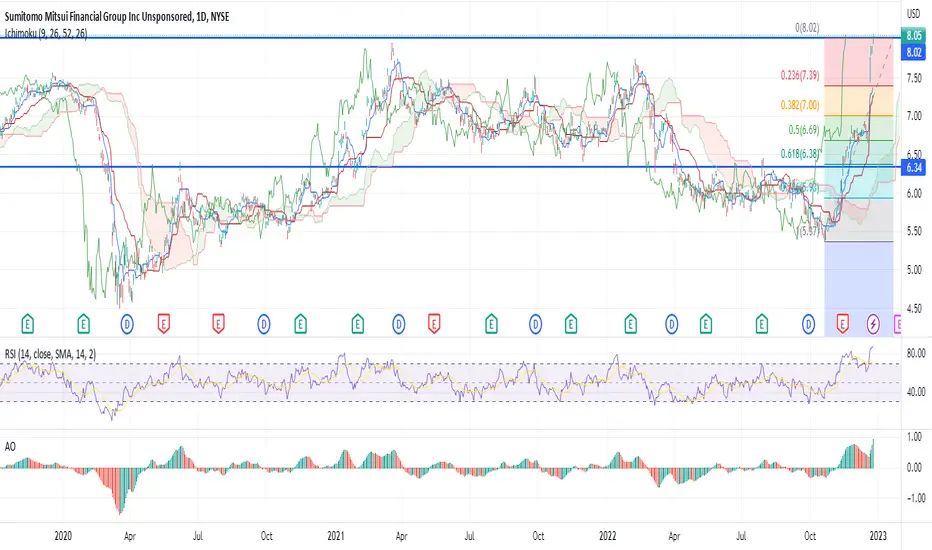
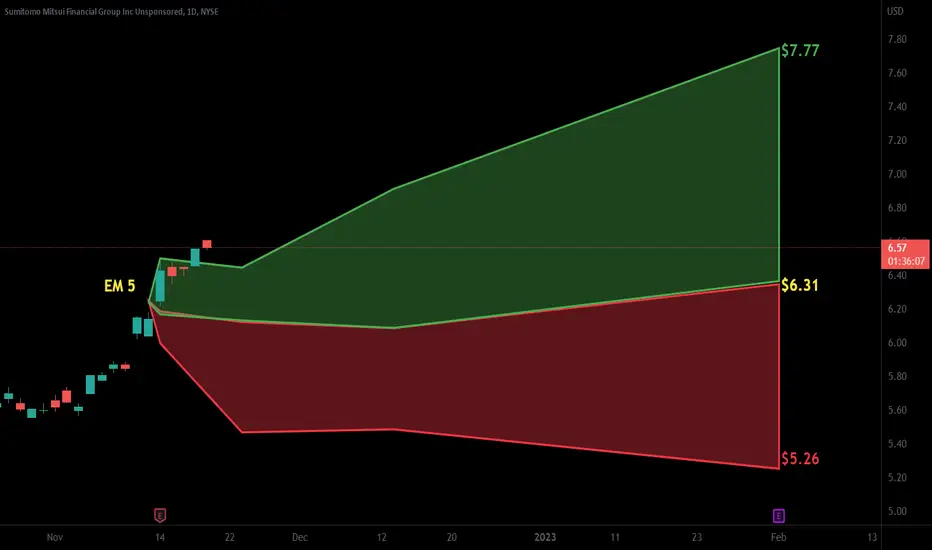
SMFG SELL+++++SMFG is way overbought, gap to fill, many stretched indicators here, RSI, AO, Stochastic RSI, bollinger bands, new moon phase began, strong resistance. We should correct under $7.40 then ultimately under $7.00 in coming days
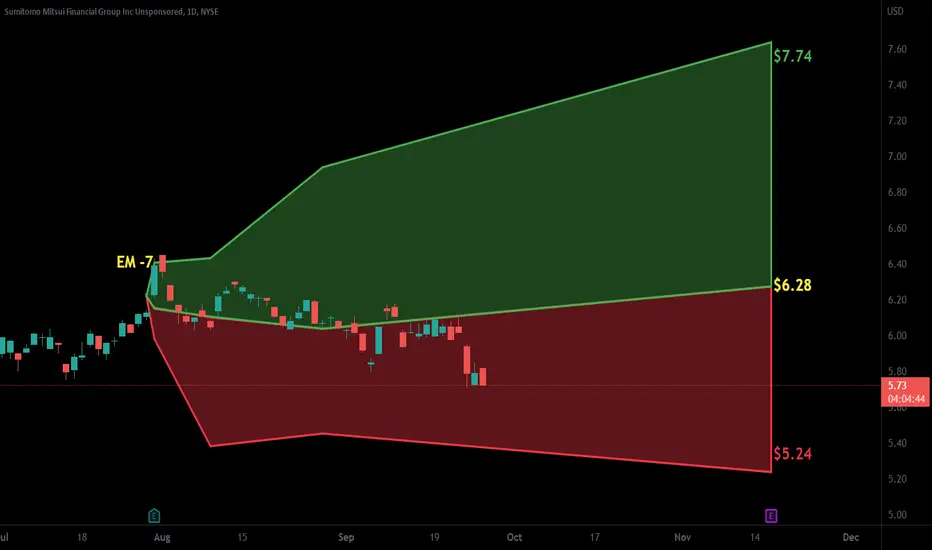
$SMFG with a Neutral outlook following its earnings #Stocks The PEAD projected a Neutral outlook for $SMFG after a Positive over reaction following its earnings release placing the stock in drift B with an expected accuracy of 90%.
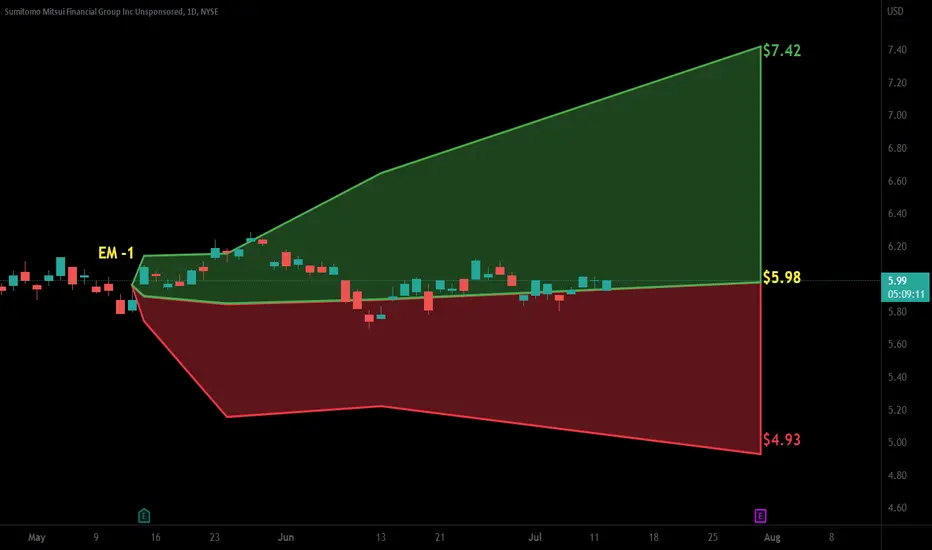
$SMFG with a Neutral outlook following its earnings #Stocks The PEAD projected a Neutral outlook for $SMFG after a Positive over reaction following its earnings release placing the stock in drift B with an expected accuracy of 88.89%.
$SMFG with a Neutral outlook following its earnings #Stocks The PEAD projected a Neutral outlook for $SMFG after a Positive over reaction following its earnings release placing the stock in drift B with an expected accuracy of 87.5%.
Stocks Stocks Stocks...Hey wolves, get ready!
Sumitomo Mitsui Financial Group Inc's price, with ticker 8316, is making symmetrical triangle on 1hr timeframe.
There was a strong bullish sentiment before. Will it be trend continuation?
According to Elliott Waves theory the price made Wave D and now is heading to Wave E.
F

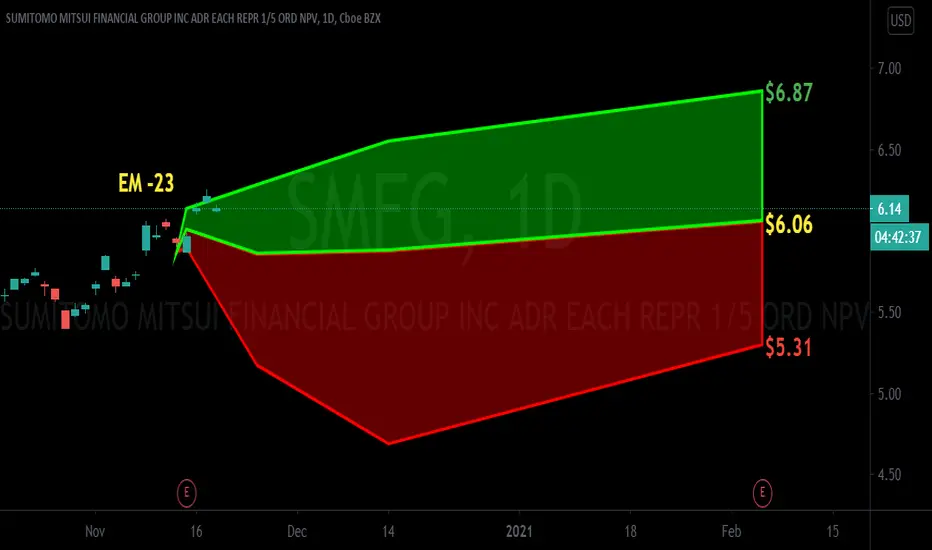
$SMFG with a neutral projection following earning release$SMFG posted its earnings with a positive under reaction following its release with the PEAD projecting a neutral outlook placing the stock in Drift A
If you would like to see the Drift for another stock please message us. Also click on the Like Button if this was useful and follow us or join us.
bottom fishing with good dividend payoutA 50B+ major Japanese banking firm - coming off a major multi year base with > 25% upside in 2020. Risks can be substantially mitigated by due the high dividend payout offered by the company.
Risks can be further reduced by doing the following:
1. hedging with put options strike 5 with at least 90 D

See all ideas
Summarizing what the indicators are suggesting.
Neutral
SellBuy
Strong sellStrong buy
Strong sellSellNeutralBuyStrong buy
Neutral
SellBuy
Strong sellStrong buy
Strong sellSellNeutralBuyStrong buy
Neutral
SellBuy
Strong sellStrong buy
Strong sellSellNeutralBuyStrong buy
An aggregate view of professional's ratings.
Neutral
SellBuy
Strong sellStrong buy
Strong sellSellNeutralBuyStrong buy
Neutral
SellBuy
Strong sellStrong buy
Strong sellSellNeutralBuyStrong buy
Neutral
SellBuy
Strong sellStrong buy
Strong sellSellNeutralBuyStrong buy
Displays a symbol's price movements over previous years to identify recurring trends.
SMFG5258303
Sumitomo Mitsui Financial Group, Inc. 2.93% 17-SEP-2041Yield to maturity
6.71%
Maturity date
Sep 17, 2041
SMFG5106454
Sumitomo Mitsui Financial Group, Inc. 2.296% 12-JAN-2041Yield to maturity
6.65%
Maturity date
Jan 12, 2041
SMFG5335219
Sumitomo Mitsui Financial Group, Inc. 3.05% 14-JAN-2042Yield to maturity
6.19%
Maturity date
Jan 14, 2042
SMFG6114344
Sumitomo Mitsui Financial Group, Inc. 5.796% 08-JUL-2046Yield to maturity
6.04%
Maturity date
Jul 8, 2046
SMFG5844791
Sumitomo Mitsui Financial Group, Inc. 5.836% 09-JUL-2044Yield to maturity
5.88%
Maturity date
Jul 9, 2044
SMFG5614661
Sumitomo Mitsui Financial Group, Inc. 6.184% 13-JUL-2043Yield to maturity
5.61%
Maturity date
Jul 13, 2043
SMFG6114326
Sumitomo Mitsui Financial Group, Inc. FRN 08-JUL-2031Yield to maturity
5.50%
Maturity date
Jul 8, 2031
SMFG6114329
Sumitomo Mitsui Financial Group, Inc. 5.246% 08-JUL-2036Yield to maturity
5.38%
Maturity date
Jul 8, 2036
SMFG5976265
Sumitomo Mitsui Financial Group, Inc. FRN 15-APR-2030Yield to maturity
5.26%
Maturity date
Apr 15, 2030
SMFG5844787
Sumitomo Mitsui Financial Group, Inc. FRN 09-JUL-2029Yield to maturity
5.19%
Maturity date
Jul 9, 2029
SMFG5976268
Sumitomo Mitsui Financial Group, Inc. 5.632% 15-JAN-2035Yield to maturity
5.17%
Maturity date
Jan 15, 2035
See all XMF bonds
Curated watchlists where XMF is featured.

Japanese banking stocks
72 No. of Symbols
See all sparks
Frequently Asked Questions
The current price of XMF is 20.565 EUR — it has decreased by −0.34% in the past 24 hours. Watch SUMITOMO MITSUI FINL GRP stock price performance more closely on the chart.
Depending on the exchange, the stock ticker may vary. For instance, on FWB exchange SUMITOMO MITSUI FINL GRP stocks are traded under the ticker XMF.
XMF stock has fallen by −1.91% compared to the previous week, the month change is a −3.34% fall, over the last year SUMITOMO MITSUI FINL GRP has showed a −2.16% decrease.
We've gathered analysts' opinions on SUMITOMO MITSUI FINL GRP future price: according to them, XMF price has a max estimate of 32.55 EUR and a min estimate of 20.05 EUR. Watch XMF chart and read a more detailed SUMITOMO MITSUI FINL GRP stock forecast: see what analysts think of SUMITOMO MITSUI FINL GRP and suggest that you do with its stocks.
XMF stock is 0.34% volatile and has beta coefficient of 1.36. Track SUMITOMO MITSUI FINL GRP stock price on the chart and check out the list of the most volatile stocks — is SUMITOMO MITSUI FINL GRP there?
Today SUMITOMO MITSUI FINL GRP has the market capitalization of 80.87 B, it has decreased by −1.13% over the last week.
Yes, you can track SUMITOMO MITSUI FINL GRP financials in yearly and quarterly reports right on TradingView.
SUMITOMO MITSUI FINL GRP is going to release the next earnings report on Jul 31, 2025. Keep track of upcoming events with our Earnings Calendar.
XMF earnings for the last quarter are 0.07 EUR per share, whereas the estimation was 0.22 EUR resulting in a −67.13% surprise. The estimated earnings for the next quarter are 0.50 EUR per share. See more details about SUMITOMO MITSUI FINL GRP earnings.
SUMITOMO MITSUI FINL GRP revenue for the last quarter amounts to 15.54 B EUR, despite the estimated figure of 5.30 B EUR. In the next quarter, revenue is expected to reach 6.44 B EUR.
XMF net income for the last quarter is 258.94 M EUR, while the quarter before that showed 2.52 B EUR of net income which accounts for −89.74% change. Track more SUMITOMO MITSUI FINL GRP financial stats to get the full picture.
SUMITOMO MITSUI FINL GRP dividend yield was 3.21% in 2024, and payout ratio reached 40.46%. The year before the numbers were 3.03% and 37.26% correspondingly. See high-dividend stocks and find more opportunities for your portfolio.
As of Jul 19, 2025, the company has 122.98 K employees. See our rating of the largest employees — is SUMITOMO MITSUI FINL GRP on this list?
Like other stocks, XMF shares are traded on stock exchanges, e.g. Nasdaq, Nyse, Euronext, and the easiest way to buy them is through an online stock broker. To do this, you need to open an account and follow a broker's procedures, then start trading. You can trade SUMITOMO MITSUI FINL GRP stock right from TradingView charts — choose your broker and connect to your account.
Investing in stocks requires a comprehensive research: you should carefully study all the available data, e.g. company's financials, related news, and its technical analysis. So SUMITOMO MITSUI FINL GRP technincal analysis shows the strong sell today, and its 1 week rating is sell. Since market conditions are prone to changes, it's worth looking a bit further into the future — according to the 1 month rating SUMITOMO MITSUI FINL GRP stock shows the buy signal. See more of SUMITOMO MITSUI FINL GRP technicals for a more comprehensive analysis.
If you're still not sure, try looking for inspiration in our curated watchlists.
If you're still not sure, try looking for inspiration in our curated watchlists.