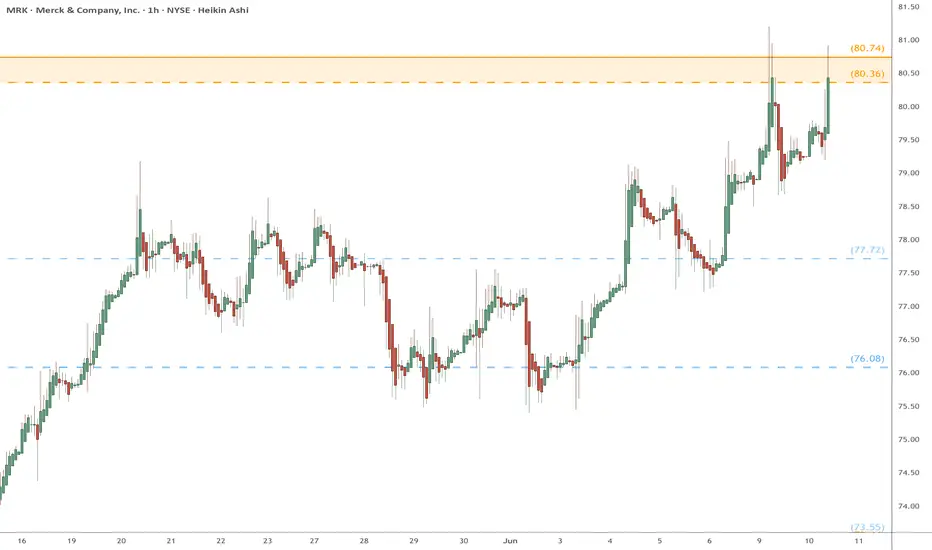
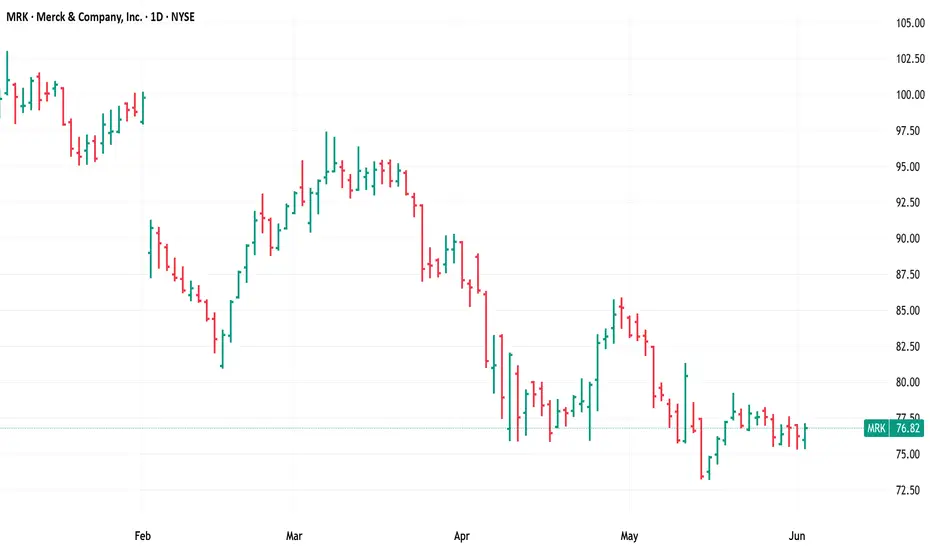
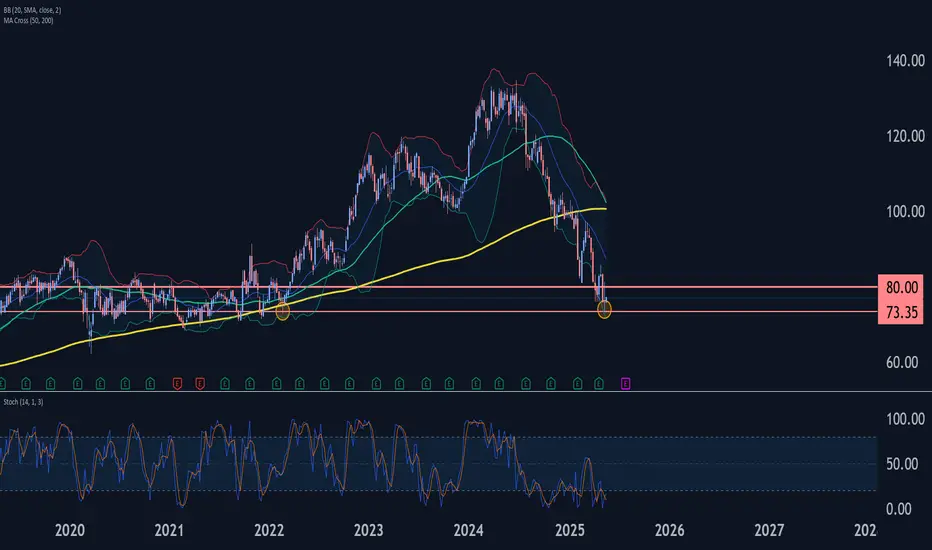
MRK eyes on $80.36/74: Double Golden zone break to end DownTrendMRK and all pharma has been dropping forever.
Just pierced the Double Golden zone yet again.
Break and Hold of this zone will say "bottom".
.
Next report date
—
Report period
—
EPS estimate
—
Revenue estimate
—
6.37 EUR
16.53 B EUR
61.80 B EUR
2.51 B
About Merck & Company, Inc.
Sector
Industry
CEO
Robert M. Davis
Website
Headquarters
Rahway
Founded
1891
FIGI
BBG000G584P6
Merck & Co., Inc. is a health care company, which engages in the provision of health solutions through its prescription medicines, vaccines, biologic therapies, animal health, and consumer care products. It operates through the following segments: Pharmaceutical, Animal Health, and Other. The Pharmaceutical segment includes human health pharmaceutical and vaccine products. The Animal Health segment discovers, develops, manufactures, and markets animal health products, such as pharmaceutical and vaccine products, for the prevention, treatment and control of disease in livestock, and companion animal species. The Other segment consists of sales for the non-reportable segments of healthcare services. The company was founded in 1891 and is headquartered in Rahway, NJ.
Related stocks
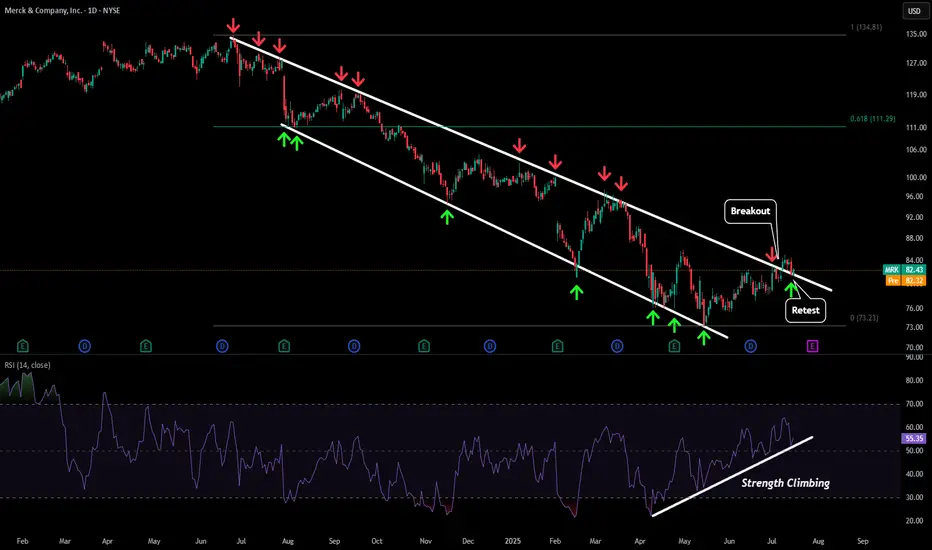
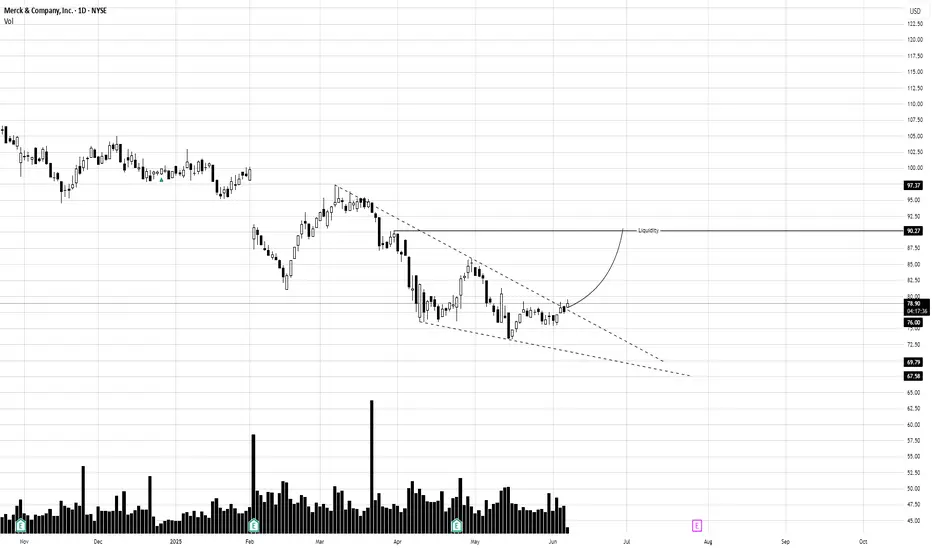
MRK - Retesting BreakoutAfter being in a downtrend for almost a year things finally look like they are starting to turn around for MRK.
Recently price broke the downwards sloping resistance and has retested that level as a new support level. We have also seen strength increasing on our daily RSI bringing some life back i
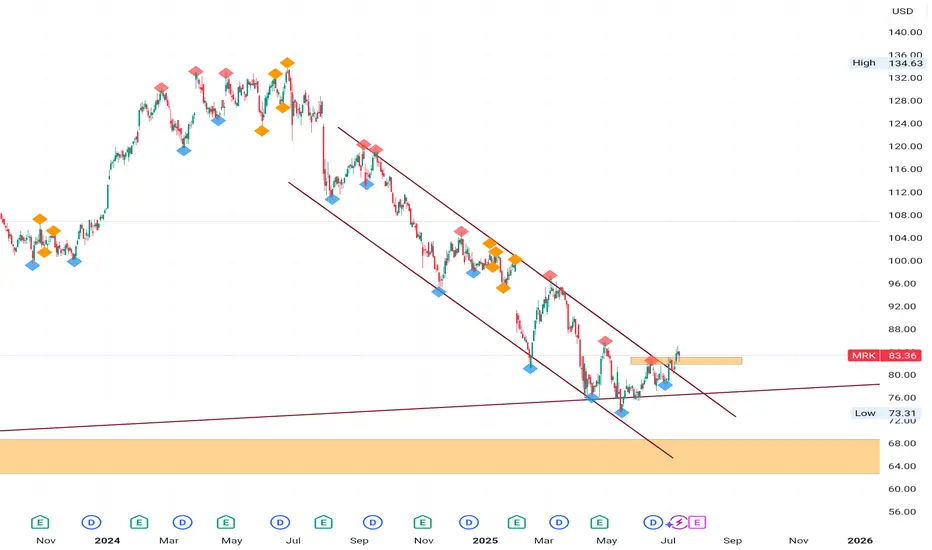
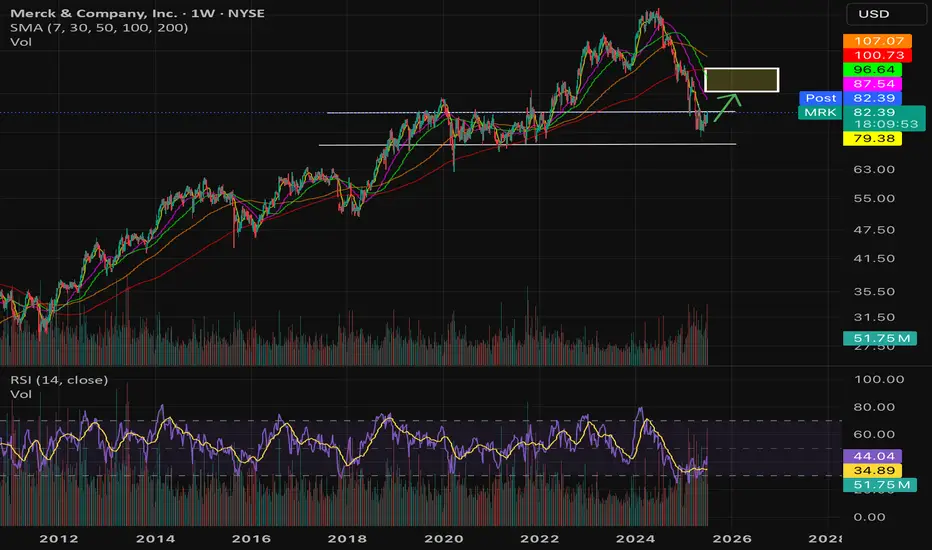
MRK Buying Opportunity!MRK is currently undervalued. The stock price dropped approximately 45% from June 25th of last year to May 15th of this year. At present, the price has bounced off a long-term weekly trendline that has been respected since 2009, indicating a strong rejection zone.
Additionally, on the daily timefra
MRK Wave Analysis – 14 July 2025- MRK reversed from the support zone
- Likely to rise to resistance level 85.00
MRK recently reversed up from the support zone surrounding the long-term support level 73.45 (which has been reversing the price from the start of 2020, as can be seen from the weekly MRK chart below).
The upward rever

Long $MRK- NYSE:MRK is a quality compounder selling at a discount.
Year | 2025 | 2026 | 2027 | 2028
EPS | 8.90 | 9.72 | 10.65 | 10.38
EPS% | 18.36% | 9.21% | 9.54% | -2.52%
Conservative forward p/e should be 10
Fair Stock value:
EPS | 8.90 | 9.72 | 10.65 | 10.38
Price | 89 | 97 | 106 | 103
Positive
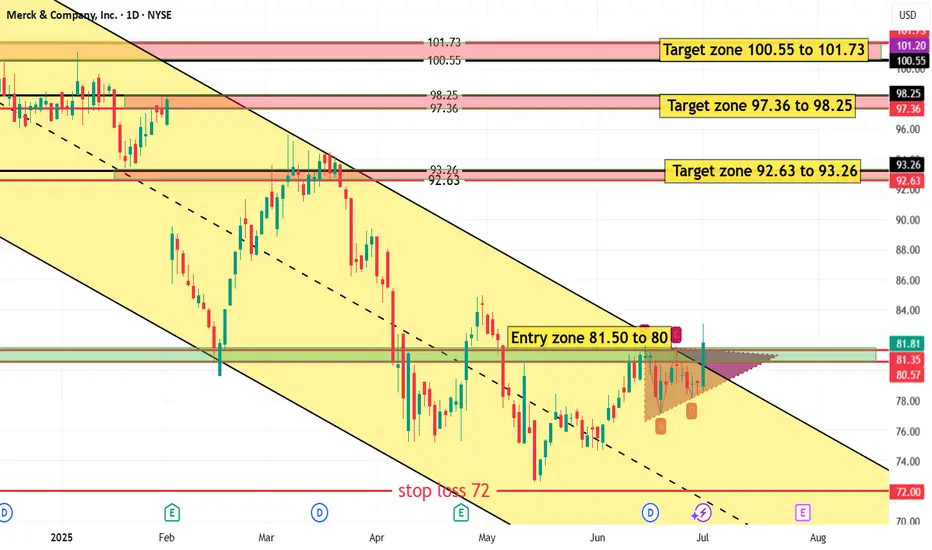
MRKEntry Zone: $81.50 to $80.00 (Potential accumulation area for buyers).
Key levels within this zone: $81.51, $81.53, $80.57.
Immediate Resistance: $83.07 (today’s high).
Higher Targets:
$92.63 - $93.26 (First target zone).
$97.36 - $98.25 (Second target zone).
$100.55 - $101.73 (Major resistanc
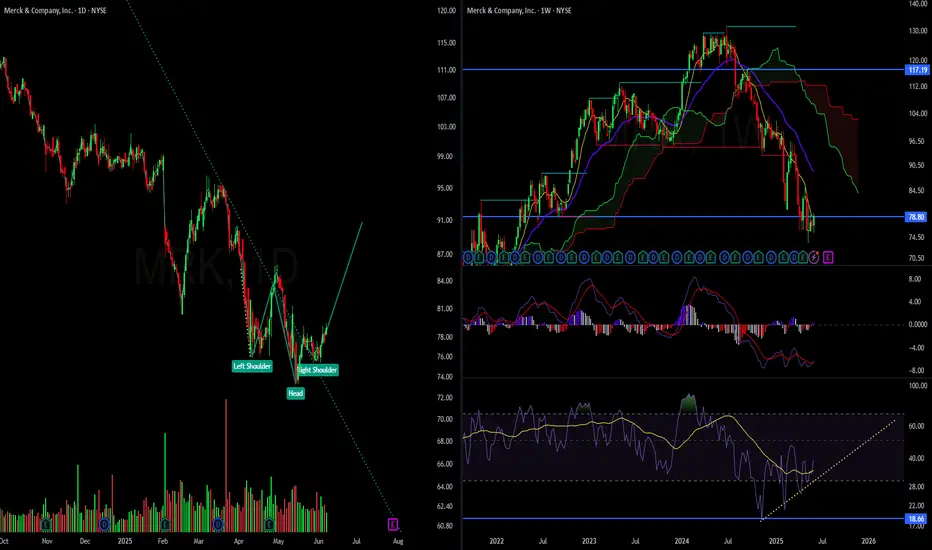
AAA - Setup from the bottomInverse head and shoulders pattern on the daily timeframe and if you were to break it down further to 12hr it should be also clear.
Monthly rsi sharply bounced back below an RSI of 30, weekly rsi has been below 30 rsi for multile touches
rsi line and rsi moving average crossover indicating change i
$MRK, Long, TP>15-25%NYSE:MRK , Long, TP>15-25%
Fundamentally the stock is good.
Choose an entry point and do not forget about a protective order if you are trading with leverage.
Don't risk it if you're not sure.
Good luck to everyone.
Merck Wave Analysis – 19 May 2025
- Merck reversed from support area
- Likely to rise to resistance level 80.00
Merck recently reversed up from the support area between the long-term support level 73.35 (which has been reversing the price from the middle of 2020) and the lower weekly Bollinger Band.
The upward reversal from this
See all ideas
Summarizing what the indicators are suggesting.
Neutral
SellBuy
Strong sellStrong buy
Strong sellSellNeutralBuyStrong buy
Neutral
SellBuy
Strong sellStrong buy
Strong sellSellNeutralBuyStrong buy
Neutral
SellBuy
Strong sellStrong buy
Strong sellSellNeutralBuyStrong buy
An aggregate view of professional's ratings.
Neutral
SellBuy
Strong sellStrong buy
Strong sellSellNeutralBuyStrong buy
Neutral
SellBuy
Strong sellStrong buy
Strong sellSellNeutralBuyStrong buy
Neutral
SellBuy
Strong sellStrong buy
Strong sellSellNeutralBuyStrong buy
Displays a symbol's price movements over previous years to identify recurring trends.
MRK5002693
Merck & Co., Inc. 2.45% 24-JUN-2050Yield to maturity
7.35%
Maturity date
Jun 24, 2050
MRK5319197
Merck & Co., Inc. 2.9% 10-DEC-2061Yield to maturity
7.24%
Maturity date
Dec 10, 2061
US58933YBF1
MERCK & CO. 21/51Yield to maturity
7.15%
Maturity date
Dec 10, 2051
US58933YBA2
MERCK & CO. 20/40Yield to maturity
6.49%
Maturity date
Jun 24, 2040
US58933YAT2
MERCK CO. 2045Yield to maturity
6.37%
Maturity date
Feb 10, 2045
MRK4806294
Merck & Co., Inc. 4.0% 07-MAR-2049Yield to maturity
6.33%
Maturity date
Mar 7, 2049
MRK3900816
Merck & Co., Inc. 3.6% 15-SEP-2042Yield to maturity
6.24%
Maturity date
Sep 15, 2042
US58933YAJ4
MERCK CO. 13/43Yield to maturity
6.09%
Maturity date
May 18, 2043
MRK5584756
Merck & Co., Inc. 5.15% 17-MAY-2063Yield to maturity
6.04%
Maturity date
May 17, 2063
MRK5584755
Merck & Co., Inc. 5.0% 17-MAY-2053Yield to maturity
5.95%
Maturity date
May 17, 2053
MRK5584925
Merck & Co., Inc. 4.9% 17-MAY-2044Yield to maturity
5.82%
Maturity date
May 17, 2044
See all 6MK bonds
Curated watchlists where 6MK is featured.


Frequently Asked Questions
The current price of 6MK is 68.70 EUR — it has decreased by −2.14% in the past 24 hours. Watch MERCK & CO INC stock price performance more closely on the chart.
Depending on the exchange, the stock ticker may vary. For instance, on GETTEX exchange MERCK & CO INC stocks are traded under the ticker 6MK.
6MK stock has fallen by −4.58% compared to the previous week, the month change is a 1.03% rise, over the last year MERCK & CO INC has showed a −40.57% decrease.
We've gathered analysts' opinions on MERCK & CO INC future price: according to them, 6MK price has a max estimate of 120.64 EUR and a min estimate of 70.16 EUR. Watch 6MK chart and read a more detailed MERCK & CO INC stock forecast: see what analysts think of MERCK & CO INC and suggest that you do with its stocks.
6MK stock is 2.62% volatile and has beta coefficient of 0.39. Track MERCK & CO INC stock price on the chart and check out the list of the most volatile stocks — is MERCK & CO INC there?
Today MERCK & CO INC has the market capitalization of 173.14 B, it has decreased by −1.44% over the last week.
Yes, you can track MERCK & CO INC financials in yearly and quarterly reports right on TradingView.
MERCK & CO INC is going to release the next earnings report on Jul 29, 2025. Keep track of upcoming events with our Earnings Calendar.
6MK earnings for the last quarter are 2.05 EUR per share, whereas the estimation was 1.97 EUR resulting in a 4.10% surprise. The estimated earnings for the next quarter are 1.71 EUR per share. See more details about MERCK & CO INC earnings.
MERCK & CO INC revenue for the last quarter amounts to 14.35 B EUR, despite the estimated figure of 14.18 B EUR. In the next quarter, revenue is expected to reach 13.47 B EUR.
6MK net income for the last quarter is 4.69 B EUR, while the quarter before that showed 3.62 B EUR of net income which accounts for 29.84% change. Track more MERCK & CO INC financial stats to get the full picture.
Yes, 6MK dividends are paid quarterly. The last dividend per share was 0.70 EUR. As of today, Dividend Yield (TTM)% is 4.00%. Tracking MERCK & CO INC dividends might help you take more informed decisions.
MERCK & CO INC dividend yield was 3.14% in 2024, and payout ratio reached 46.32%. The year before the numbers were 2.72% and 2.07 K% correspondingly. See high-dividend stocks and find more opportunities for your portfolio.
As of Jul 19, 2025, the company has 75 K employees. See our rating of the largest employees — is MERCK & CO INC on this list?
EBITDA measures a company's operating performance, its growth signifies an improvement in the efficiency of a company. MERCK & CO INC EBITDA is 24.67 B EUR, and current EBITDA margin is 39.30%. See more stats in MERCK & CO INC financial statements.
Like other stocks, 6MK shares are traded on stock exchanges, e.g. Nasdaq, Nyse, Euronext, and the easiest way to buy them is through an online stock broker. To do this, you need to open an account and follow a broker's procedures, then start trading. You can trade MERCK & CO INC stock right from TradingView charts — choose your broker and connect to your account.
Investing in stocks requires a comprehensive research: you should carefully study all the available data, e.g. company's financials, related news, and its technical analysis. So MERCK & CO INC technincal analysis shows the strong sell today, and its 1 week rating is sell. Since market conditions are prone to changes, it's worth looking a bit further into the future — according to the 1 month rating MERCK & CO INC stock shows the sell signal. See more of MERCK & CO INC technicals for a more comprehensive analysis.
If you're still not sure, try looking for inspiration in our curated watchlists.
If you're still not sure, try looking for inspiration in our curated watchlists.