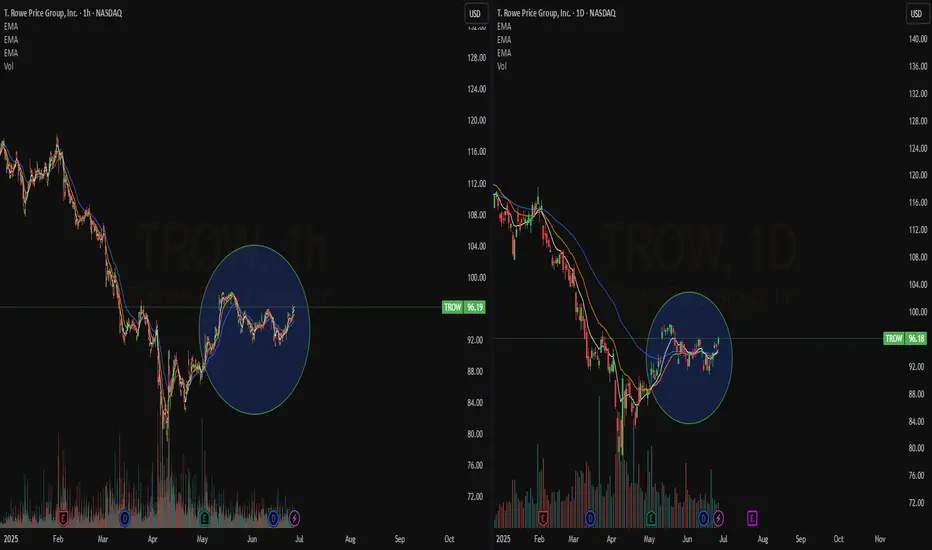
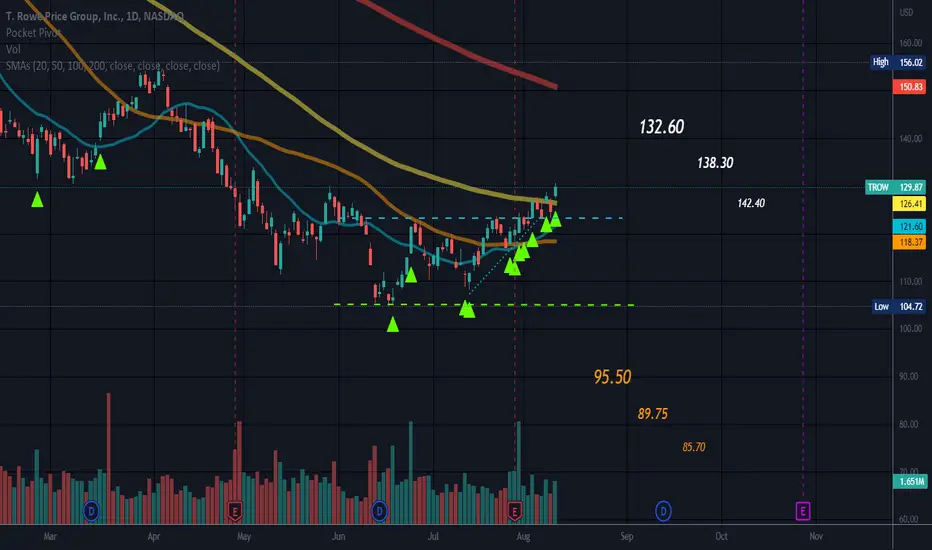
Quick View: $TROW- The daily chart sees a bullish crossover with a consolidation area. A Break above with a new relative high will lead the price higher
Next report date
—
Report period
—
EPS estimate
—
Revenue estimate
—
8.16 EUR
1.97 B EUR
6.85 B EUR
216.30 M
About T. Rowe Price Group, Inc.
Sector
Industry
CEO
Robert Wade Sharps
Website
Headquarters
Baltimore
Founded
1937
FIGI
BBG000GCR915
T. Rowe Price Group, Inc. engages in the provision of investment management services. It provides its services to individuals, institutional investors, retirement plans, financial intermediaries, and institutions. The firm invests in the public equity and fixed income markets across the globe. The company was founded by Thomas Rowe Price Jr. in 1937 and is headquartered in Baltimore, MD.
Related stocks
TROW overreaction selloff: time to buyI believe that NASDAQ:TROW screams oversold, as real estate is by far not he most affected sector from tariffs and potential trade wars, which can even not happen at all. Current price levels look like a good entry.
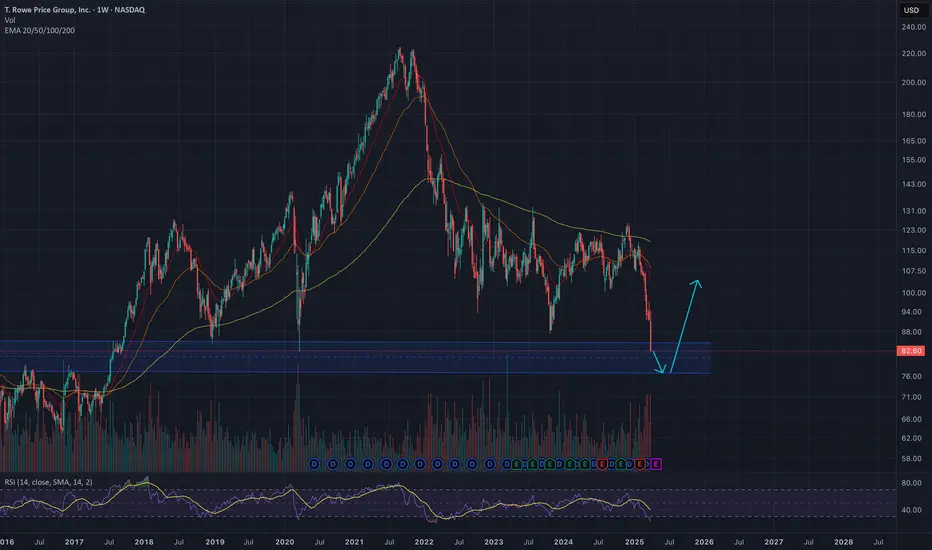
Short-term we can see further downside.
Mid-term return to $100-$105.
Long
T. Rowe Price Analysis 9/10Disclosure: As of 09/10/2024 I am long T. Rowe Price shares ticker NASDAQ:TROW
T. Rowe Price is an investment management company operating in the mutual funds, retirement plans, and investment management business areas.
Management Effectiveness: T. Rowe Price has been around for many years an
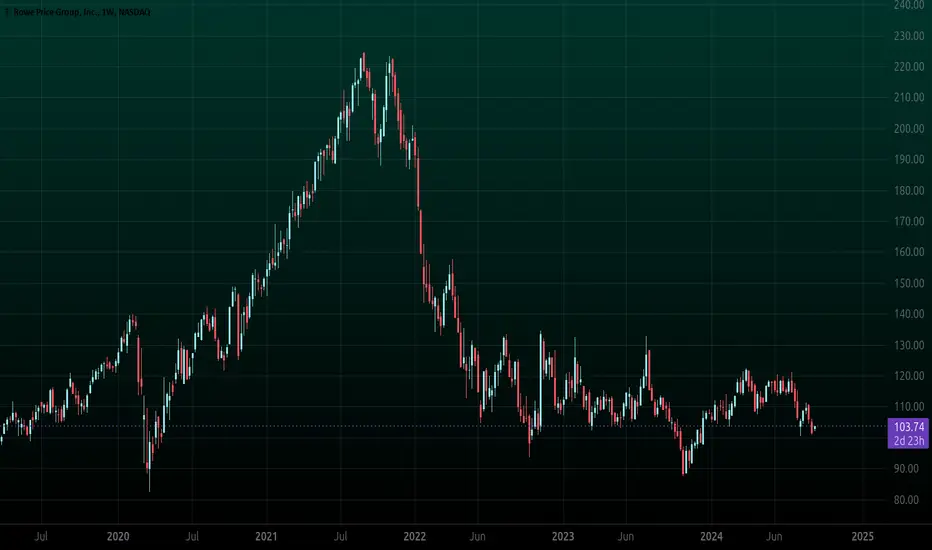
TROWTo me TROW is undervalued as I'm looking at the charts.
Price has a good support level around $90 as we can see in December 2018 and again March 2020, once price hit those levels we saw a quick bullish run afterwards. So fastforward to October 2023 and we see that support level being tested again.

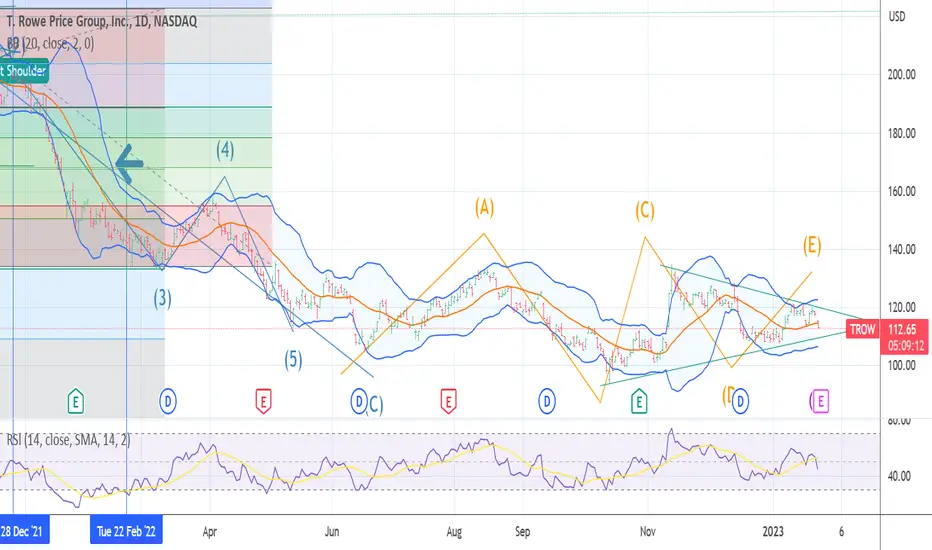
TROW Follow the Real MONEY wave e of B ending The chart posted is and has been a chart to which I have felt the real underlying market moves are true!! We are now fast approaching the final move up in wave E to end the B wave that started in SUPER CYCLE decline from My forecast 12/8 2021 the BULL MARKET ENDED from 1974 and maybe 1932 . S

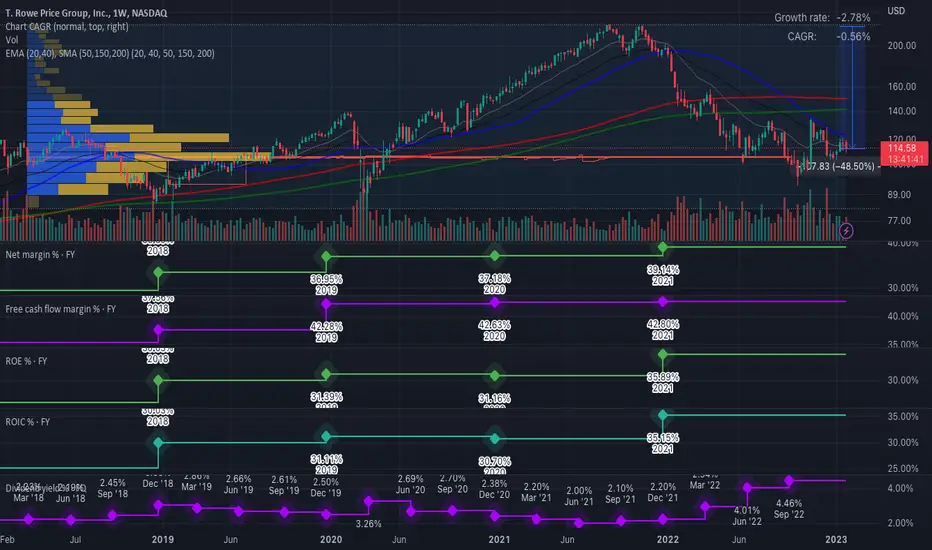
TROWStock Price has decreased 48.6% to date from all time high. Price level has retraced near consolidation where most transacted price level took place over last 5 years period near $ 109 level.
TROW has strong fundamental with high net margin/ cash flow margin & high ROE/ROIC .
Good dividend yield
TROW LOOKING FOR THE RETEST AT 94 MIN . RAISE CASH THE CHART below is that of the TROW it has been key to the BIG picture for me and my view over the last 18 months longterm positioning is nearing a good rate of return and pays a great dividend
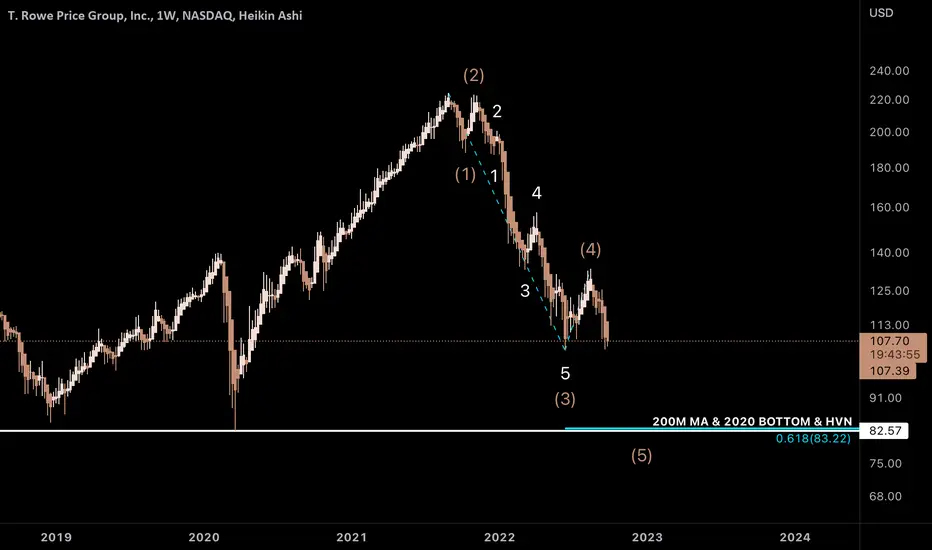
TROW: Capitulation incomingLooks like fancy titles like Dividend Aristocrats, Kings, Zombies, etc. don't mean much when everything is nosediving off a cliff. Looking for the end of a 5 wave impulse and a buy entry at ~$83 where 200M MA, 2020 bottom, High Volume Node, .618 and .786 fib are located.
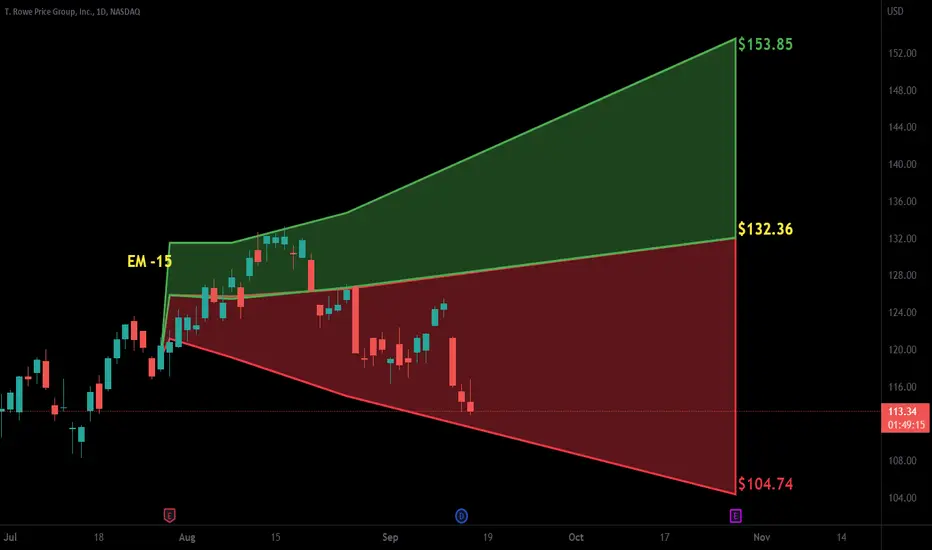
$TROW with a Bullish outlook following its earnings #Stocks The PEAD projected a Bullish outlook for $TROW after a Positive Under reaction following its earnings release placing the stock in drift A with an expected accuracy of 25%.
RectanglePrice is above top trendline of the channel.
A lot depends on Mr. Market and how long this rally continues.
No recommendation.
Short interest is over 7% which is bit higher than I expected.
EPS (FWD)
8.44
PE (FWD)
15.39
Div Rate (FWD)
$4.80
Yield (FWD)
3.66%
Short Interest
7.51%
Market Cap
$28.1
See all ideas
Summarizing what the indicators are suggesting.
Neutral
SellBuy
Strong sellStrong buy
Strong sellSellNeutralBuyStrong buy
Neutral
SellBuy
Strong sellStrong buy
Strong sellSellNeutralBuyStrong buy
Neutral
SellBuy
Strong sellStrong buy
Strong sellSellNeutralBuyStrong buy
An aggregate view of professional's ratings.
Neutral
SellBuy
Strong sellStrong buy
Strong sellSellNeutralBuyStrong buy
Neutral
SellBuy
Strong sellStrong buy
Strong sellSellNeutralBuyStrong buy
Neutral
SellBuy
Strong sellStrong buy
Strong sellSellNeutralBuyStrong buy
Displays a symbol's price movements over previous years to identify recurring trends.
Curated watchlists where TR1 is featured.

Frequently Asked Questions
The current price of TR1 is 91.17 EUR — it has decreased by −0.52% in the past 24 hours. Watch T. ROWE PRICE GROUP INC stock price performance more closely on the chart.
Depending on the exchange, the stock ticker may vary. For instance, on GETTEX exchange T. ROWE PRICE GROUP INC stocks are traded under the ticker TR1.
TR1 stock has risen by 4.10% compared to the previous week, the month change is a 14.97% rise, over the last year T. ROWE PRICE GROUP INC has showed a −15.74% decrease.
We've gathered analysts' opinions on T. ROWE PRICE GROUP INC future price: according to them, TR1 price has a max estimate of 94.82 EUR and a min estimate of 74.13 EUR. Watch TR1 chart and read a more detailed T. ROWE PRICE GROUP INC stock forecast: see what analysts think of T. ROWE PRICE GROUP INC and suggest that you do with its stocks.
TR1 stock is 1.45% volatile and has beta coefficient of 1.14. Track T. ROWE PRICE GROUP INC stock price on the chart and check out the list of the most volatile stocks — is T. ROWE PRICE GROUP INC there?
Today T. ROWE PRICE GROUP INC has the market capitalization of 20.10 B, it has increased by 5.69% over the last week.
Yes, you can track T. ROWE PRICE GROUP INC financials in yearly and quarterly reports right on TradingView.
T. ROWE PRICE GROUP INC is going to release the next earnings report on Aug 1, 2025. Keep track of upcoming events with our Earnings Calendar.
TR1 earnings for the last quarter are 2.06 EUR per share, whereas the estimation was 1.96 EUR resulting in a 4.93% surprise. The estimated earnings for the next quarter are 1.82 EUR per share. See more details about T. ROWE PRICE GROUP INC earnings.
T. ROWE PRICE GROUP INC revenue for the last quarter amounts to 1.63 B EUR, despite the estimated figure of 1.65 B EUR. In the next quarter, revenue is expected to reach 1.47 B EUR.
TR1 net income for the last quarter is 441.93 M EUR, while the quarter before that showed 413.73 M EUR of net income which accounts for 6.82% change. Track more T. ROWE PRICE GROUP INC financial stats to get the full picture.
Yes, TR1 dividends are paid quarterly. The last dividend per share was 1.10 EUR. As of today, Dividend Yield (TTM)% is 4.75%. Tracking T. ROWE PRICE GROUP INC dividends might help you take more informed decisions.
T. ROWE PRICE GROUP INC dividend yield was 4.39% in 2024, and payout ratio reached 54.18%. The year before the numbers were 4.53% and 62.89% correspondingly. See high-dividend stocks and find more opportunities for your portfolio.
As of Jul 20, 2025, the company has 8.16 K employees. See our rating of the largest employees — is T. ROWE PRICE GROUP INC on this list?
EBITDA measures a company's operating performance, its growth signifies an improvement in the efficiency of a company. T. ROWE PRICE GROUP INC EBITDA is 2.46 B EUR, and current EBITDA margin is 38.59%. See more stats in T. ROWE PRICE GROUP INC financial statements.
Like other stocks, TR1 shares are traded on stock exchanges, e.g. Nasdaq, Nyse, Euronext, and the easiest way to buy them is through an online stock broker. To do this, you need to open an account and follow a broker's procedures, then start trading. You can trade T. ROWE PRICE GROUP INC stock right from TradingView charts — choose your broker and connect to your account.
Investing in stocks requires a comprehensive research: you should carefully study all the available data, e.g. company's financials, related news, and its technical analysis. So T. ROWE PRICE GROUP INC technincal analysis shows the buy rating today, and its 1 week rating is buy. Since market conditions are prone to changes, it's worth looking a bit further into the future — according to the 1 month rating T. ROWE PRICE GROUP INC stock shows the sell signal. See more of T. ROWE PRICE GROUP INC technicals for a more comprehensive analysis.
If you're still not sure, try looking for inspiration in our curated watchlists.
If you're still not sure, try looking for inspiration in our curated watchlists.