GBPJPY Long – Deep Sweep Reversal from 196.786 Sellside Liquidit
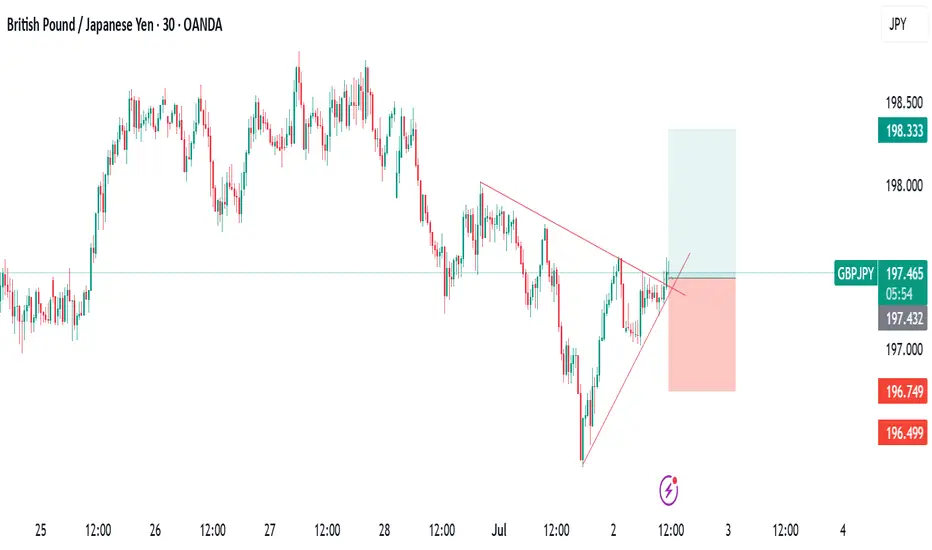
Price swept major sellside liquidity at 196.786, forming the deepest leg of a broader structural draw during London session. Entry followed a clean W pattern formation and bullish reaction from deep discount territory. This setup aligned with structure, liquidity engineering, and session timing. Trade captured a reversal opportunity with price lifting from the sweep zone and targeting EQ/premium within the intraday box.
JPYGBP trade ideas
GBP/JPY Shifts to Bearish Trend – Key Levels to MonitorGBP/JPY Shifts to Bearish Trend – Key Levels to Monitor
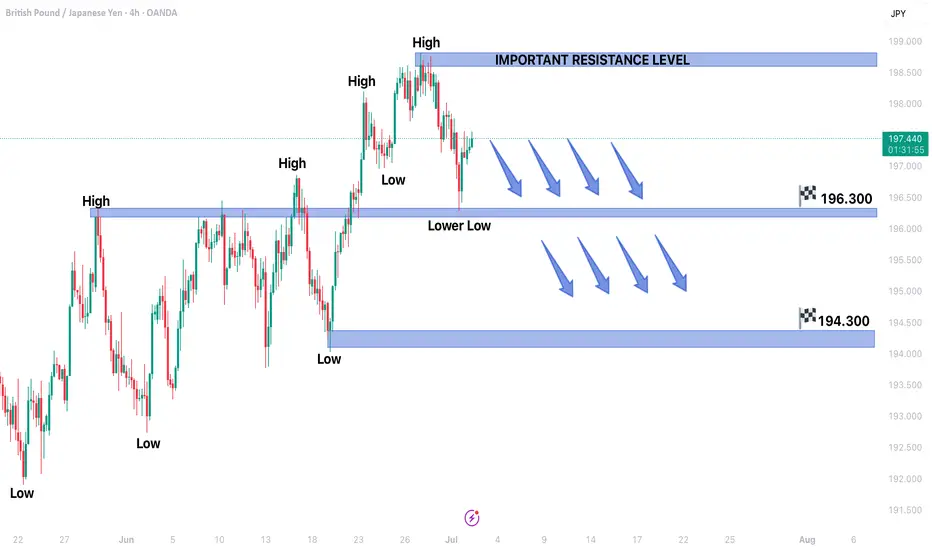
The GBP/JPY pair has entered a confirmed bearish trend structure, with the formation of a lower low signaling increasing selling pressure. This technical development suggests the currency pair may continue its downward trajectory in upcoming trading sessions, presenting potential shorting opportunities for traders.
Bearish Confirmation
The recent lower low formation serves as a classic technical confirmation of bearish momentum. This pattern indicates sellers are successfully pushing prices below previous support levels, establishing a new downward trajectory. The breakdown follows what appears to be exhaustion of the prior bullish trend, with bears now taking control of market direction.
Downside Targets
The pair now eyes potential support levels at:
- 196.300 (immediate target)
- 194.300 (secondary objective)
These levels may provide temporary support, but a decisive break below could accelerate the decline. Traders should watch for potential bearish continuation patterns or reversal signals around these zones.
Key Resistance
The 198.900 level now stands as critical resistance. Any corrective rallies toward this zone:
- May attract fresh selling pressure
- Could offer potential short entry opportunities
- Would need to be decisively broken to invalidate the bearish outlook
Market Considerations
Several factors could influence GBP/JPY's movement:
- Bank of England vs. Bank of Japan policy divergence
- Risk sentiment in global markets
- UK economic data releases
Trading Strategy
With the bearish structure confirmed, traders might consider:
- Short positions on rallies toward resistance
- Tight stop-losses above 198.900
- Profit-taking near support levels
The bearish outlook remains valid unless price reclaims and sustains above the 198.900 resistance level. As always, proper risk management is essential when trading this volatile currency pair.
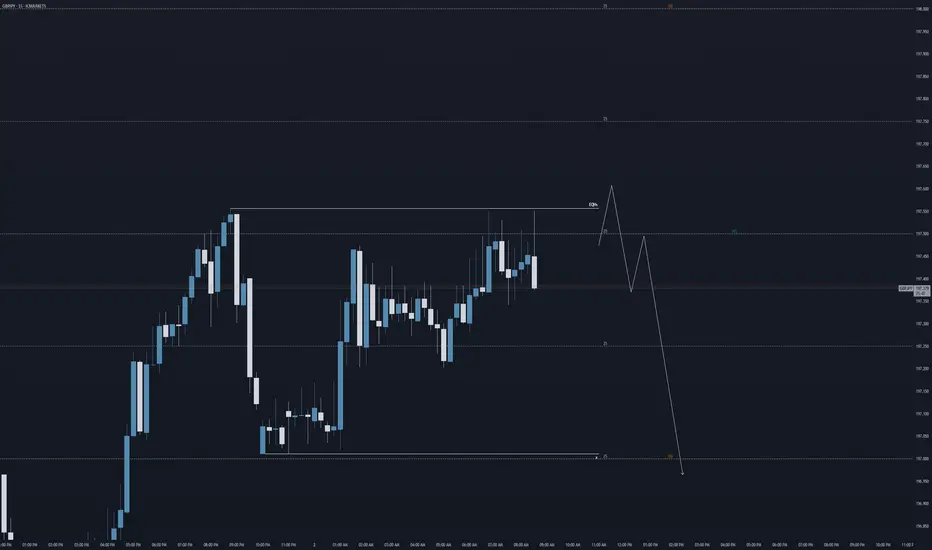
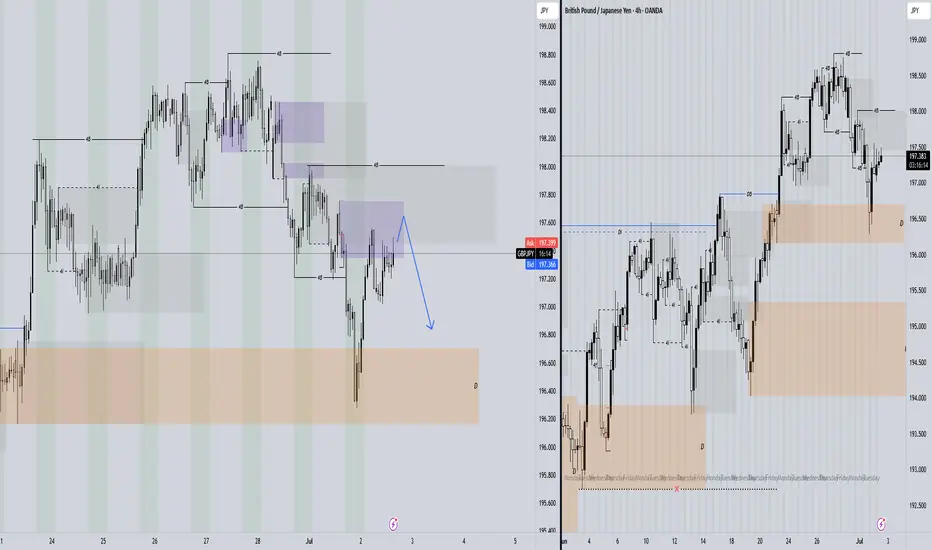
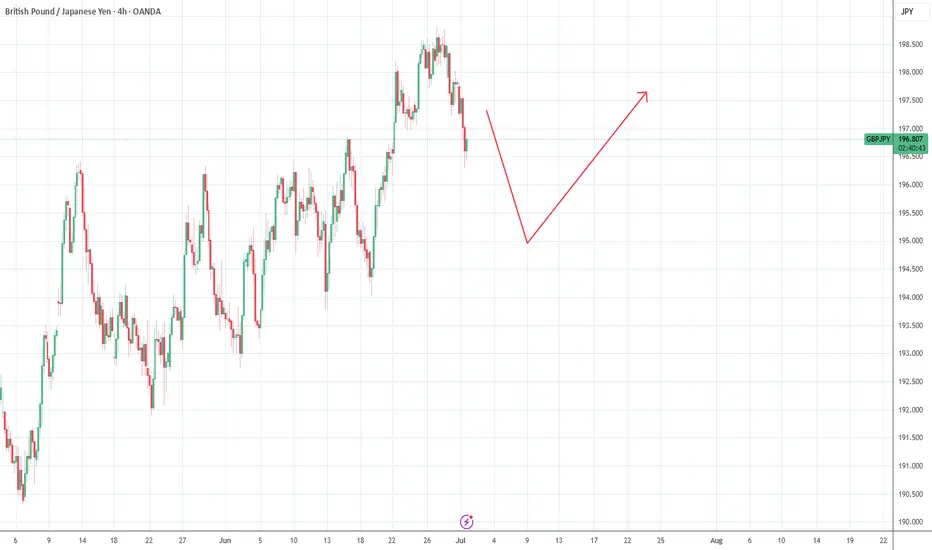
GJ: 50 pip bear leg forecastHi everyone,
I'm forecasting a 50 pip bearish leg on GBPJPY from 197.5 down to 197.0
Looking at price to sweep the highs first (liquidity sweep), before then waiting for the right confirmations to take it lower... IF the price says so.
Kind regards,
Aman | SMC Wolf FX
1-1 student onboarding is currently open (website in my signature & profile)
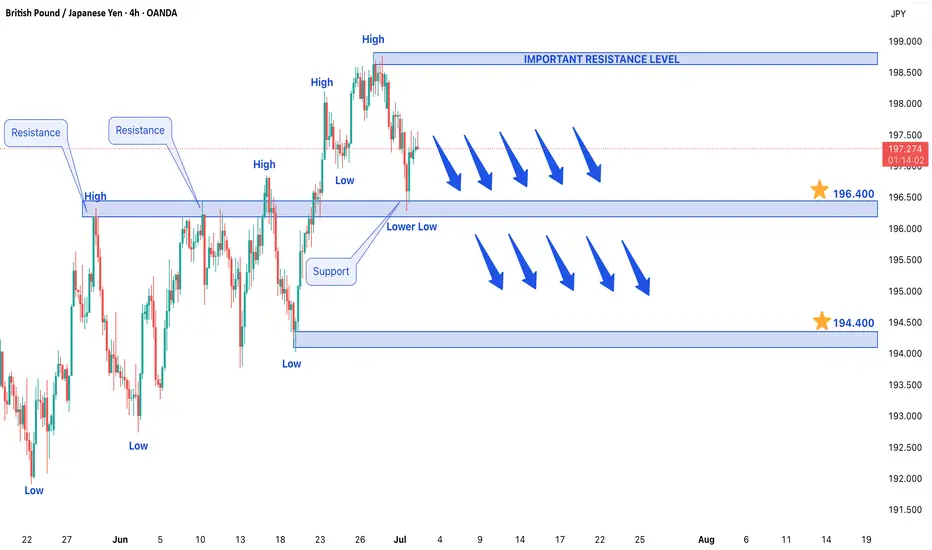
GBPJPY ENTERED IN BEARISH TREND STRUCTUREGBPJPY ENTERED IN BEARISH TREND STRUCTURE.
Lower low confirms bearish trend structure in market.
Market is expected to remain bearish in upcoming trading sessions.
On lower side market may hit the target levels of 196.300 & 194.300.
On higher side 198.900 can act as a major resistance level for the market.
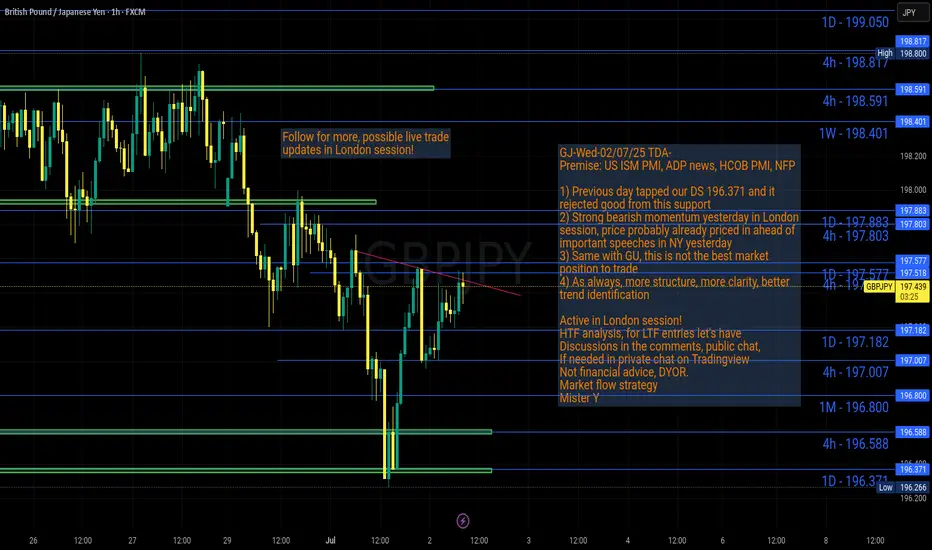
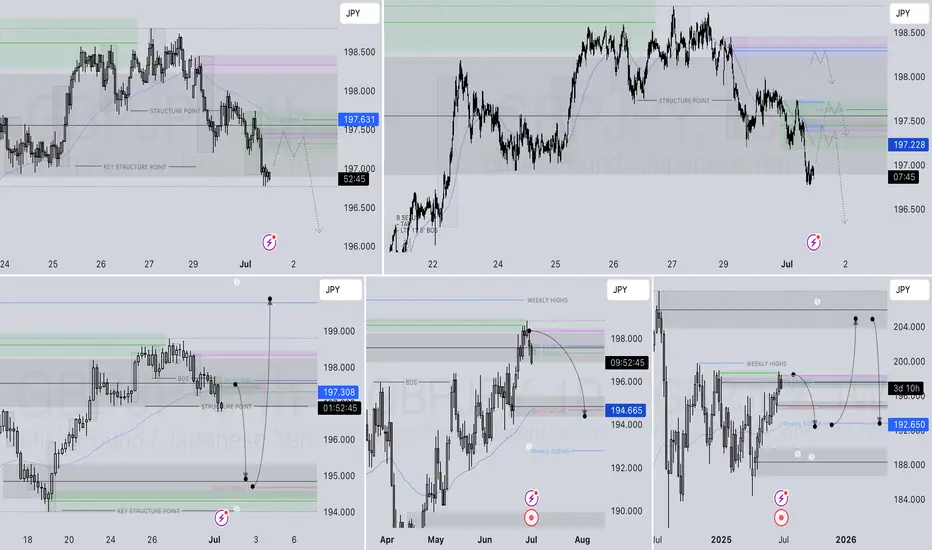
GJ-Wed-02/07/25 TDA-Daily support 196.371 tapped and rejectedAnalysis done directly on the chart
Follow for more, possible live trades update!
I often share my live trades in Tradingview public chat in London session, stay tuned!
Patience.
There are periods where price move smoothly
and some others less smoothly. The trader's
job is to adapting to market changing conditions.
Active in London session!
Not financial advice, DYOR.
Market Flow Strategy
Mister Y
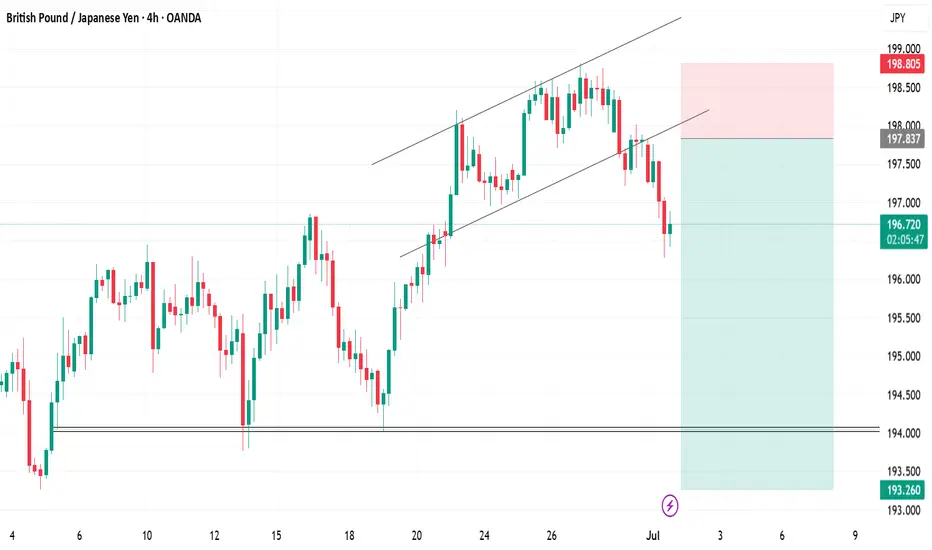
GJ Potentially BearishHi there,
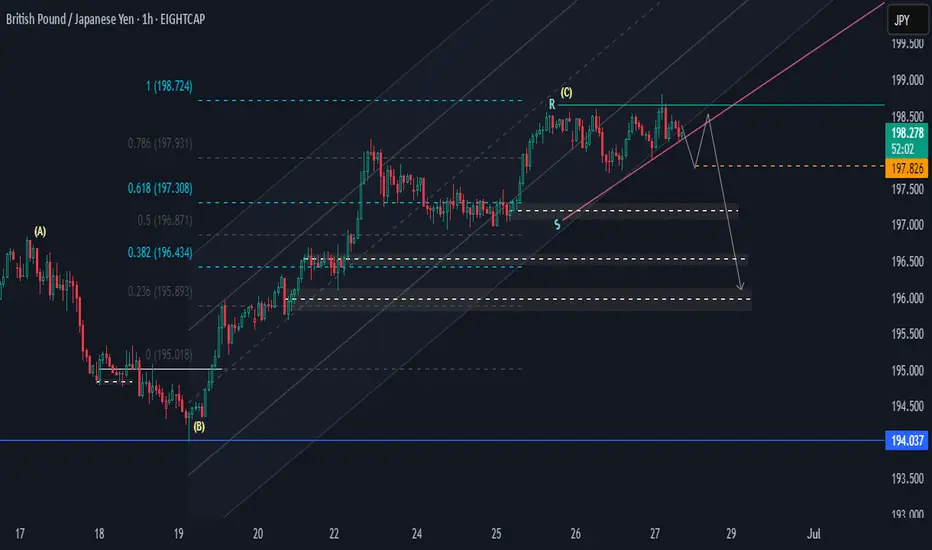
We take another look at GJ. I see an ascending channel pattern with GBP/JPY trading within parallel trendlines. The pair respected both the upper and lower boundaries of this bullish channel, with the current price action showing consolidation near the upper resistance around 198.20 levels.
🎙️ **Key Support and Resistance Levels**
We have critical levels at the time of this writing as following:
- **Immediate Support**: 197.30 (61.8% Fibonacci retracement level) and 196.434 (38.2% Fibonacci retracement)
- **Major Support**: 194.0 37 representing the main channel support
- **Resistance**: 198.80 acting as the primary obstacle.
- **Extended Target**: 199.55 as the next potential bullish objective
**Wave Structure Analysis**
We have ABC wave pattern, with the pair seeming to have completed a Wave (C) bullish rally and now forming a temporary retracement. The current consolidation suggests the pair is "catching its breath" before a breakout.
## 🎲 Some Fundamental Highlights Appealing to Bullish Bias:
**1. Bank of England's Cautious Easing Stance**
BoE Governor Bailey has signaled a "gradual and careful" approach to monetary policy, pointing to sticky inflation concerns while acknowledging a softening labor market with over 100,000 fewer payrolled workers in May. This measured approach is keeping the British Pound supported near year-to-date highs.
**2. Bank of Japan's Divided Policy Response**
The BoJ remains cautious despite rising inflationary pressures, with Governor Ueda maintaining a data-dependent approach. While hawkish board member Naoki Tamura suggests "decisive" rate hikes may be needed, the central bank's measured pace at just 0.5% rates keeps the Yen defensive against stronger currencies.
**3. Inflation Dynamics Favoring GBP**
Japan's Consumer Price Index has surged due to higher food and energy costs, yet the BoJ's hesitant response contrasts with the BoE's more proactive stance on inflation management. This divergence in central bank responses to inflation is supporting GBP strength against the Yen.
**4. Upcoming Japanese Economic Data Releases**
Key Japanese economic indicators are scheduled for release, including June Tokyo CPI, May Unemployment Rate, and Retail Trade data. These releases could provide clarity on the BoJ's future policy direction and potentially impact the Yen's performance against the Pound.
Happy Trading,
K.
Not trading advice.
GBPJPYPrice action trading is a methodology where traders make decisions based on the interpretation of actual price movements on a chart, rather than relying primarily on lagging indicators. It involves observing and analyzing candlestick patterns, trend lines, support and resistance levels, and volume to identify potential trading opportunities and manage risk. The focus is on understanding the story the market is telling through its price behavior.
TCB Checklist Score: 95%🧠 TCB Strategy Breakdown:
This is a textbook example of a TCB Flow setup:
🔹 Trend Phase
The market had been in a strong bullish trend leading into the end of June, topping near 198.800. That bullish impulse set the directional context — the market is overall bullish on the higher timeframe.
Even though price pulled back from those highs, no structural break to the downside occurred. So we still treat the overall flow as bullish.
🔹 Countertrend Phase
From the highs, price began a clean descending channel — the typical correction we look for. It wasn’t random chop — it had defined boundaries, touchpoints, and aligned with the psychology of a cooling market before the next push.
The countertrend ended with a false breakdown below 197.00, quickly rejecting off the 196.850 support zone. That created the final “spring” setup to trap early sellers.
🔹 Breakout Phase
We then get the breakout — price slices through the countertrend channel and closes strongly above it, just above 197.350–197.500 — which also acted as an earlier support–turned–resistance zone. That dual confluence makes this breakout high probability.
The best part? After the breakout, price dipped back into the zone, gave a clean retest wick, and showed bullish rejection — our TCB-style entry trigger.
🧭 Why This Trade Stands Out:
✅ Structure is clear — trend, pullback, breakout all line up visually
✅ No conflicting zones — clean path to TP (198.627)
✅ Risk–Reward solid — SL below last reaction low, TP back to major resistance
✅ Session timing — breakout happening around NY session, ideal for momentum
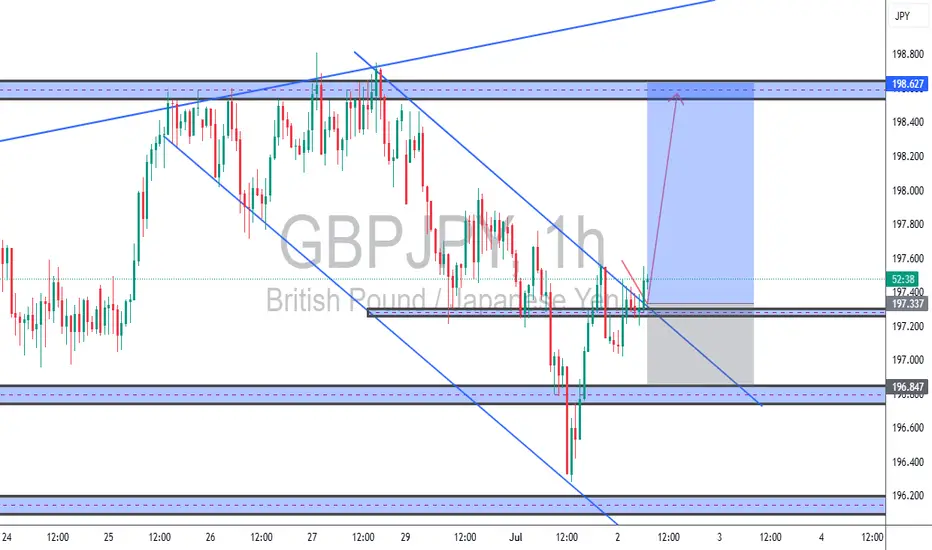
Clean TCB structure unfolding:
🔹 Trend Phase: Bullish move into 198.800 zone
🔹 Countertrend: Descending channel formed from highs
🔹 Breakout: Price broke above the countertrend channel with confluence at 197.35–197.50 support
✅ TCB Checklist Score: 95%
🎯 Entry: 197.50
🛡️ SL: 196.95
🏁 TP: 198.627
📈 R-Multiple: Projected 2.25R
NY session momentum could push this clean breakout toward target.
Trade the Flow. Master the Market – #TCBFlow
Bearish continuationI am expecting price to continue lower from here for the short term. Since we have already mitigated the HTF bullish continuation demand zone this is a medium probability setup. Often this types of setup works best when applied with the LTF confirmation. Also there is a strong spike after the mitigation of daily demand zone so that is a good indication of big money buying pressure.
Can the pound-yen maintain its uptrend?Fundamental:
BoE Governor Bailey signaled potential rate cuts ahead, with markets expecting a 0.25% rate cut in Aug. Political uncertainty persists as UK PM Starmer scaled back on welfare reforms amid a party rebellion, adding to fiscal caution. Trade tensions intensified as US President Trump threatened new tariffs on Japan and demanded greater agricultural access.
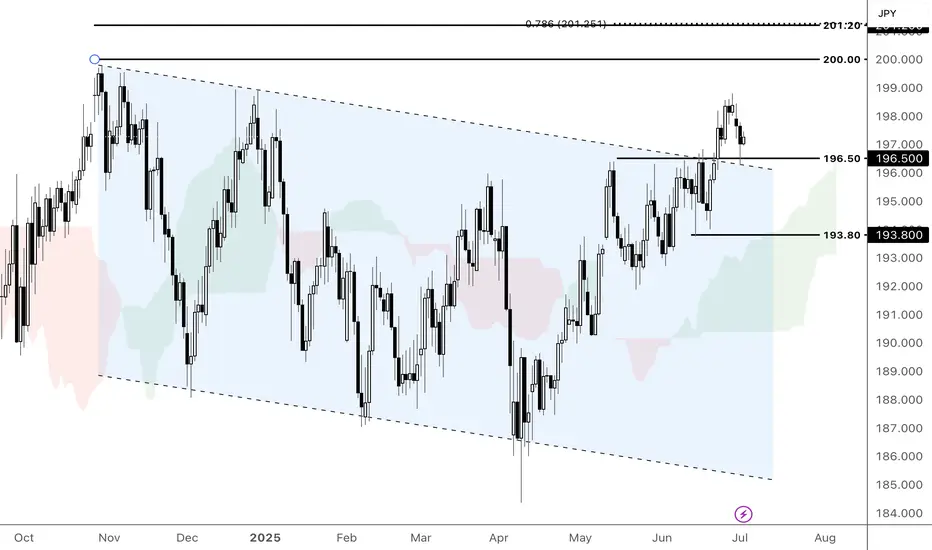
Technicals:
GBPJPY retreated from recent highs following a break above the ascending channel's upper bound. If GBPJPY rebounds from the support at 196.50, the price could extend its rally to the psychological resistance at 200.00. Conversely, a break below 196.50 could prompt a decline to the following support at 193.80.
By Li Xing Gan, Financial Markets Strategist Consultant to Exness
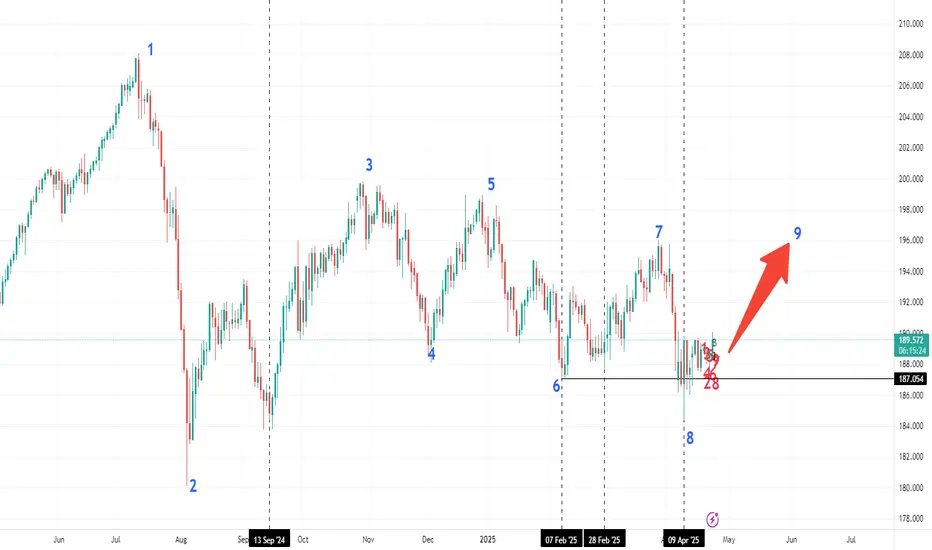
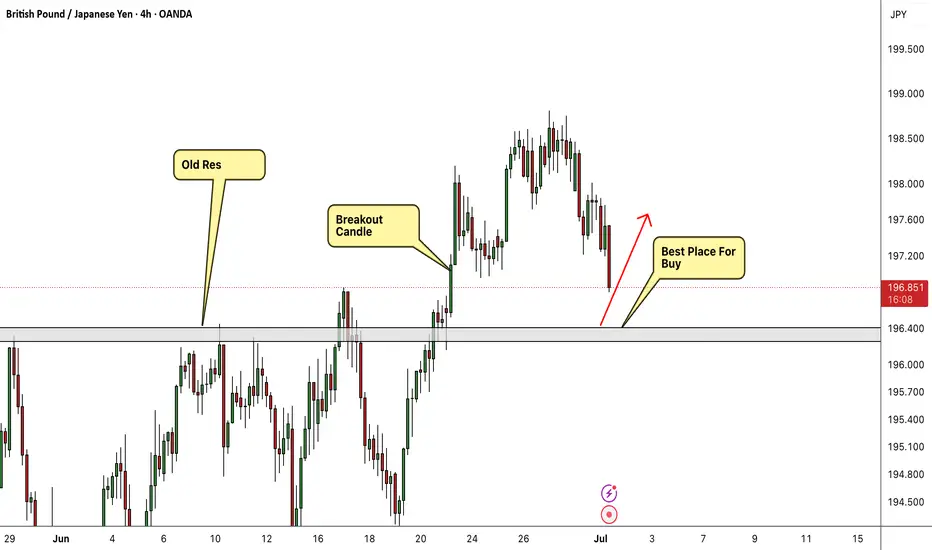
GBP/JPY Best Place To Buy Very Clear , Let`s Get This 200 Pips !Here is my 4H T.F Chart and if we check we will see that we have a very good support area very near the price now and we have already a good breakout and the price never retest the broken res and new supp so i`m waiting the price to retest it and give me any bullish price action and then we can buy it and targeting from 100 to 200 pips . and if we have a daily closure below my support then this idea will not be valid .
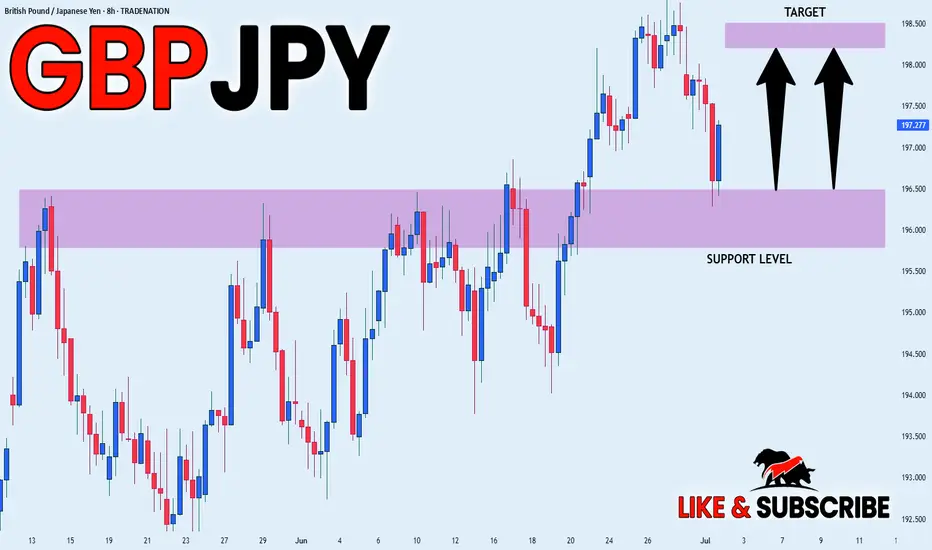
GBP_JPY WILL GROW|LONG|
✅GBP_JPY made a pullback
From the resistance above just
As we predicted, however, the
Pair made a retest of the horizontal
Support below around 196.500 and
We are already seeing a beautiful
Rebound so as the pair is in the
Uptrend we will be expecting
A further bullish move up
LONG🚀
✅Like and subscribe to never miss a new idea!✅
Disclosure: I am part of Trade Nation's Influencer program and receive a monthly fee for using their TradingView charts in my analysis.
#GBPJPY Buy 196.732#GBPJPY Buy 196.732
SL 196.132
TP 196.932
TP 197.732
TP 199.132
Trade at your own risk
Protect your capital
The Wizard 🧙♂️ SWFX
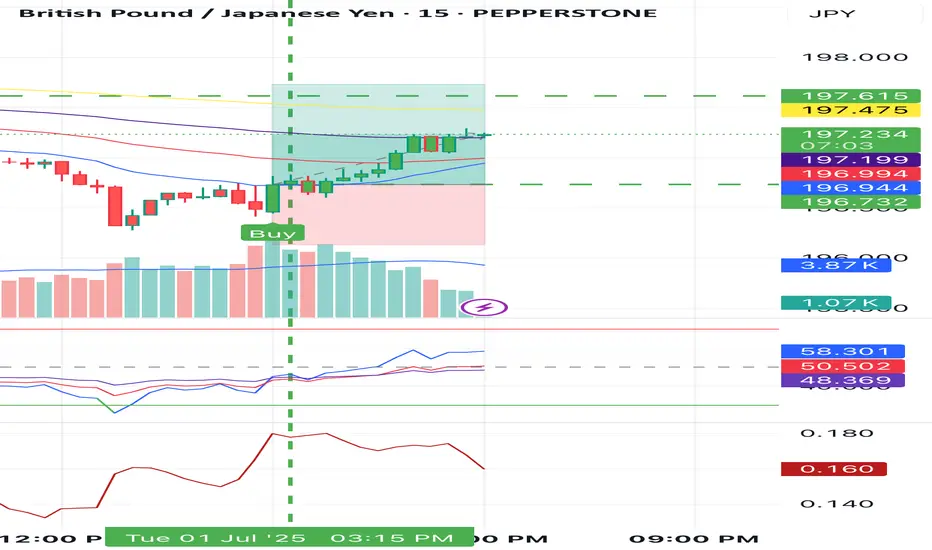
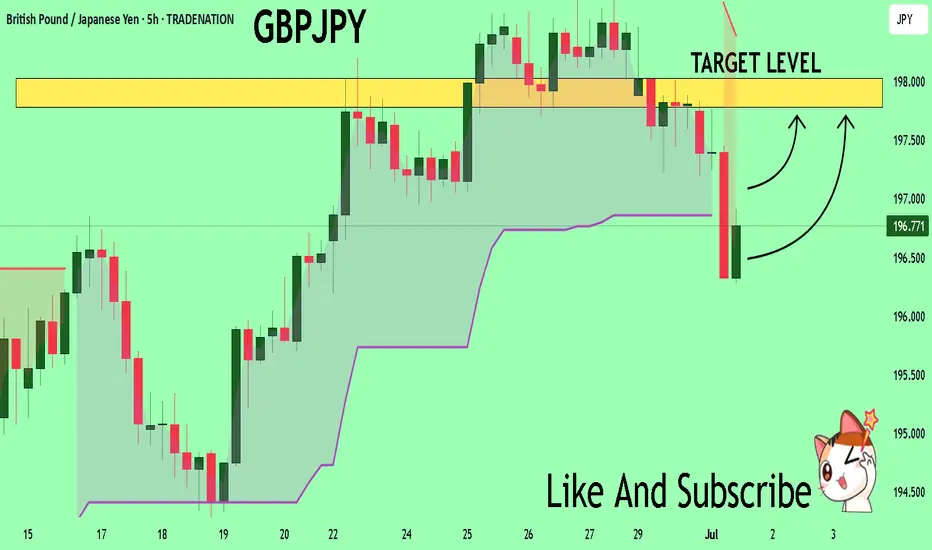
GBPJPY On The Rise! BUY!
My dear friends,
Please, find my technical outlook for GBPJPY below:
The instrument tests an important psychological level 196.72
Bias - Bullish
Technical Indicators: Supper Trend gives a precise Bullish signal, while Pivot Point HL predicts price changes and potential reversals in the market.
Target - 197.78
About Used Indicators:
Super-trend indicator is more useful in trending markets where there are clear uptrends and downtrends in price.
Disclosure: I am part of Trade Nation's Influencer program and receive a monthly fee for using their TradingView charts in my analysis.
———————————
WISH YOU ALL LUCK
GBPJPY Bearish JulyAs usual, at the beginning of each month, we like to have an overview of the current and previous month price action. Price is slowly starting a downtrend. It may be late for entry but this is a huge move in which one is scoring big with sells this July
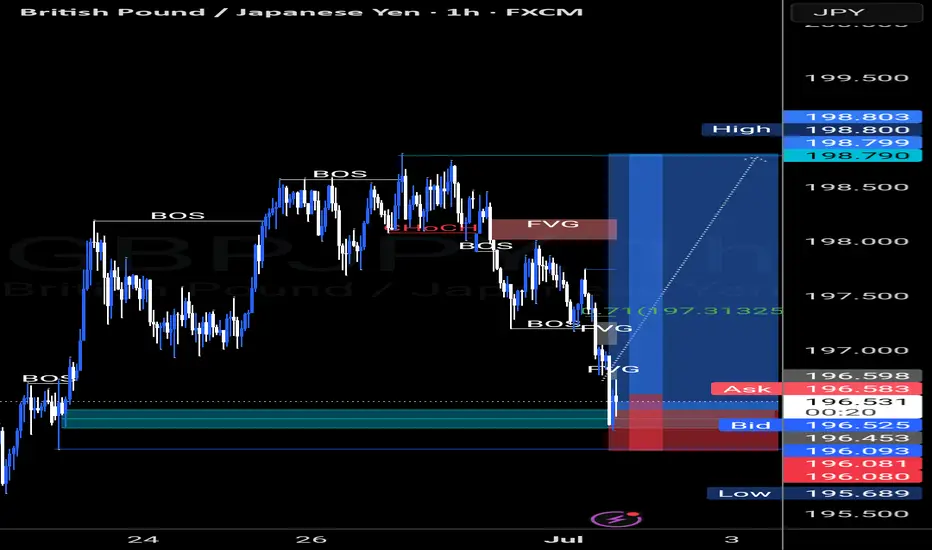
Long on GBPJPY SMC Draft 📈 GBPJPY – Smart Money Story Unfolding 📖
The bears had full control, breaking structure several times and confirming their dominance after a clear CHOCH near 198.200. Each drop left behind footprints—Fair Value Gaps (FVGs) and untapped liquidity—marking where smart money had been active.
But just as the market reached a deep discount zone, price tapped into an unmitigated demand area and swept liquidity below the previous low. Classic smart money behavior—grab the stops, then react.
Now, the bulls have entered the scene with intent. The strong reaction from 195.689–196.080 suggests possible accumulation and a shift in momentum. If this holds, we could see price revisit the upper FVGs around 198.800, where more liquidity awaits.
But if price fails to hold this base, the bearish flow continues. Watch how this story unfolds—liquidity is king, and smart money never sleeps.
GBPJPY SHORT DAILY FORECAST Q3 D1 W27 Y25GBPJPY SHORT DAILY FORECAST Q3 D1 W27 Y25
Professional Risk Managers👋
Welcome back to another FRGNT chart update📈
Diving into some Forex setups using predominantly higher time frame order blocks alongside confirmation breaks of structure.
Let’s see what price action is telling us today! 👀
💡Here are some trade confluences📝
✅Daily Order block identified
✅4H Order Block identified
✅1H Order Block identified
🔑 Remember, to participate in trading comes always with a degree of risk, therefore as professional risk managers it remains vital that we stick to our risk management plan as well as our trading strategies.
📈The rest, we leave to the balance of probabilities.
💡Fail to plan. Plan to fail.
🏆It has always been that simple.
❤️Good luck with your trading journey, I shall see you at the very top.
🎯Trade consistent, FRGNT X
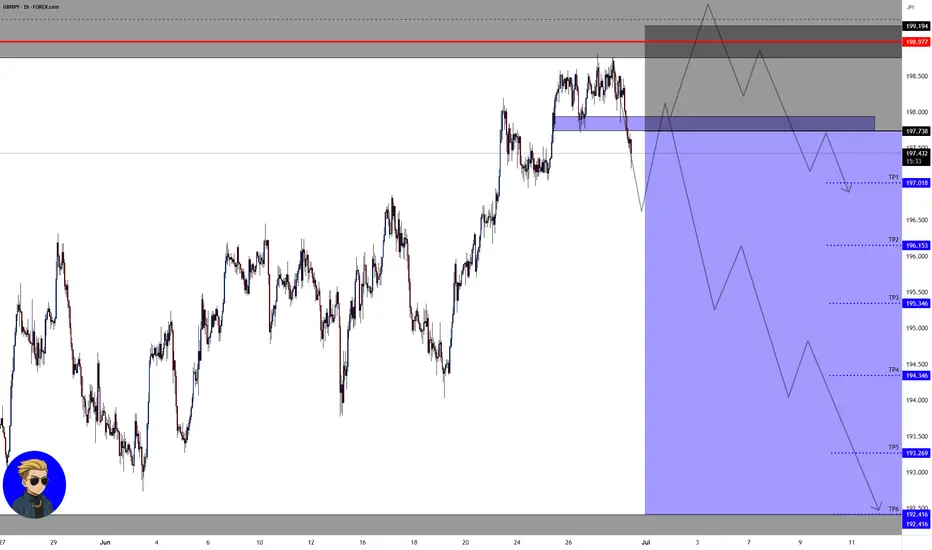
GBP/JPY💰Symbol: { GBP/JPY }
🟩Price: { 197.738 }
🟥Stop: { 199.194 }
1️⃣profit: { 197.018 }
2️⃣profit: { 196.153 }
3️⃣profit: { 195.346 }
4️⃣profit: { 194.346 }
5️⃣profit: { 193.269 }
6️⃣profit: { 192.416 }
📊Check your chart before entering.
🚨Check before use to make sure there is no important news.🚨
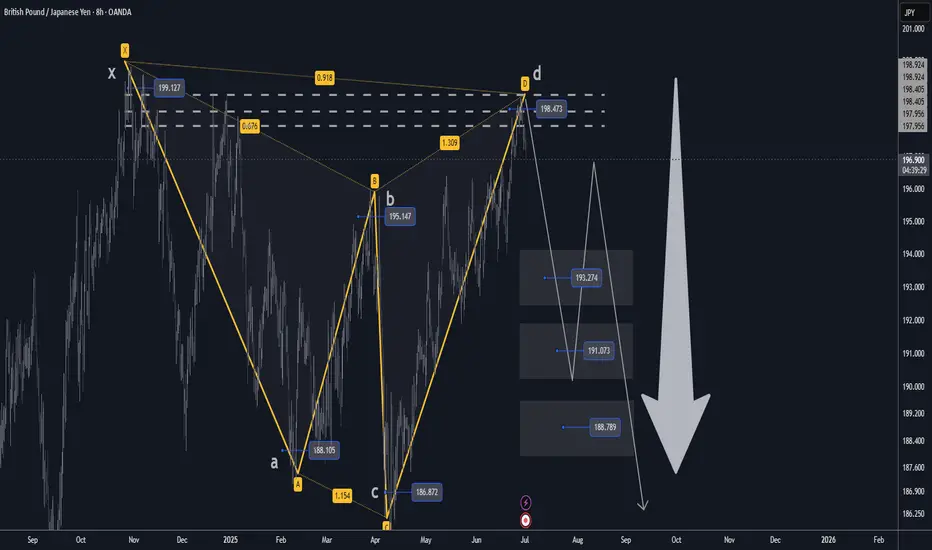
GBPJPY H4 XABCD Short at Market TP Below Market🔸Hello traders, let's review the 4 hour chart for GBPJPY. Strong gains off the lows recently, however price getting overextended and expecting reversal later at/near PRZ/D.
🔸Speculative XABCD structure defined by point X 199 point A 188 point B 195.20 point C 186.80 point D/PRZ 198.40/80 .
🔸Currently most points validated, point D/PRZ validated as well.
Short sell at market SL over point D/PRZ TP details see chart
🔸Recommended strategy for GJ traders: Short Sell at Market
SL over point D/PRZ TP1 193.30 TP2 191.00 TP3 188.80.
🎁Please hit the like button and
🎁Leave a comment to support our team!
RISK DISCLAIMER:
Trading Futures , Forex, CFDs and Stocks involves a risk of loss.
Please consider carefully if such trading is appropriate for you.
Past performance is not indicative of future results.
Always limit your leverage and use tight stop loss.
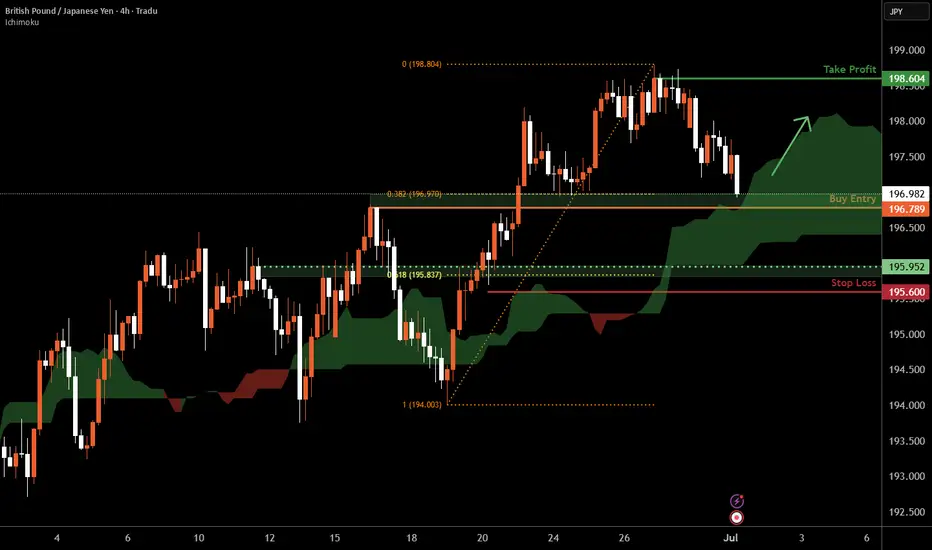
GBP/JPY H4 | Pullback support at 38.2% Fibonacci retracementGBP/JPY is falling towards a pullback support and could potentially bounce off this level to climb higher.
Buy entry is at 196.78 which is a pullback support that aligns closely with the 38.2% Fibonacci retracement.
Stop loss is at 195.60 which is a level that lies underneath a pullback support and the 61.8% Fibonacci retracement.
Take profit is at 198.60 which is a swing-high resistance.
High Risk Investment Warning
Trading Forex/CFDs on margin carries a high level of risk and may not be suitable for all investors. Leverage can work against you.
Stratos Markets Limited (tradu.com ):
CFDs are complex instruments and come with a high risk of losing money rapidly due to leverage. 63% of retail investor accounts lose money when trading CFDs with this provider. You should consider whether you understand how CFDs work and whether you can afford to take the high risk of losing your money.
Stratos Europe Ltd (tradu.com ):
CFDs are complex instruments and come with a high risk of losing money rapidly due to leverage. 63% of retail investor accounts lose money when trading CFDs with this provider. You should consider whether you understand how CFDs work and whether you can afford to take the high risk of losing your money.
Stratos Global LLC (tradu.com ):
Losses can exceed deposits.
Please be advised that the information presented on TradingView is provided to Tradu (‘Company’, ‘we’) by a third-party provider (‘TFA Global Pte Ltd’). Please be reminded that you are solely responsible for the trading decisions on your account. There is a very high degree of risk involved in trading. Any information and/or content is intended entirely for research, educational and informational purposes only and does not constitute investment or consultation advice or investment strategy. The information is not tailored to the investment needs of any specific person and therefore does not involve a consideration of any of the investment objectives, financial situation or needs of any viewer that may receive it. Kindly also note that past performance is not a reliable indicator of future results. Actual results may differ materially from those anticipated in forward-looking or past performance statements. We assume no liability as to the accuracy or completeness of any of the information and/or content provided herein and the Company cannot be held responsible for any omission, mistake nor for any loss or damage including without limitation to any loss of profit which may arise from reliance on any information supplied by TFA Global Pte Ltd.
The speaker(s) is neither an employee, agent nor representative of Tradu and is therefore acting independently. The opinions given are their own, constitute general market commentary, and do not constitute the opinion or advice of Tradu or any form of personal or investment advice. Tradu neither endorses nor guarantees offerings of third-party speakers, nor is Tradu responsible for the content, veracity or opinions of third-party speakers, presenters or participants.
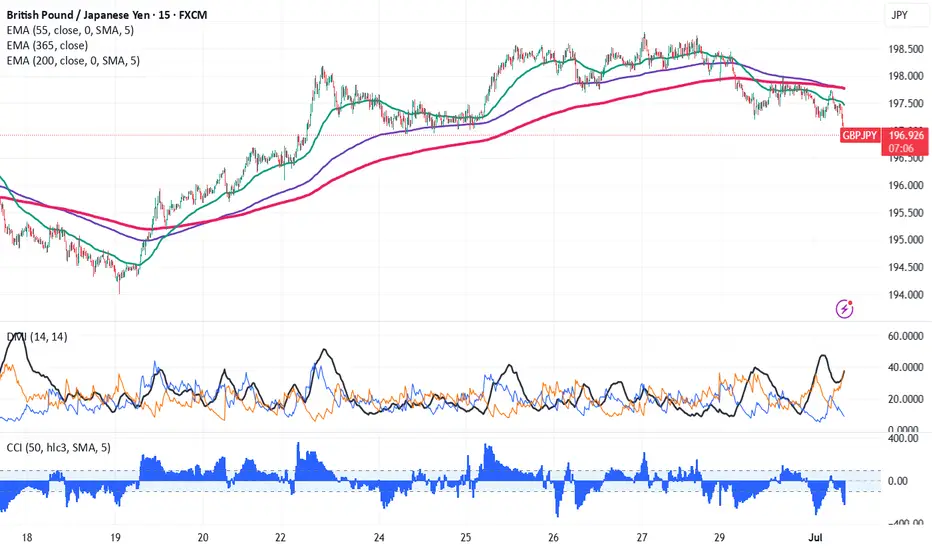
GBPJPY- Sell on rallies The GBP/JPY lost its shine on board-based yen buying. It hit an intraday low of 197.01 and is currently trading around 197. Intraday trend is bearish as long as the resistance at 197.75 holds.
The GBP/JPY pair is trading below 34 and above 55 and 200 EMA (Short-term) and 365 EMA (long-term) on the 15-min chart, confirming a bearish trend. Any violation below 196.70 indicates the intraday trend is weak. A dip to 196/195/194/193.70 is possible. Immediate resistance is at 197.75 a breach above this level targets of 198.35/198.80/200/202.
Market Indicators (15 min chart)
CCI (50)- Bearish
Directional movement index - Bearish
Trading Strategy: buy on dips
It is good to sell on rallies around 197.18-20 with SL around 197.75 for a TP of 195.