ANALYSIS FOR THE UP COMING DAYS AND WEEK FOR GBPJPY -GJ
Trading involves speculation and probabilities, making market direction predictions challenging. Mastering a strategy that works for you is crucial. Currently, I focus on my strategy to consistently profit.
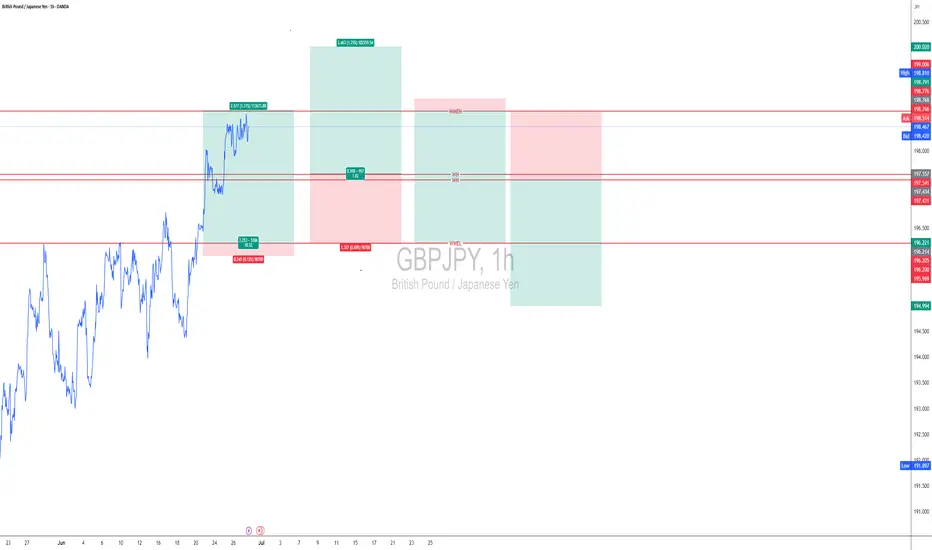
Here's my analysis for the upcoming days: WH and WL levels indicate market direction. If the price closes above WH by Tuesday, expect an upward trend; if below WL, expect a downward trend.
For trading decisions, enter at WMEL or WMEH levels, or trade between them if you prefer and experienced. Always manage your risk carefully.
Don’t worry about the names, these are the names I have given my strategy:
Week High-WH
Week Low- WL
Week High Margin of Error High - WMEH
Week High Margin of Error Low – WMEl
197.5414432 WH
197.4305568 WL
196.2045568 WMEL
198.7674432 WMEH
JPYGBP trade ideas
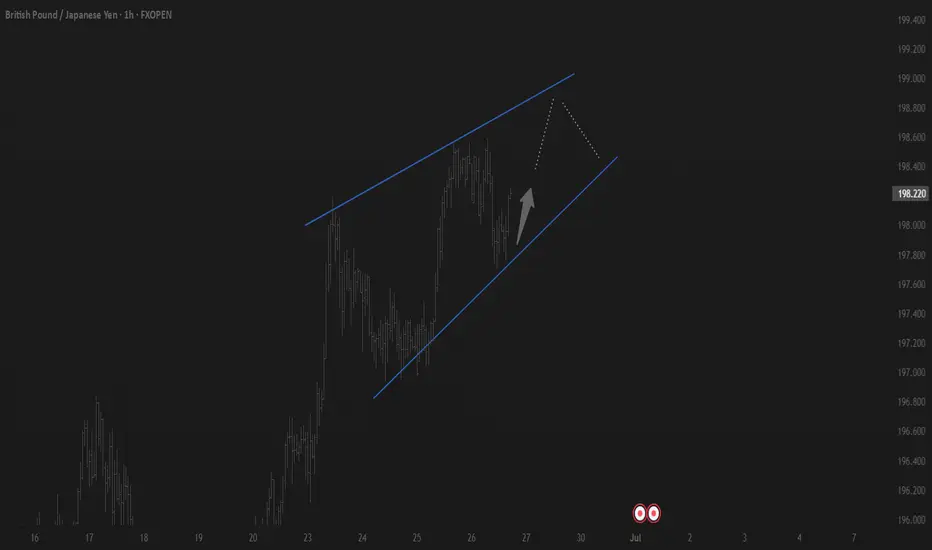
Looking for short before buyI plan to sell from static line until 196.50 and then consider buying once the price reaches the trend line marked in purple.
Before making any buying decisions, i suggest that a short position might be warranted.
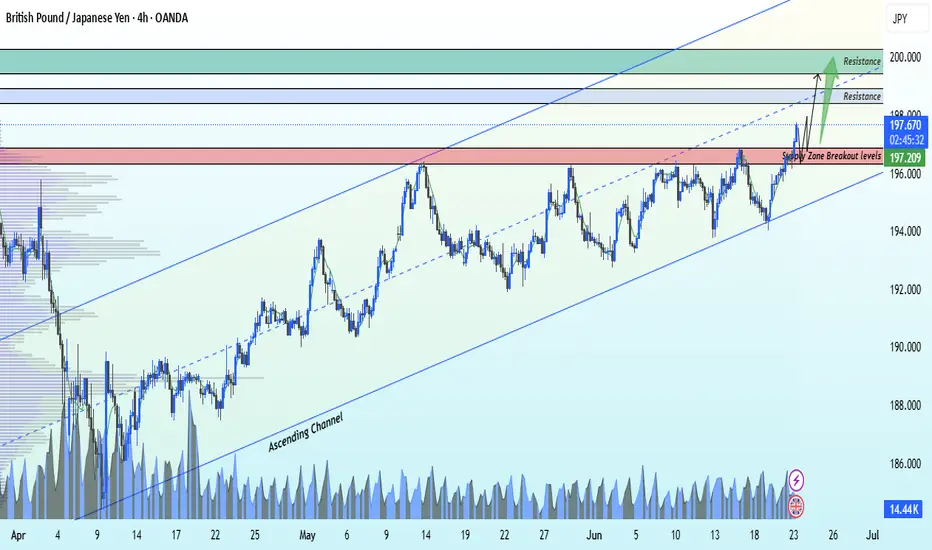
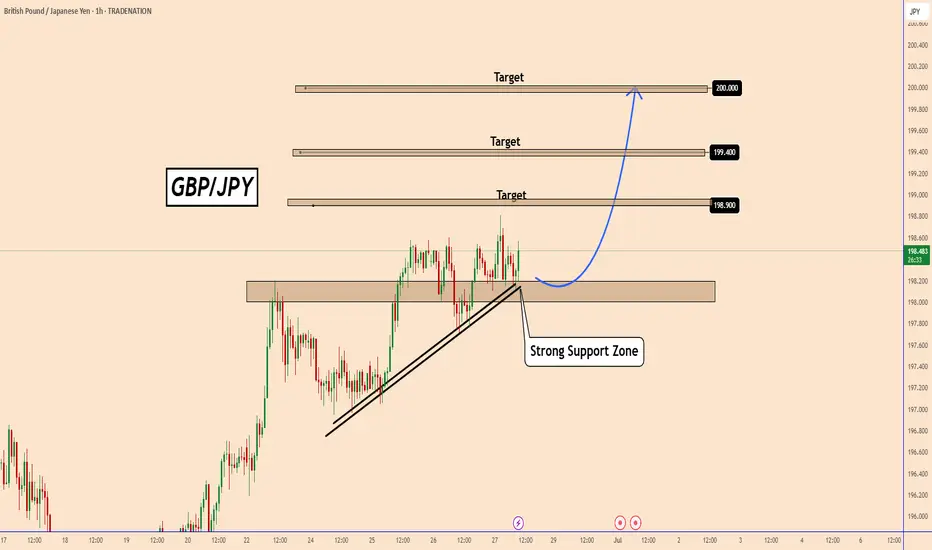
GBPJPY Major Resistance Breakout Ahead📈 GBP/JPY Technical Analysis – 4H Time Frame 🔍
GBPJPY has maintained its ascending structure and recently broke above the previous supply zone at 196.900, signaling bullish strength.
🎯 Entry Idea:
Watch for a retracement to the 196.900 zone — now turned potential demand — for a possible long entry.
📌 Technical Targets:
1st Target: 198.600 (key resistance)
2nd Target: 200.000 (psychological resistance level)
The breakout confirms bullish momentum — a clean retest could offer a solid risk-to-reward setup.
💬 Like, follow, and drop your thoughts in the comments!
📢 Join us for more real-time updates and smart trade setups.
— With love,
Livia 😜✨
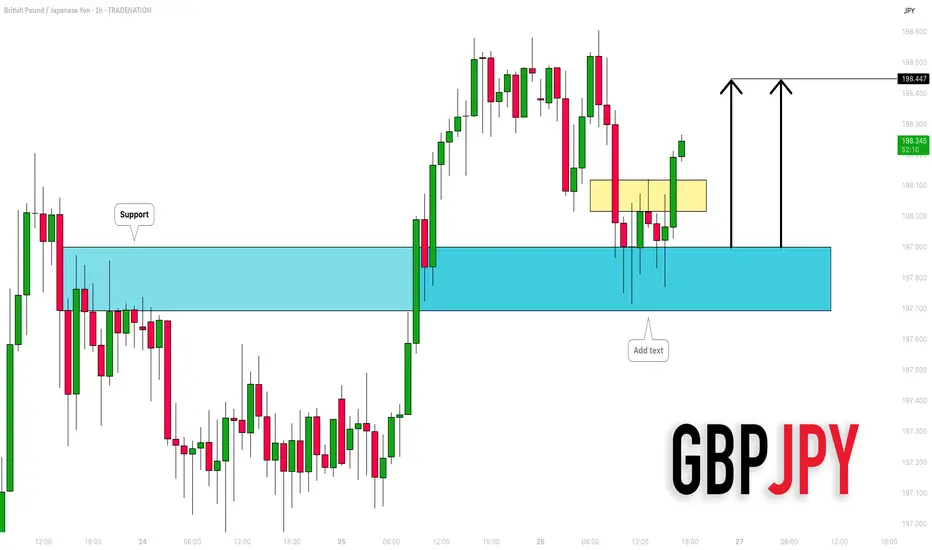
GBPJPY Potential UpsidesHey Traders, in the coming week we are monitoring GBPJPY for a buying opportunity around 198.100 zone, GBPJPY is trading in an uptrend and currently is in a correction phase in which it is approaching the trend at 198.100 support and resistance area.
Trade safe, Joe.
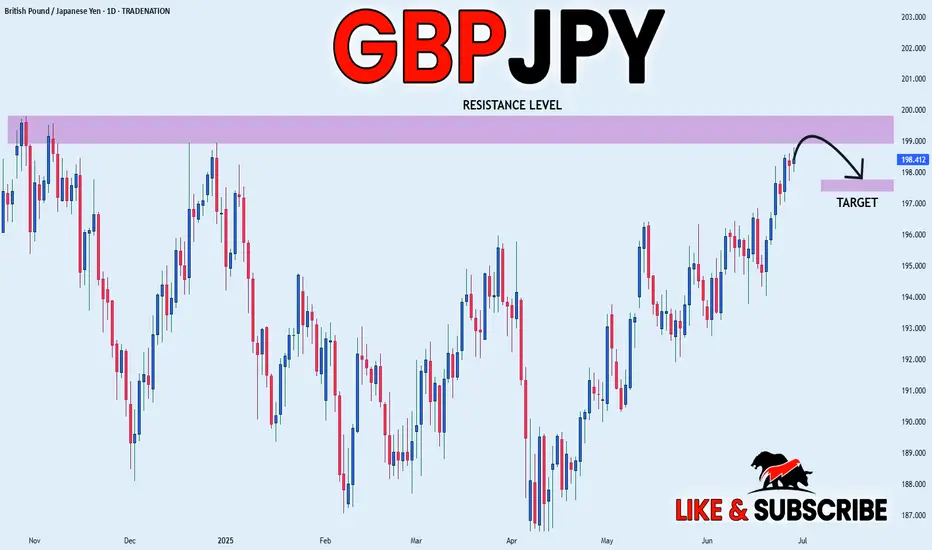
GBP_JPY SWING SHORT|
✅GBP_JPY is going up now
But a strong resistance level is ahead around 199.828
Thus I am expecting a pullback
And a move down towards the target of 197.825
SHORT🔥
✅Like and subscribe to never miss a new idea!✅
Disclosure: I am part of Trade Nation's Influencer program and receive a monthly fee for using their TradingView charts in my analysis.
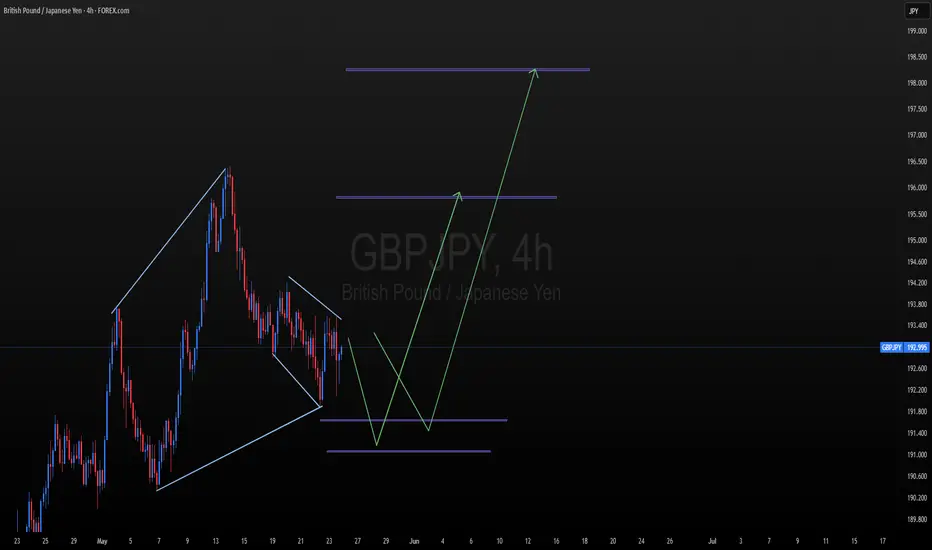
GBPJPY 4hr chart Analaysis I expect GBP/JPY to turn bullish, with a potential pullback from the 191.67–191.00 zone. It’s also possible that the price slightly dips lower, reaching around 190.50, before starting a bullish trend. From there, the price may rise towards the reversal zone at 195.38–196.00.
If it breaks above this zone, the next target could be around 198.04. That level is where I expect a potential bearish reversal to occur.
This is my personal analysis based on my current understanding of the market — it's not guaranteed to be 100% accurate, but I would estimate there's around an 80% probability of it playing out this way
GBPJPY: A Short-Term Bullish OutlookGBPJPY: A Short-Term Bullish Outlook
This move is more related to the BOJ’s uncertainty about rising inflation, and the Bank of Japan is not taking further actions.
On the other hand, one day the BOJ says it will raise interest rates again, and the next day it says the opposite. They are losing credibility.
However, the BOJ is not good at keeping its promises and does not want to make the yen stronger anytime soon.
GBPJPY created a new record high, confirming a new upward move. If the price manages to maintain this pattern, the rise should become clearer and exhibit bullish momentum.
Key target areas: 198.90; 190.40 and 200
You may find more details in the chart!
Thank you and Good Luck!
PS: Please support with a like or comment if you find this analysis useful for your trading day
Disclosure: I am part of Trade Nation's Influencer program and receive a monthly fee for using their TradingView charts in my analysis.
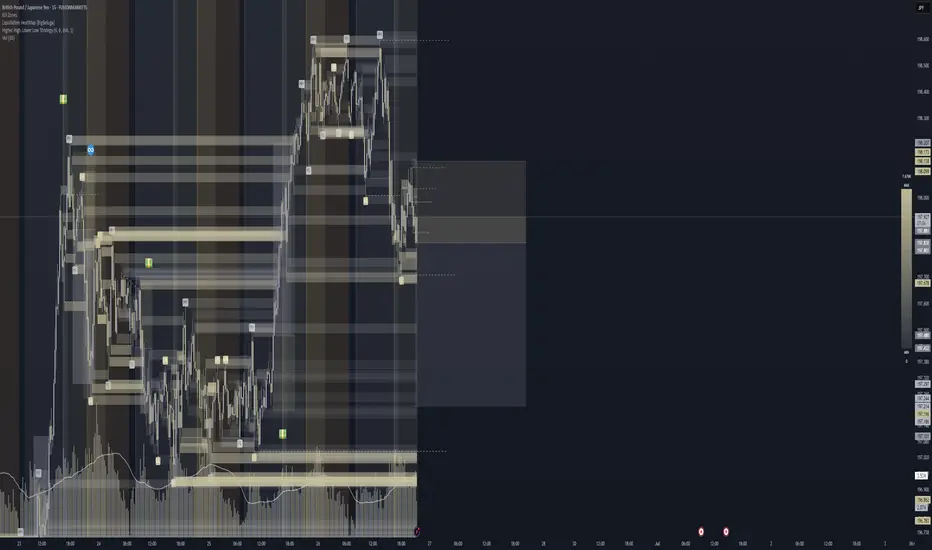
GBPJPY SHORT FORECAST Q2 W26 D27 Y25GBPJPY SHORT FORECAST Q2 W26 D27 Y25
Professional Risk Managers
Welcome back to another FRGNT chart update
Diving into some Forex setups using predominantly higher time frame order blocks alongside confirmation breaks of structure.
Let’s see what price action is telling us today
Here are some trade confluences
Weekly Order Block Identified
Daily Order block identified
4H Order Block identified
15' Order block identified
Remember, to participate in trading comes always with a degree of risk, therefore as professional risk managers it remains vital that we stick to our risk management plan as well as our trading strategies.
The rest, we leave to the balance of probabilities.
Fail to plan. Plan to fail.
It has always been that simple.
Good luck with your trading journey, I shall see you at the very top.
Trade consistent, FRGNT X
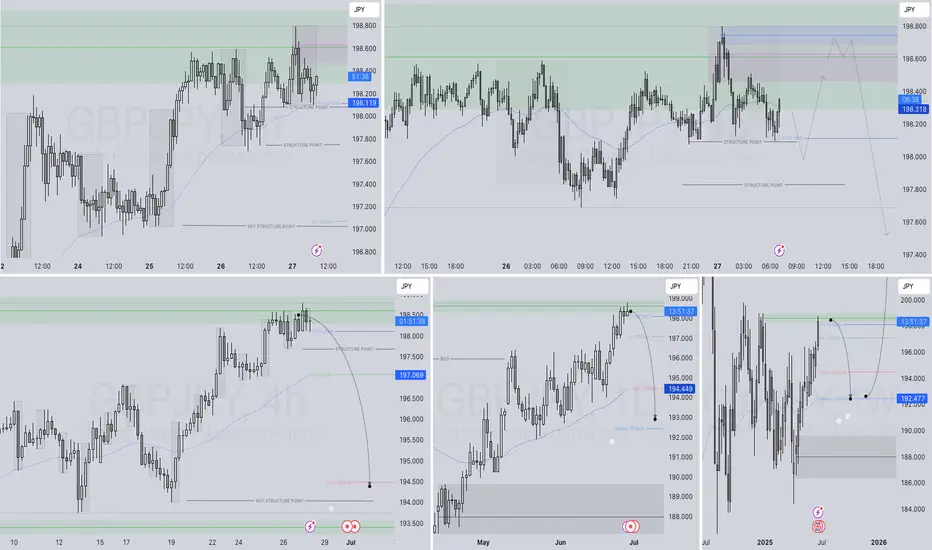
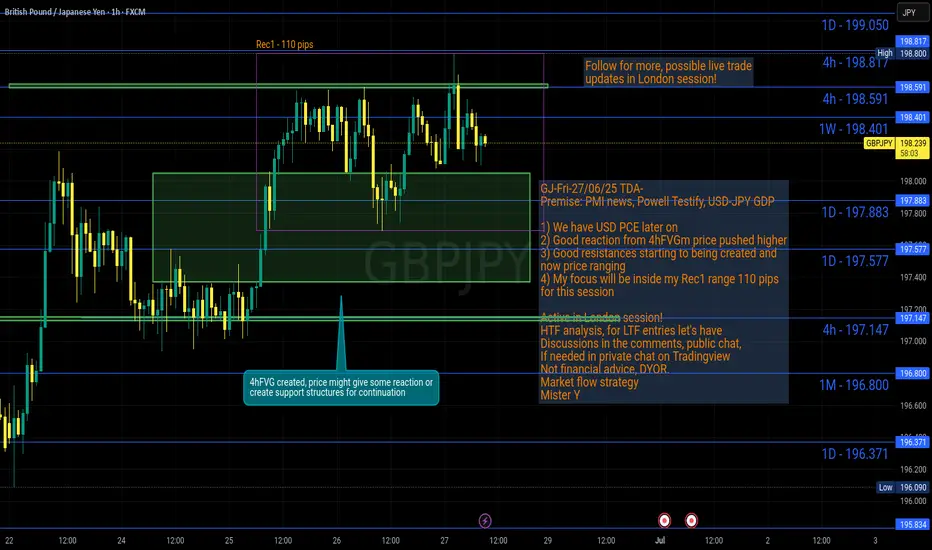
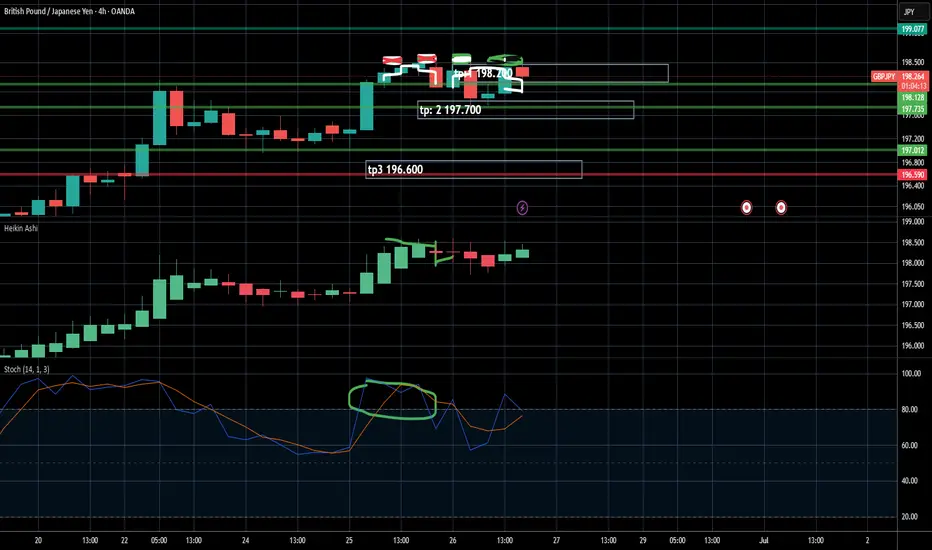
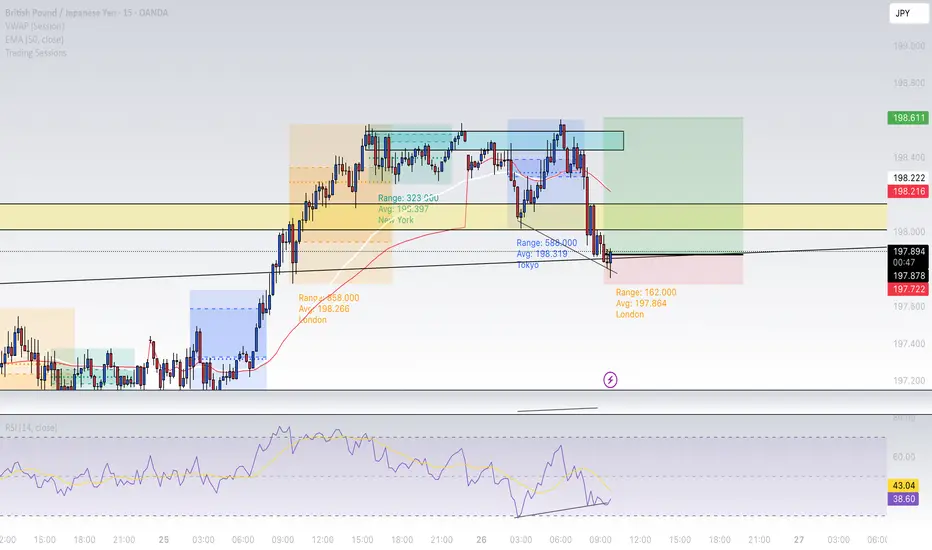
GJ-Fri-27/06/25 TDA-GJ starting to range after it broke higher!Analysis done directly on the chart
Follow for more, possible live trades update!
I often share my live trades in Tradingview public chat in London session, stay tuned!
Have patience!
Without patience, even the easiest thing can be
turned into burden!
Even the easiest setup trade can be turned into
a loss.
Do you agree or disagree? Comment down below!
Active in London session!
Not financial advice, DYOR.
Market Flow Strategy
Mister Y
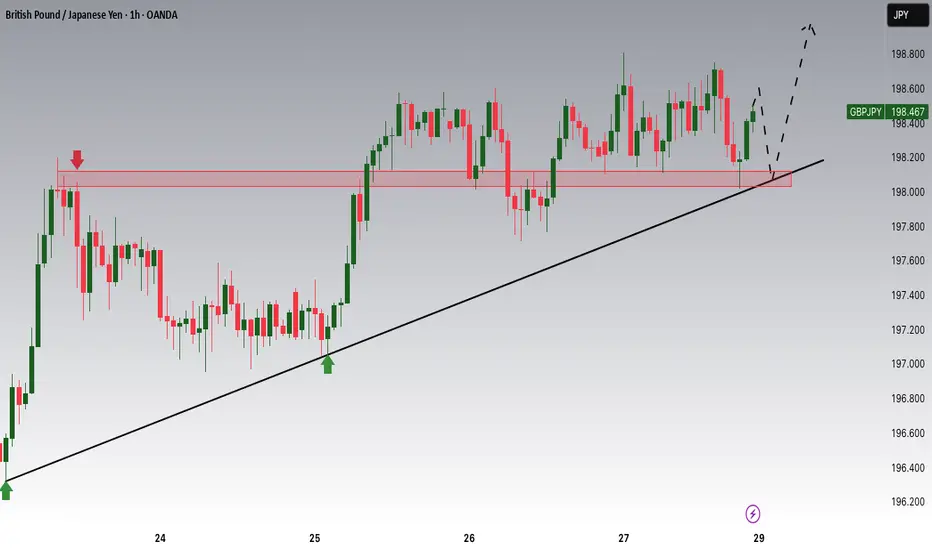
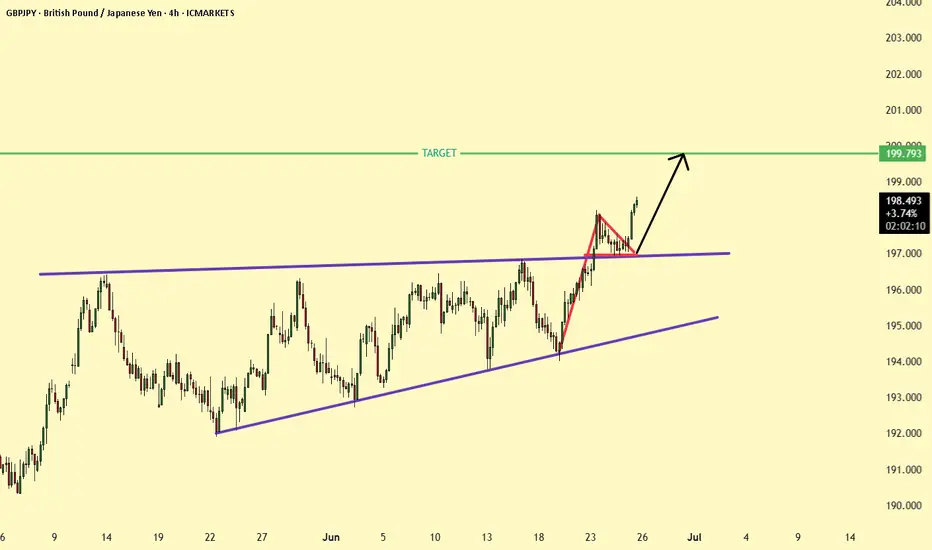
GBPJPY Bullish target 199.7-200 Pennant flag BreakoutThe GBP/JPY 4H chart shows a bullish breakout from an ascending triangle pattern. After breaking above the resistance near 197.5, the price retested the zone and held firmly. This successful retest confirms buyer strength and continuation of the uptrend. The next potential target is around 199.793.
M Rejection & Bearish Continuation Setup (26/6/2025)
Price swept buyside liquidity at 198.034, completing the second leg of an extended M pattern. A strong bearish candle confirmed a break of structure beneath the key shift line, validating short intent.
Now watching for downside continuation toward 197.214 (TP level), with alerts set at 198.138 for any potential invalidation.
Thesis:
- Extended M structure completed after liquidity sweep
- Bearish shift confirmed with strong-bodied close
- Structure supports downside as long as price holds beneath 198.138
Execution rooted in structure, not assumption—letting bearish pressure unfold.
GBP/JPY Faces Key Resistance LevelOver the last four trading sessions, the GBP/JPY pair has appreciated by nearly 1%, favoring the British pound against the yen. This move has been driven mainly by the strength of the British currency, which for now has allowed a consistent bullish bias to take hold in the short term.
At the moment, the pound has remained strong in part due to the neutral policy stance taken by the Bank of England, which maintained its rate at 5% in the latest decision, reflecting continued high inflation in the UK. In contrast, Japan's situation appears different: in its most recent meeting, the Bank of Japan kept interest rates close to 0% after observing signs of inflation slowing, maintaining its ultra-loose monetary policy, unlike other central banks. The contrast between low rates in Japan and higher rates in the UK has created a divergence in central bank policy, making pound-denominated assets more attractive—a dynamic that has continued to weigh on the yen’s recovery in the short term.
Additionally, it’s important to consider that the yen is viewed as a key safe-haven currency. However, this week, following the ceasefire in the Middle East conflict, market confidence has rebounded, reducing constant demand for safe-haven assets like the yen in recent sessions. If these factors persist, they could support a stronger buying pressure on GBP/JPY in the coming days.
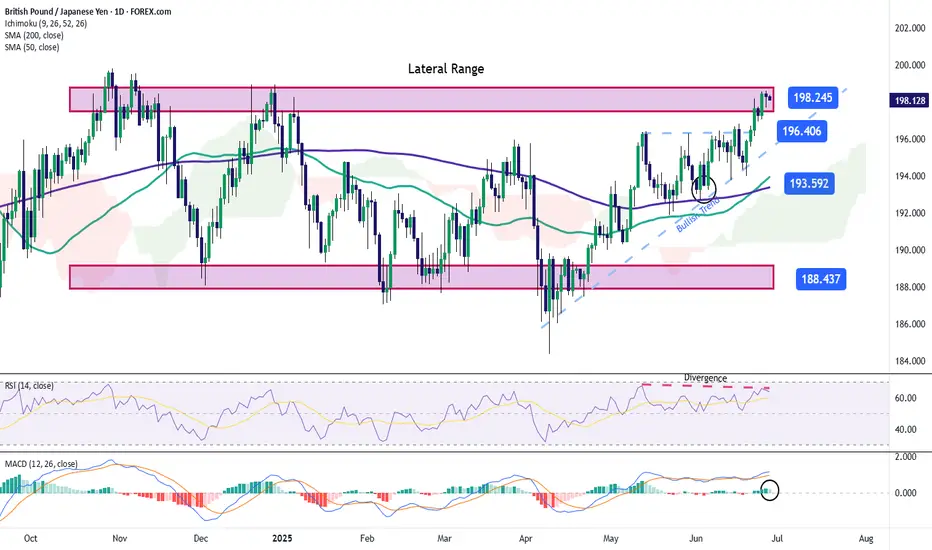
Broad Lateral Range
Although there has been an attempt to establish a short-term uptrend, the broader view on the chart still shows a clear sideways range, and for now, the price must once again face the upper resistance zone of that range to confirm a potential breakout that would establish a stronger bullish bias. Until then, the lateral range remains the dominant structure, particularly while resistance holds firm at the upper boundary around 198.245—a level where some corrective pullbacks may begin to build.
RSI
The RSI indicator has started to show lower highs, while the price continues to print higher highs. This confirms the presence of a bearish divergence, which could open the door for possible downward corrections to emerge on the chart.
MACD
The MACD histogram is hovering close to the neutral zero line, indicating that the average strength of the moving averages is still in a zone of indecision, with no clear dominant momentum. If this situation continues, the current bullish bias may struggle to advance further.
Key Levels to Watch:
198.245 – Major resistance: This level marks the most important resistance on the chart, sitting at the top of the broader lateral range. Sustained bullish momentum above this level could trigger an aggressive buying bias, potentially extending the short-term uptrend.
196.406 – Nearby barrier: A short-term neutral zone, this level may act as a barrier to downward corrections if selling pressure increases.
193.592 – Critical support: This level aligns with the 50- and 200-period moving averages. If selling pressure brings the price back to this zone, it could negate the current bullish trend and give way to a broader sideways channel on the chart.
Written by Julian Pineda, CFA – Market Analyst
GBPJPY Entry: 198.438
2025/06/25 22:52:08
So, I'm a big rambler so I'll try and keep it short.
IM BEAR ROAR
Its tested 196.5-198.6 area 4 times this week and can't break and we tested a new low of the week, hoping to see more downward momentum on the 4hr time frame.
Trading balanceTrading balance The price of the asset has rebounded from the balance zone. With the prospect of growth into the resistance zone.
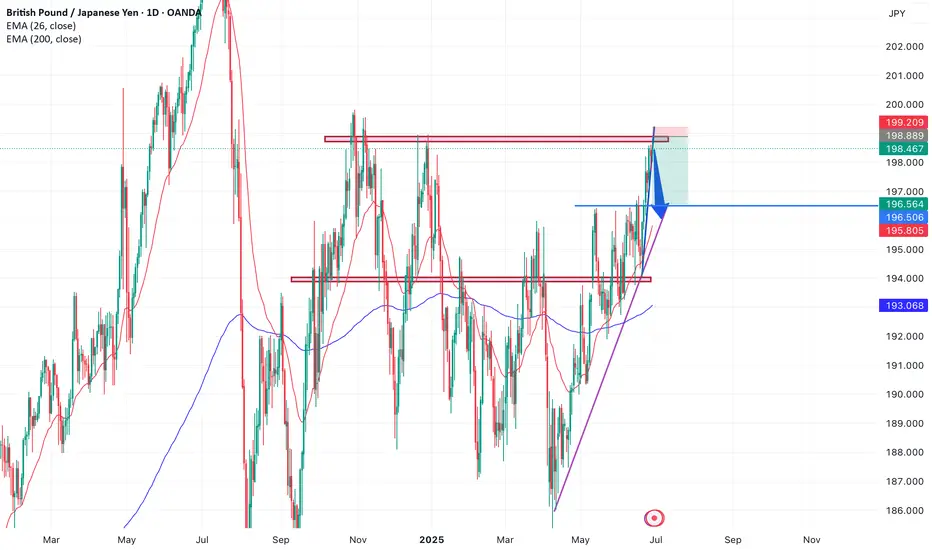
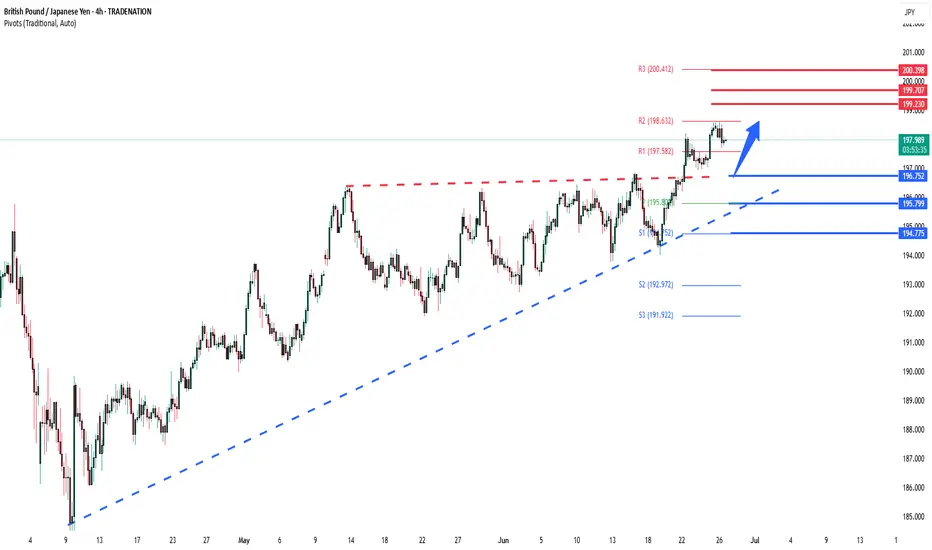
GBPJPY maintains Bullish outlook supported at 196.75
Key Support: 196.75
This level marks the prior consolidation zone and serves as a critical pivot. A corrective pullback toward 196.75 followed by a bullish reversal would validate the uptrend, with upside targets at:
199.20 – Initial resistance and short-term target
199.70 – Minor resistance zone
200.40 – Longer-term breakout objective
However, a daily close below 196.75 would invalidate the bullish scenario, potentially triggering a deeper retracement toward:
195.80 – Near-term support
194.80 – Key downside level in a bearish reversal
Conclusion:
As long as 196.75 holds, the bias remains bullish, favoring continuation toward the 199–200 zone. A confirmed break below this support would shift momentum, opening the door for a broader corrective decline.
This communication is for informational purposes only and should not be viewed as any form of recommendation as to a particular course of action or as investment advice. It is not intended as an offer or solicitation for the purchase or sale of any financial instrument or as an official confirmation of any transaction. Opinions, estimates and assumptions expressed herein are made as of the date of this communication and are subject to change without notice. This communication has been prepared based upon information, including market prices, data and other information, believed to be reliable; however, Trade Nation does not warrant its completeness or accuracy. All market prices and market data contained in or attached to this communication are indicative and subject to change without notice.
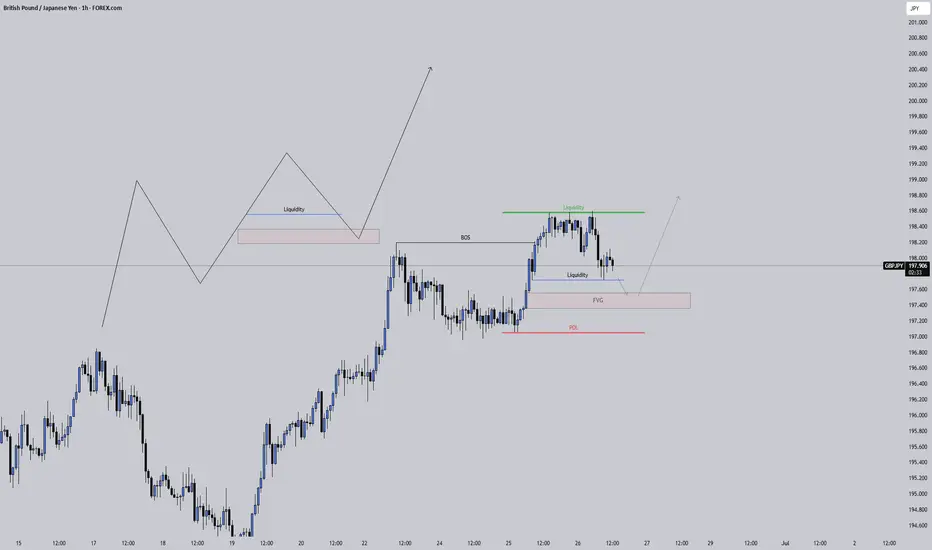
GBPJPY: Let It Come Lower Before It Goes HigherGBPJPY swept the highs, broke structure, and is now giving signs of a clean retracement. There’s a visible FVG just below, and a small liquidity pocket that hasn’t been touched yet.
If price drops into that zone and respects it, we could see a strong bounce that takes us right back into the highs and beyond.
This setup looks like a simple buy-the-dip scenario , but only if the zone reacts cleanly. No rush. Let price come down. Watch for confirmation before thinking long.
Don’t chase it. Let it unfold.
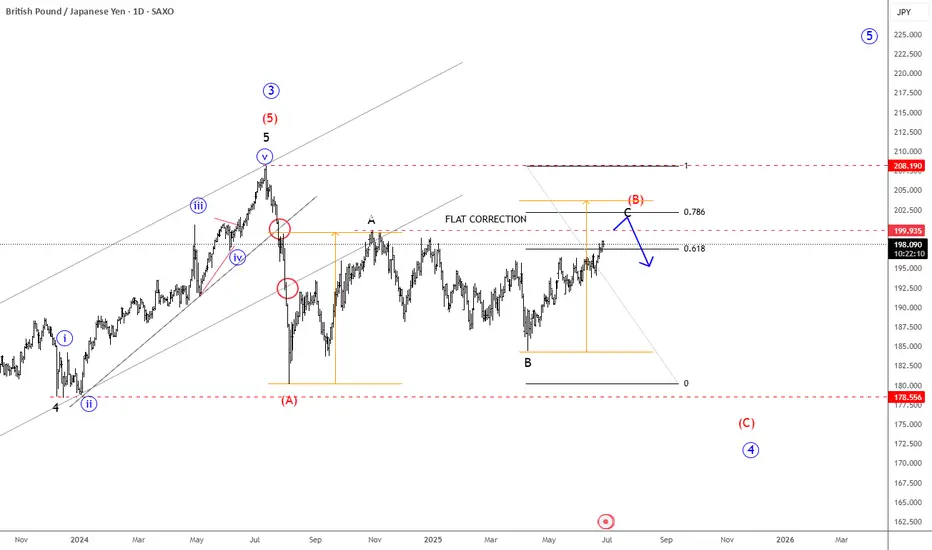
GBPJPY Keeps Recovering, But It’s Approaching ResistanceGBP/JPY is on the rise but is approaching the upper boundary of the 2024–2025 range, which could present strong resistance around the 200 level. Keep in mind that the decline from the 2024 highs to the July lows near 180 was impulsive, while the current rebound appears slow and corrective—possibly a wave B within a flat correction or even part of a triangle formation. In either case, we believe some further sideways price action is likely, followed by a potential downward turn from this prior subwave A resistance zone.
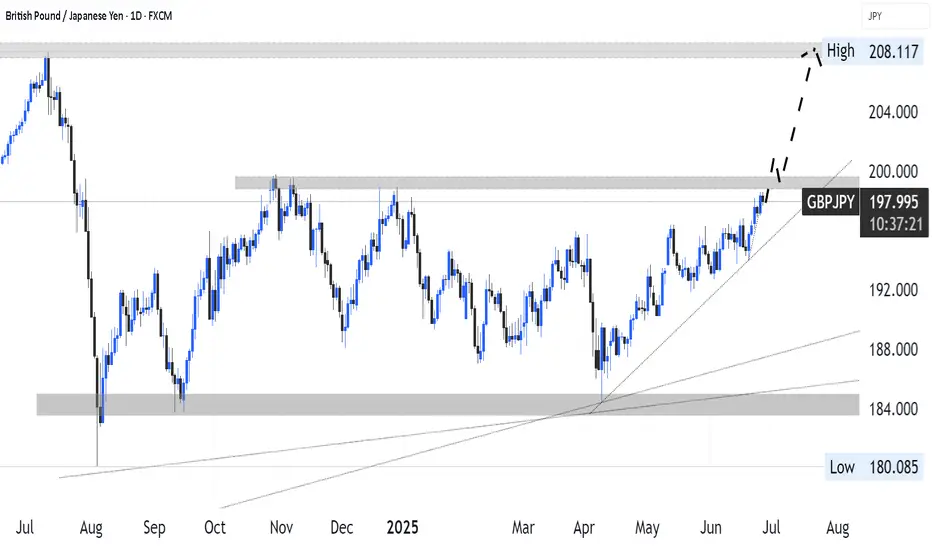
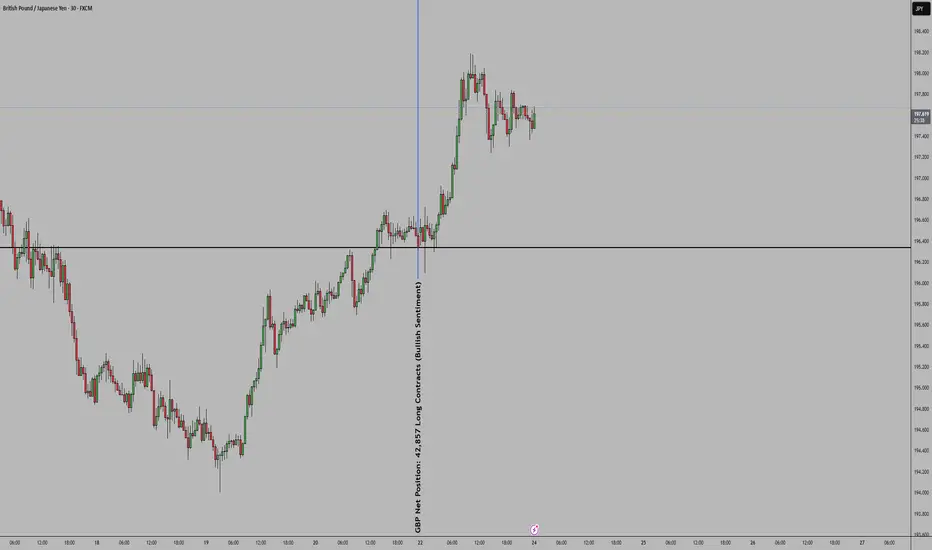
GBPJPYCOT Report: Shows net longs on the GBP, indicating a bullish bias for GBP/JPY as institutional traders expect the GBP to strengthen against the JPY.
Bias: A close above resistance would confirm the bullish bias for GBP/JPY.
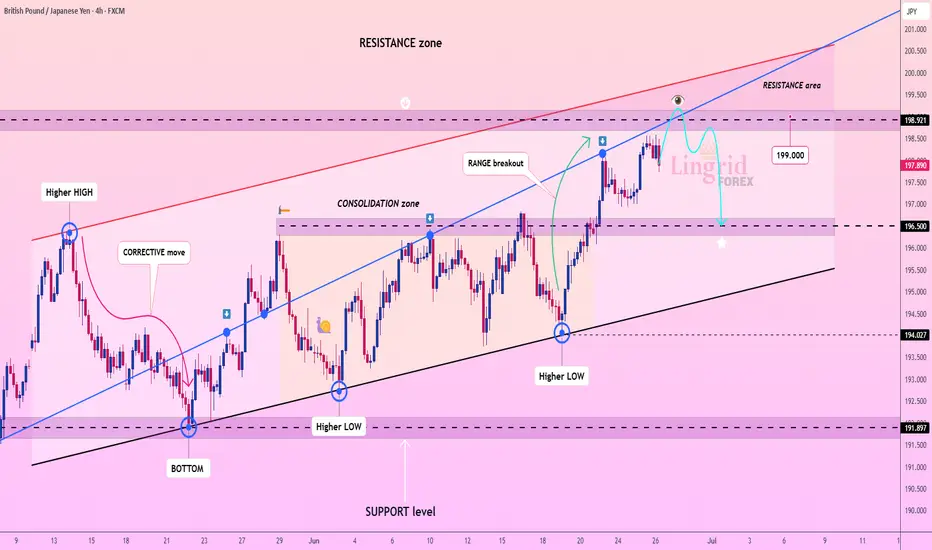
Lingrid | GBPJPY pullback TRADE. Short from RESISTANCE zoneThe market is stalling below the 199 zone after a sharp breakout from the previous consolidation block. Price action remains inside an ascending channel, with the structure posting consistent higher lows and a clean bullish leg. However, the pair is now testing a key resistance area near 198.9, where previous highs and upper trendline pressure may trigger a correction. If rejection follows, a drop toward the 196.5-196.0 region remains likely before any further continuation.
📈 Key Levels
Buy zone: 196.0–196.5
Sell trigger: rejection at 199 resistance
Target: 199.9–200.5
Buy trigger: strong candle close above 199.0
💡 Risks
False breakout above 199 may trap late buyers
Lack of follow-through volume could weaken bullish momentum
Channel support breach may flip structure bearish
If this idea resonates with you or you have your own opinion, traders, hit the comments. I’m excited to read your thoughts!
XAUUSD and GBPJPY Analysis todayHello traders, this is a complete multiple timeframe analysis of this pair. We see could find significant trading opportunities as per analysis upon price action confirmation we may take this trade. Smash the like button if you find value in this analysis and drop a comment if you have any questions or let me know which pair to cover in my next analysis.
