JPYGBP trade ideas
GBPJPY and USDJPY Analysis todayHello traders, this is a complete multiple timeframe analysis of this pair. We see could find significant trading opportunities as per analysis upon price action confirmation we may take this trade. Smash the like button if you find value in this analysis and drop a comment if you have any questions or let me know which pair to cover in my next analysis.

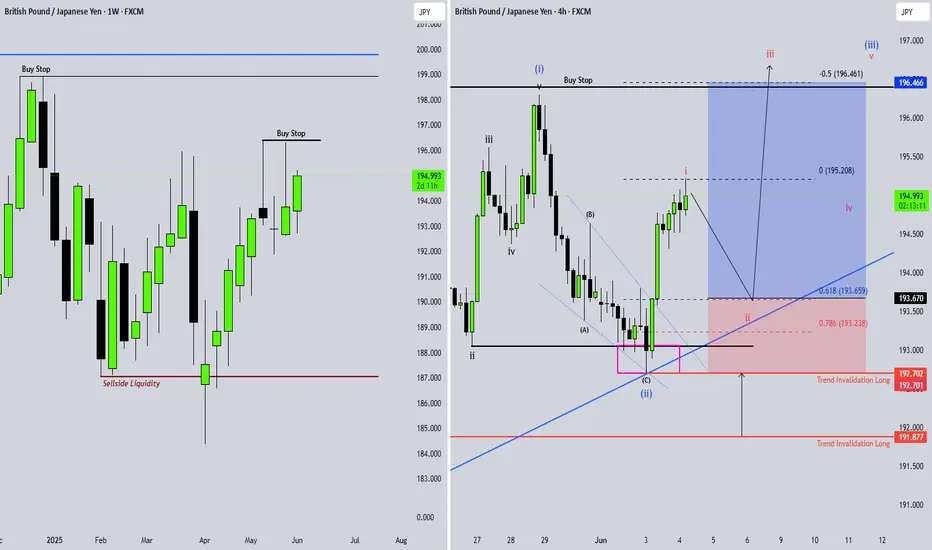
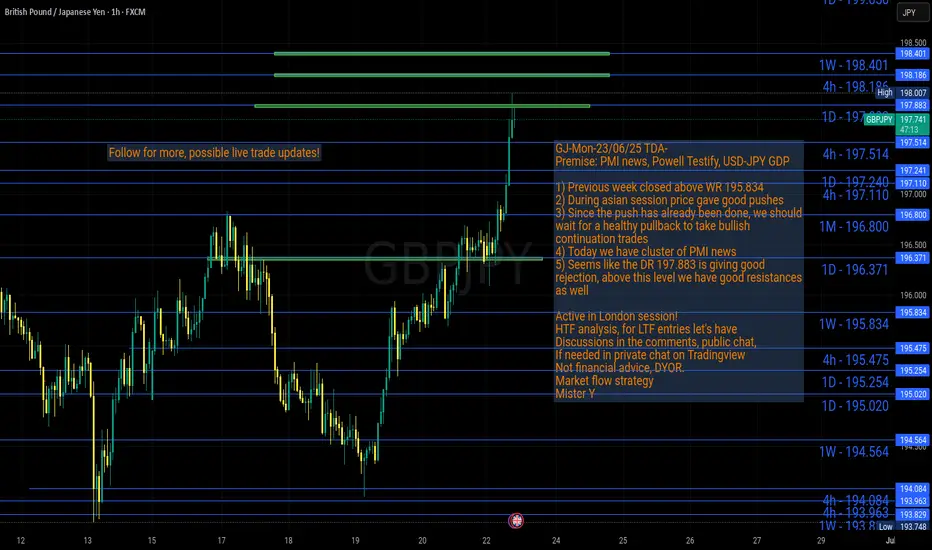
GJ-Mon-23/06/25 TDA-Asian session push, waiting for pullbackAnalysis done directly on the chart
Follow for more, possible live trades update!
Asian session push, if this is not your trading time.
There's nothing you can do to catch good moves,
The best thing we can do now is to wait for healthy
pullback before continuation!
Active in London session!
Not financial advice, DYOR.
Market Flow Strategy
Mister Y
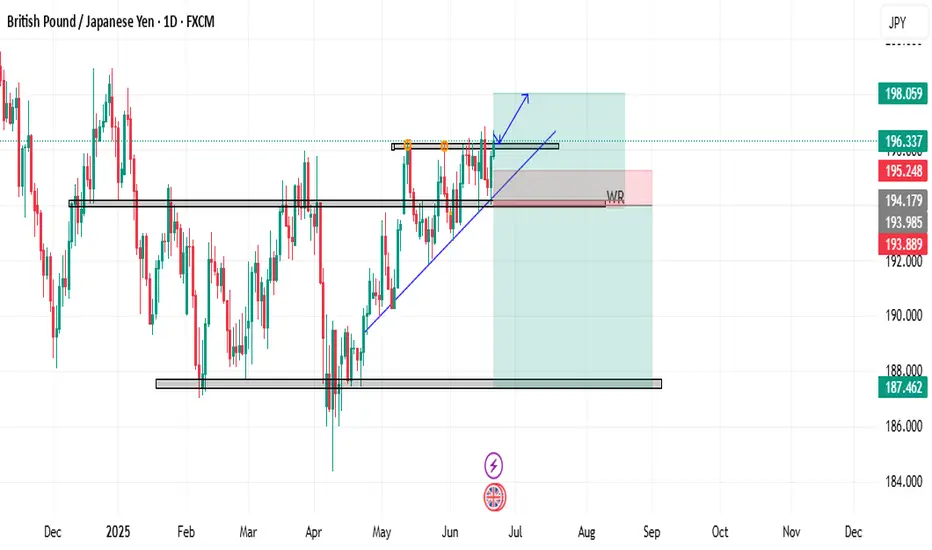
GBP/JPY GBP/JPY has reached a significant level of interest at the 196.260 area on the daily timeframe. From this point, price action could develop in one of two key scenarios:
1) Bullish Continuation: If price breaks above the 196.260 level, confirming continued bullish momentum, I would look for a potential long entry on a successful retest of this zone.
2) Bearish Reversal: Alternatively, if price rejects this key level, I will wait for confirmation of a reversal—such as the formation of lower lows and lower highs, supported by classic reversal patterns like a head and shoulders or double top, alongside a trendline break—before considering a short position.
I will continue to monitor GBP/JPY closely over the coming sessions to assess how price reacts at this critical area.
Bullish ContinuationI am expectating bullish cont. structure to remain bullish and continue higher from this area of demand zone below the breakout.
GBPJPY and the Different PatternsIn this pair, there is a possibility to open a long position.
When analyzing the pair on higher time-frames, using a 45-period exponential moving average and two simple moving averages of 70 and 95 periods, supported by a Parabolic SAR, an opportunity to enter a buy position is identified.
On the daily time-frame, there is a possibility that the pair is forming an ascending triangle continuation pattern, and it is from this pattern that the buy entry is anticipated.
Despite the points mentioned above, the trade was planned on the 5-minute time-frame through the creation of a rectangle, where the position size was studied. Subsequently, on the 1-hour and 4-hour time-frames, a triangle was outlined to confirm the upward movement.
However, it is important to emphasize that, despite the technical analysis presented, it is essential to monitor news, economic data, and other factors that may influence this pair, as this analysis is based exclusively on technical criteria.
The long position tool displayed on the chart serves only as additional support for the trade entry.
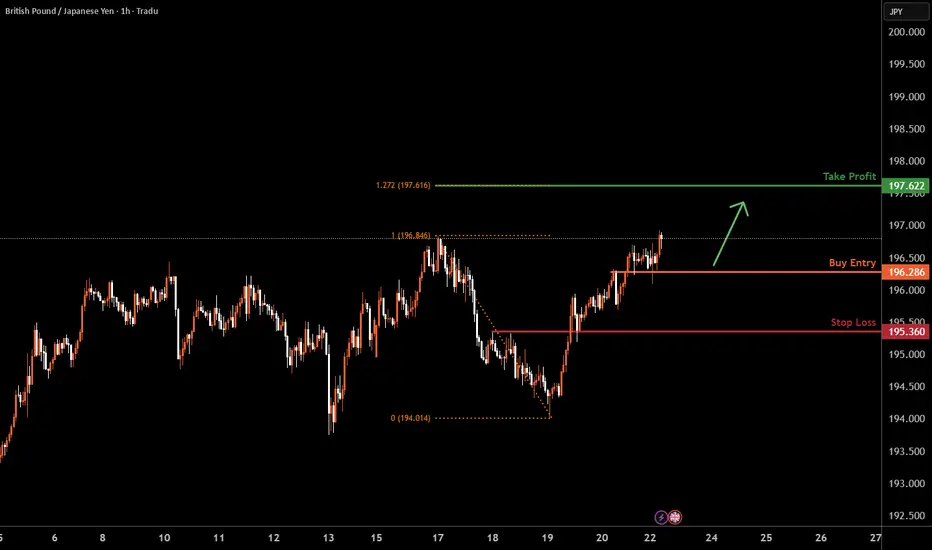
GBPJPY H1 I Bullish Bounce OffBased on the H1chart analysis, the price is approaching our buy entry level at 196.28 a pullback support.
Our take profit is set at 197.62, aligning with the 127.2% Fib extension.
The stop loss is placed at 195.36, an overlap support.
High Risk Investment Warning
Trading Forex/CFDs on margin carries a high level of risk and may not be suitable for all investors. Leverage can work against you.
Stratos Markets Limited (tradu.com ):
CFDs are complex instruments and come with a high risk of losing money rapidly due to leverage. 63% of retail investor accounts lose money when trading CFDs with this provider. You should consider whether you understand how CFDs work and whether you can afford to take the high risk of losing your money.
Stratos Europe Ltd (tradu.com ):
CFDs are complex instruments and come with a high risk of losing money rapidly due to leverage. 63% of retail investor accounts lose money when trading CFDs with this provider. You should consider whether you understand how CFDs work and whether you can afford to take the high risk of losing your money.
Stratos Global LLC (tradu.com ):
Losses can exceed deposits.
Please be advised that the information presented on TradingView is provided to Tradu (‘Company’, ‘we’) by a third-party provider (‘TFA Global Pte Ltd’). Please be reminded that you are solely responsible for the trading decisions on your account. There is a very high degree of risk involved in trading. Any information and/or content is intended entirely for research, educational and informational purposes only and does not constitute investment or consultation advice or investment strategy. The information is not tailored to the investment needs of any specific person and therefore does not involve a consideration of any of the investment objectives, financial situation or needs of any viewer that may receive it. Kindly also note that past performance is not a reliable indicator of future results. Actual results may differ materially from those anticipated in forward-looking or past performance statements. We assume no liability as to the accuracy or completeness of any of the information and/or content provided herein and the Company cannot be held responsible for any omission, mistake nor for any loss or damage including without limitation to any loss of profit which may arise from reliance on any information supplied by TFA Global Pte Ltd.
The speaker(s) is neither an employee, agent nor representative of Tradu and is therefore acting independently. The opinions given are their own, constitute general market commentary, and do not constitute the opinion or advice of Tradu or any form of personal or investment advice. Tradu neither endorses nor guarantees offerings of third-party speakers, nor is Tradu responsible for the content, veracity or opinions of third-party speakers, presenters or participants.
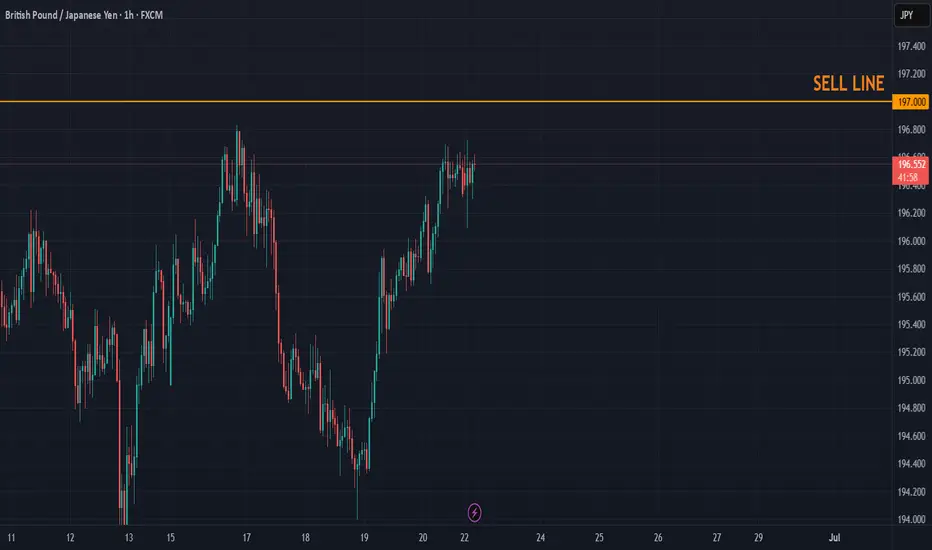
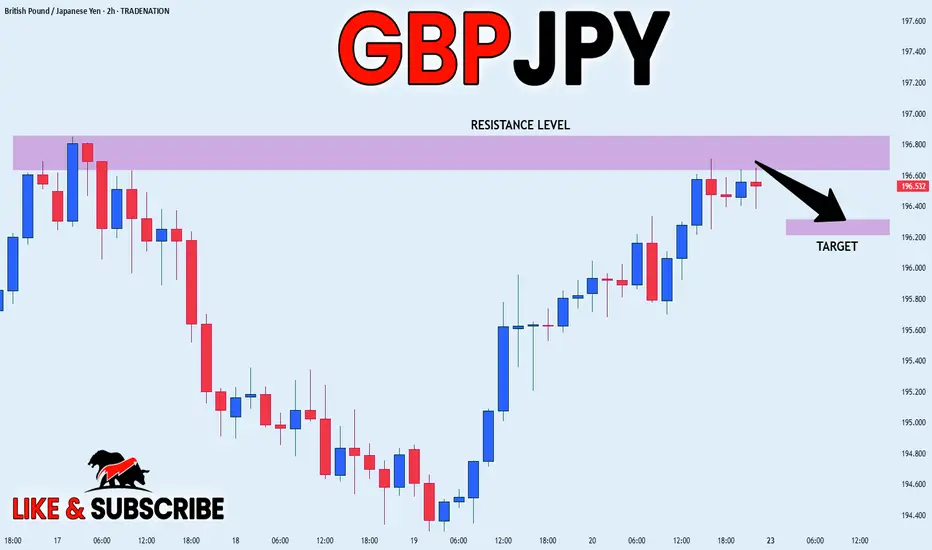
POSSIBLE SELL OPPORTUNITY ON GBPJPYPrice has been moving up for some time and is about to encounter a level of supply. This level coincides with a psychological level which increases the probability of a successful sell trade!
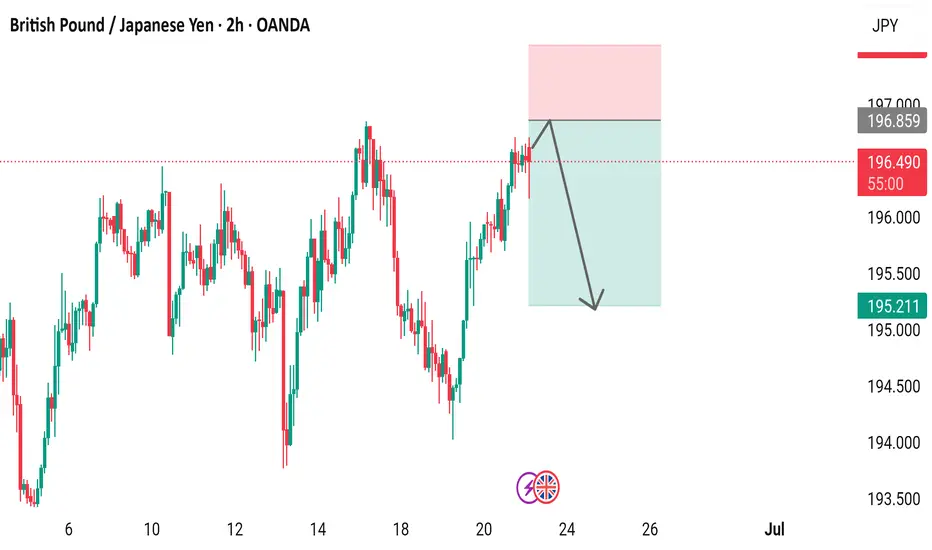
GBP/JPY 2-Hour Chart - OANDA2-hour price movement of the British Pound (GBP) against the Japanese Yen (JPY) from OANDA, showing a current value of 196.248 with a slight decrease of 0.256 (-0.13%). The chart includes candlestick patterns, a highlighted resistance zone (pink), and a support zone (cyan), with key levels marked at 197.016, 196.348, 195.002, and 194.000. The time frame spans from June 6 to July 3, 2025.
GBP JPY H_4 Short OpportunityGBP/JPY is overbought, and I expect a pullback to the price level 195.000.
Good Luck
GBP/JPY in Trouble? Smart Money Rotates Into Yen📊 1. COT Analysis
JPY (Japanese Yen):
Non-Commercial Net Long: +54,615 – showing strong long accumulation since March.
Recent Changes:
Long: -5,319
Short: +1,235
➡️ Mixed signals short-term, but overall net long positioning remains strong. Speculative funds are still heavily favoring the Yen, suggesting potential continued strength.
GBP (British Pound):
Non-Commercial Net Long: +51,634 (111,076 long – 59,442 short)
Recent Changes:
Long: +7,404
Short: -9,015
➡️ Specs are still net long on GBP, but exposure has slightly decreased. The divergence with the Yen is narrowing.
🔎 COT Summary:
Both currencies are being bought by speculators, but the JPY has shown more consistent long-term positioning. Net momentum appears to shift in favor of Yen strength, pointing to potential downside for GBP/JPY.
📅 2. Seasonality – June
Historically, June is a weak month for GBP/JPY, especially over 20y, 15y, 5y, and 2y windows.
Monthly average return is negative across all major historical timeframes (e.g. -1.2415 over 10 years).
➡️ Seasonality reinforces a bearish bias for June.
🧠 3. Retail Sentiment
Short: 52%
Long: 48%
➡️ Retail positioning is balanced, slightly skewed short. Not a strong contrarian signal, but also doesn’t support a bullish breakout scenario.
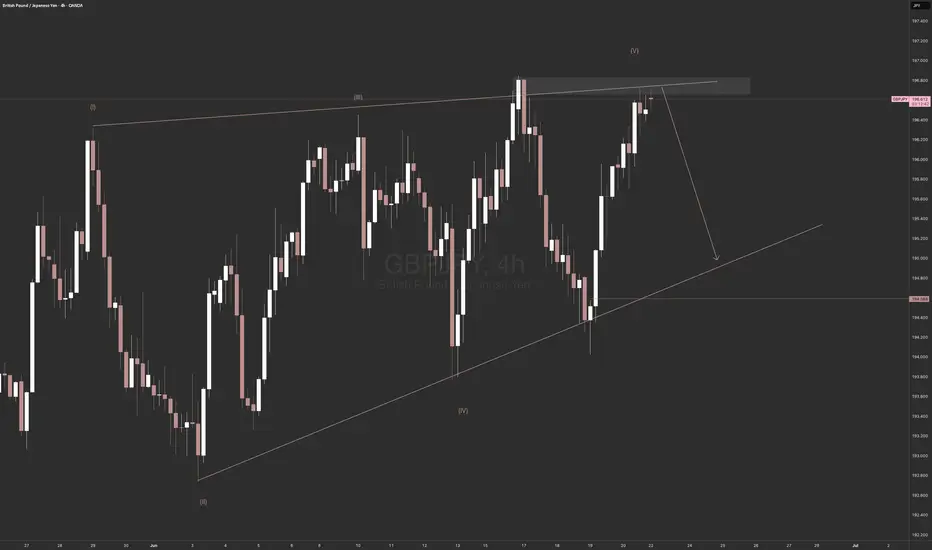
📉 4. Technical Analysis
Current Structure: Ascending channel from mid-May → currently testing lower boundary.
Key Zone: 195.600–196.520 is a major supply zone with multiple rejections.
Recent Candle Action: Bearish pin bar + engulfing candle → strong rejection from resistance.
Downside Targets:
First: 193.076
Second: 191.439
Break of the channel would further confirm a trend reversal.
➡️ Price action supports a short scenario with high reward-to-risk toward lower zones.


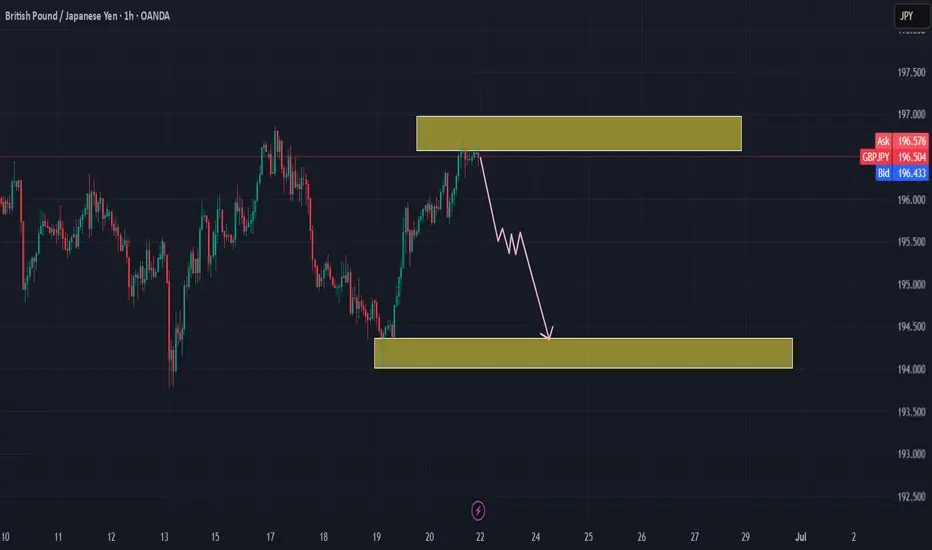
SELL GBPJPYGBP/JPY is showing signs of exhaustion at a key resistance zone (196.600–197.000).**
If bearish confirmation appears, a short opportunity may emerge targeting 194.000–194.500, which is a strong demand area. Watch closely for bearish price action and structure breaks to confirm your setup. Protect your position with a stop above 197.000 if you take the short.
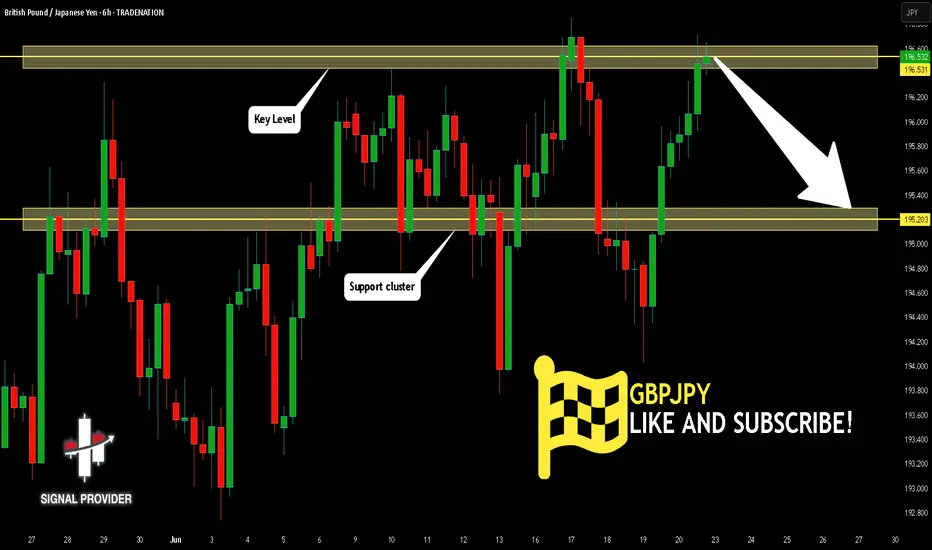
GBPJPY Will Go Lower! Short!
Here is our detailed technical review for GBPJPY.
Time Frame: 6h
Current Trend: Bearish
Sentiment: Overbought (based on 7-period RSI)
Forecast: Bearish
The market is approaching a significant resistance area 196.531.
Due to the fact that we see a positive bearish reaction from the underlined area, I strongly believe that sellers will manage to push the price all the way down to 195.203 level.
P.S
Overbought describes a period of time where there has been a significant and consistent upward move in price over a period of time without much pullback.
Disclosure: I am part of Trade Nation's Influencer program and receive a monthly fee for using their TradingView charts in my analysis.
Like and subscribe and comment my ideas if you enjoy them!
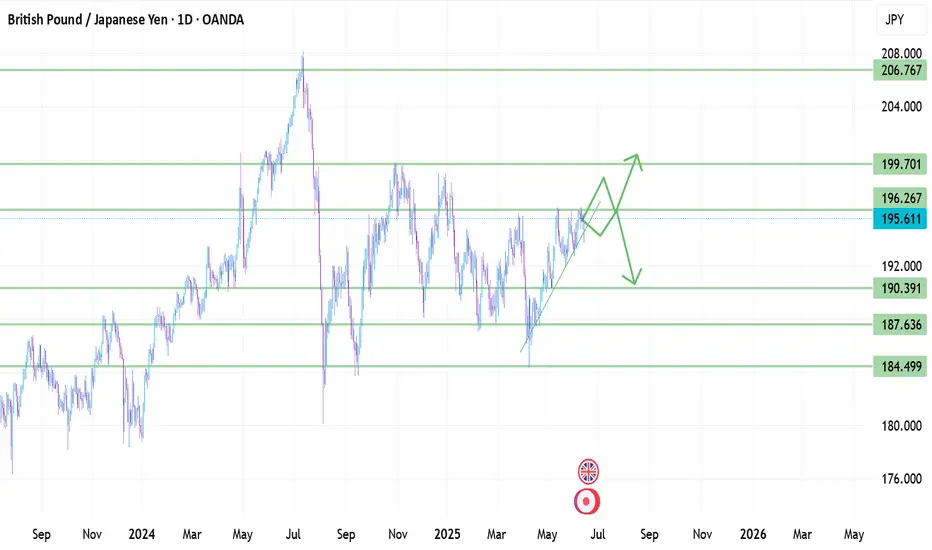
GBPJPY hinting of a weighty 3k pip rise from 195.0. /\GBPJPY has always been resilient for the past 5 years as far its upward trajectory goes -- registering only 3 technical corrective phase since March of 2020 -- then proceeding for further price growth every after corrective seasons.
After touching its parabolic high of 208, pair hibernated healthily back to demand zone to 0.5 fib levels.
Now, the pair is on its 3rd corrective phase since 2020 which has started last July 2024.
Based on our diagram above, this month June 2025 it finally registered its first bear clearance in more than 2 years - conveying of a massive shift in trend. last time this signal surfaced was on April 2023, which has produced a 3000 pips rise thereafter.
Expect some significant ascend series from hereon pricewise after this major shift.
The north journey has started during its low retest of 0.5 FIB levels at 180.0 price zone -- now, already up 1600 pips from that price tap.
This 0.5 fib retest has been historically been a strong support for GBPJPY. This is where most buyers converge based on long term metrics.
More price growth is expected in the next few weeks with weighty targets up there (about 3k pips). Its not overnight but you know the directional context.
Spotted at 195.0
Mid Target previous peak at 208.0
Long term target: 225.

GBP_JPY SHORT FROM RESISTANCE|
✅GBP_JPY is going up now
But a strong resistance level is ahead at 196.859
Thus I am expecting a pullback
And a move down towards the target of 196.322
SHORT🔥
✅Like and subscribe to never miss a new idea!✅
Disclosure: I am part of Trade Nation's Influencer program and receive a monthly fee for using their TradingView charts in my analysis.
GBPJPY BUY IDEA- This is a continuation of the buy trade last week. The price has broken above the major resistance on the H4 chart and is now slightly above the previous high on the daily chart.
- We're looking at a retest of the broken resistance for entries for further buys.
For those who missed my previous analysis on it, please revert to my previous idea on GBPJPY buys.
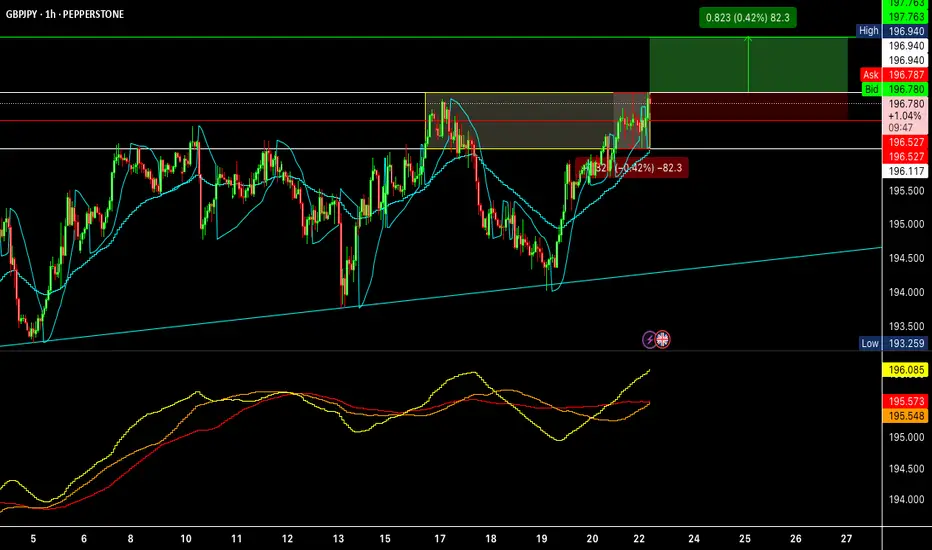
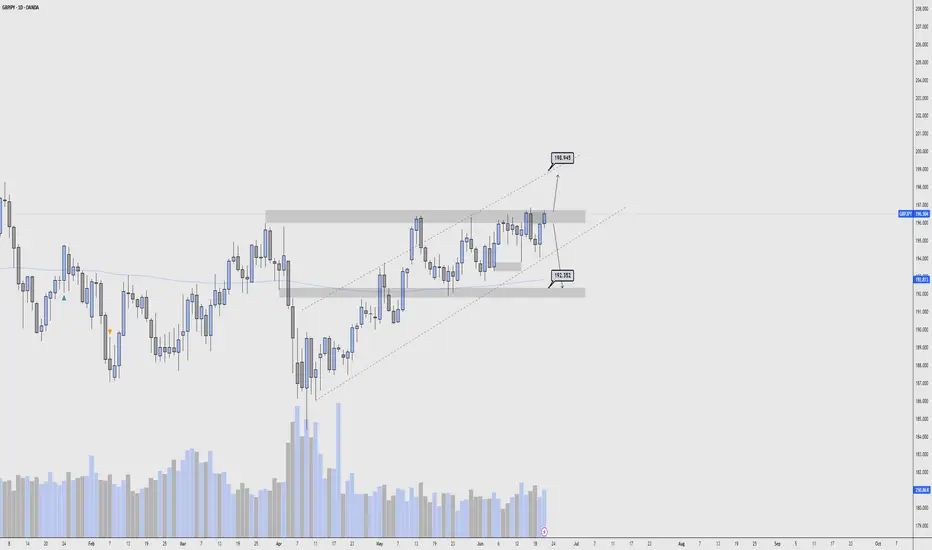
GBP/JPY - Breakout Brewing📊 GBP/JPY – Breakout Imminent?
Price is testing key resistance at the top of the range within this ascending channel.
We’re now at a critical decision point:
📈 A clean breakout above this supply zone could send us flying toward the 198.945 target – aligning with the channel top.
📉 A rejection, however, could trigger a drop back into demand at 192.352, offering a solid buy zone for continuation.
🧠 Patience is key here — wait for confirmation. Either way, volatility is expected next. Be ready. 🚨
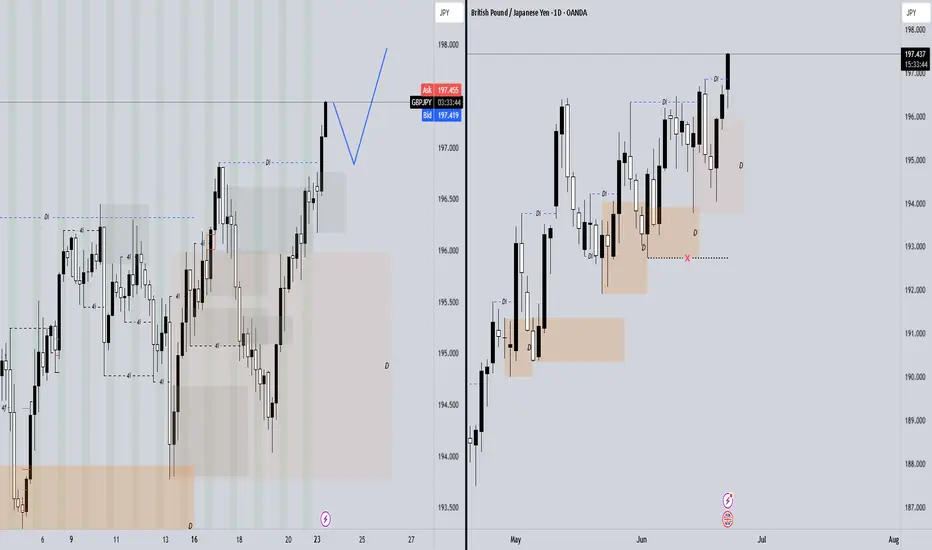
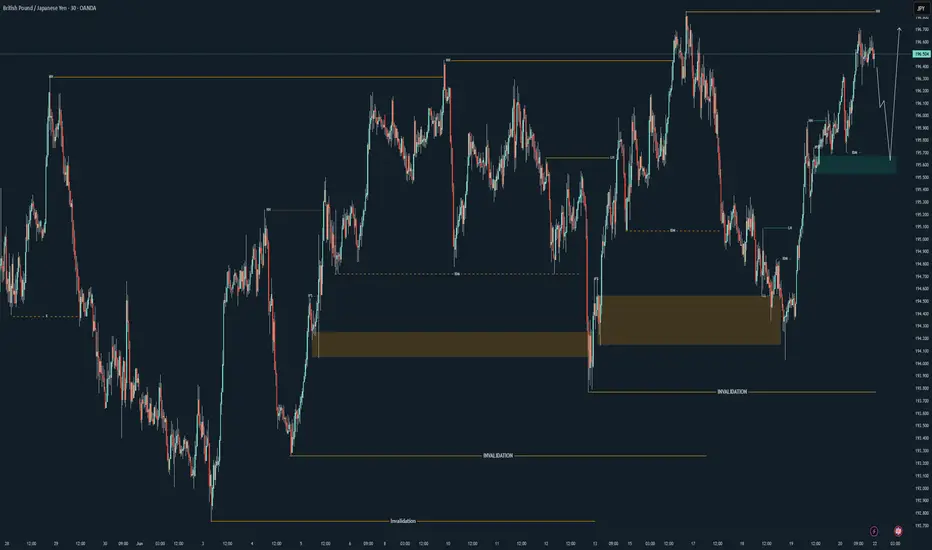
*GBPJPY Weekly Breakdown - Structure + PrecisionThis week, GJ moved exactly how it was supposed to—clean structure, proper mitigation, and follow-through.
Price respected the bullish flow all week, tapping into a refined 30M order block (green zone) before lifting off. That zone did its job—mitigated, held, and set the tone for the next leg up. No need to force anything here—just fundamentals and execution.
We’re still holding higher lows, and unless structure says otherwise, I’m expecting continuation next week with a clean break of those highs.
Simple reads. Clean execution.
This is how we do it. 😉
Bless Trading!
GBPJPY Bullish Move
Monthly Chart
Price respected the Major QP (190.00)
Price also formed a Triple Bottom
The previous monthly candle ended as a bullish engulfing
Short MAs are above Longer MAs and price is above both
Sentiment - Look for buys
Weekly Chart
Price found support at he weekly zone and made a bullish push
Price then sold off (retracement) and respected the 38.2 Fib Level and Minor AQ (192.5) before continuing the bullish trend
The price of the previous candle met resistance at the trend line & sold off but ultimately closed respecting the Minor QP (195.000).
This weeks candle found bullish support and closed bullish engulfing
Sentiment - Look for buys
Daily Chart
Price retraced and found support at the 50.0 Fib Level - confirming bullish trend continuation
Expecting price to continue bullish and test the 0.27 Fib, which also aligns with the Daily Supply Zone & Minor AQ (197.500).
Will look to enter long on lower time frame - 1H/2H
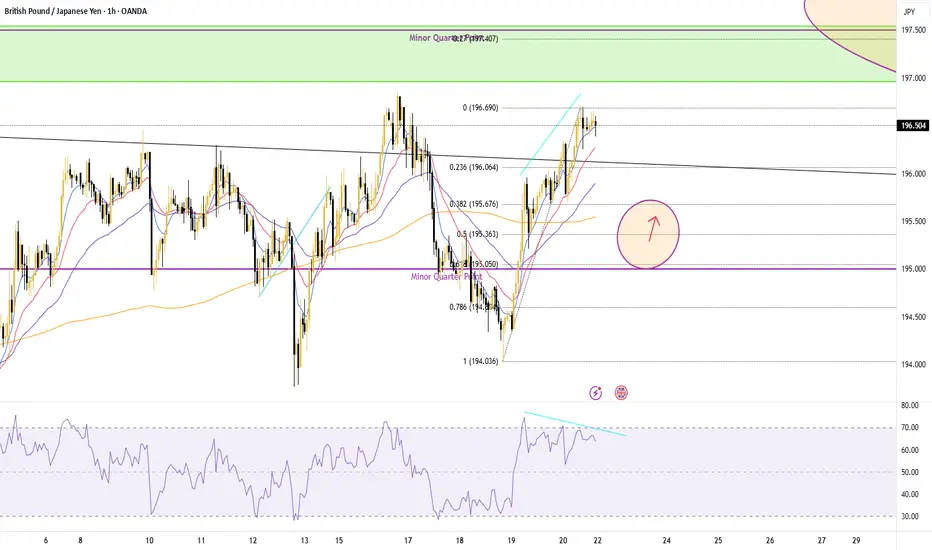
1 Hour Chart
Based on the RSI - a bearish divergence is present signaling some bearish pressure
This algins with the daily TF, as I am looking to enter long after a minor retracement on this timeframe.
Expecting to enter a long position near the 50.0-61.8 Fib area.
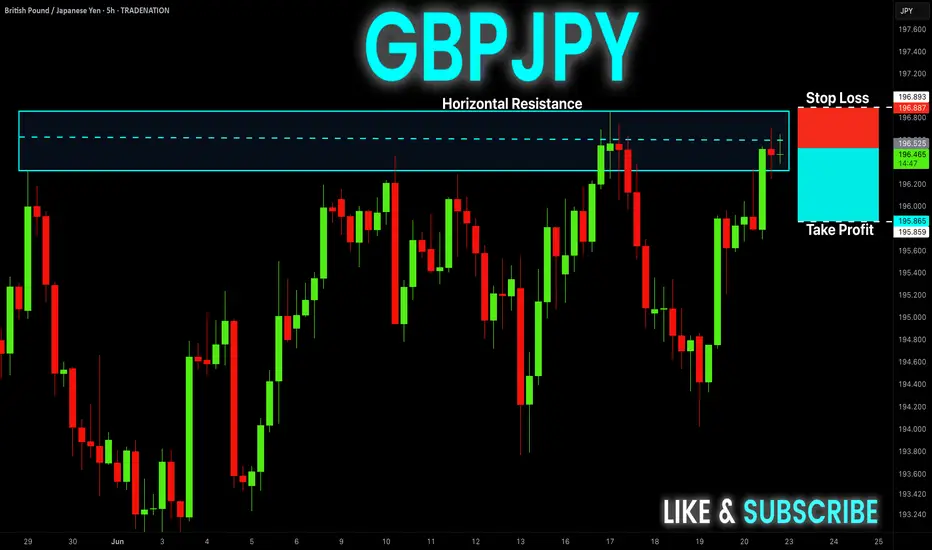
GBP-JPY Free Signal! Sell!
Hello,Tra ders!
GBP-JPY is retesting a
Horizontal resistance
Around 196.700 and
We will be expecting a
Bearish pullback so we
Can enter a short trade
With the Take Profit
Of 195.865 and the
Stop Loss of 196.887
Sell!
Comment and subscribe to help us grow!
Check out other forecasts below too!
Disclosure: I am part of Trade Nation's Influencer program and receive a monthly fee for using their TradingView charts in my analysis.
GBPJPY bllishFirst impulse after the correction in wave 2, the first impulse jumps, I expect a pullback to continue the upward trend