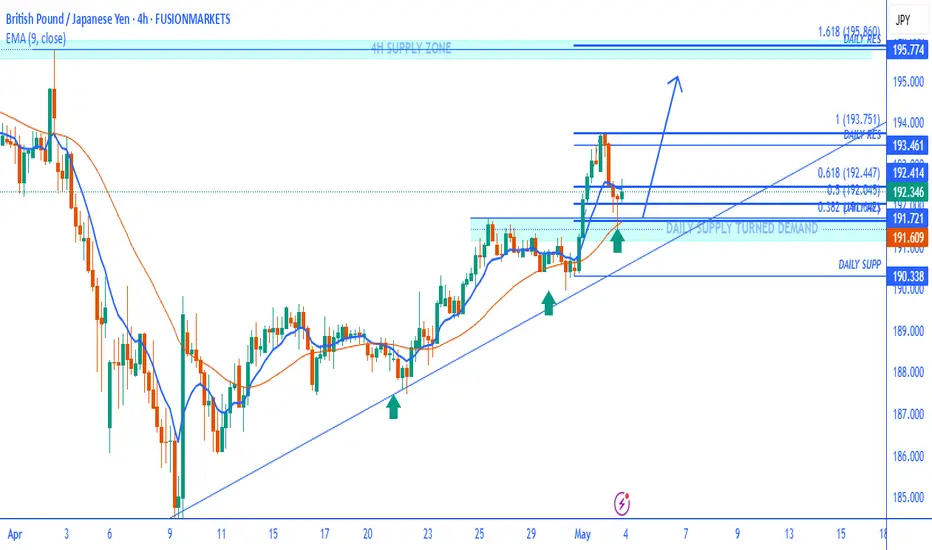
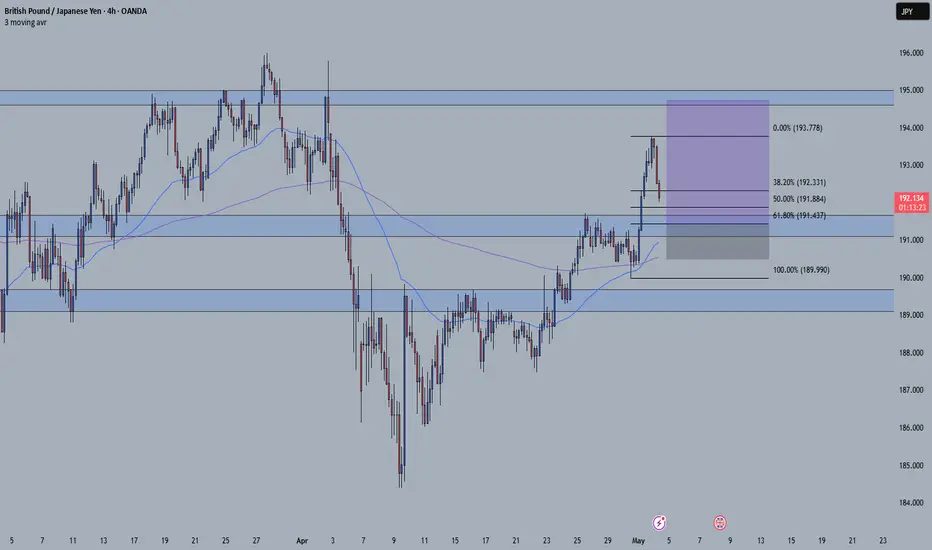
GBPJPYThis 4-hour chart of GBP/JPY shows a bullish continuation bias, supported by market structure and key technical levels. Here’s a breakdown of the analysis:
Technical Breakdown
1. Trendline Support:
The ascending trendline has been respected multiple times (green arrows), indicating a strong uptrend.
The most recent test near 191.60 shows price reacting positively, aligning with a possible continuation.
2. EMAs:
EMA(9) and EMA(21) are sloping upwards.
Price is currently hovering around the EMAs, hinting at a potential bounce from dynamic support.
3. Fibonacci Retracement Levels:
Pullback has landed between:
0.382 (~192.13)
0.618 (~192.44)
These levels overlap with a "Daily Supply Turned Demand" zone, making it a strong confluence for a bullish reaction.
4. Support/Resistance Zones:
Daily Support Turned Demand: ~191.70
Daily Resistance: ~193.75
Next Major Target: ~195.77 (1.618 fib extension and Daily Resistance)
📈 Projected Move (Blue Arrow Path):
Price may bounce from the current demand zone (around 191.60–192.40).
Potential upside target is 195.77, assuming price breaks above 193.75 with momentum.
A failure to hold above the trendline and 191.60 zone could shift the bias short, possibly targeting 190.33.
✅ Summary:
The chart favors bullish continuation as long as price respects the ascending trendline and the ~191.60 support area. Entry near this zone with confirmation offers a good risk-to-reward opportunity toward 195.77.
JPYGBP trade ideas
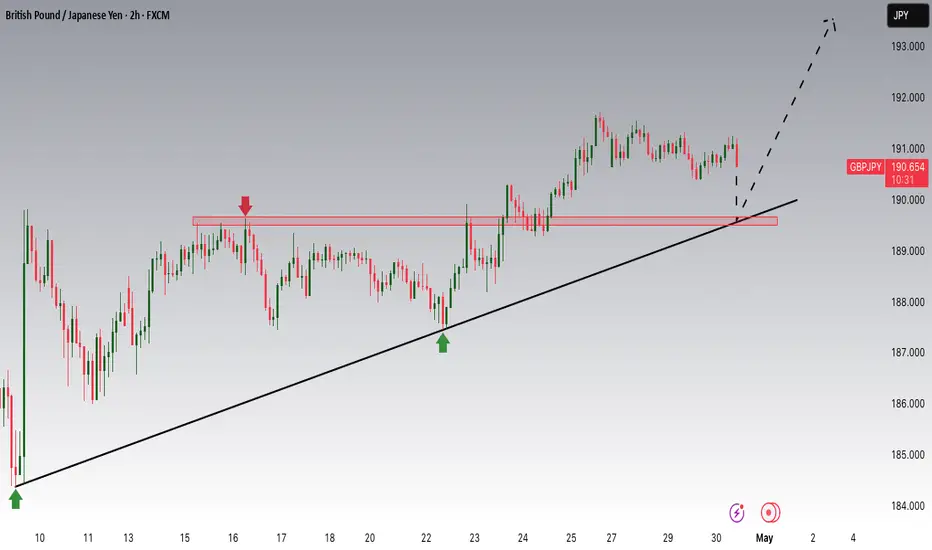
GBPJPY will form higher highBased on Friday candle price action, this pair is likely to form a higher high in my opinion.
Any dip is an opportunity to buy.
do your own risk & reward calculation.
Good Luck
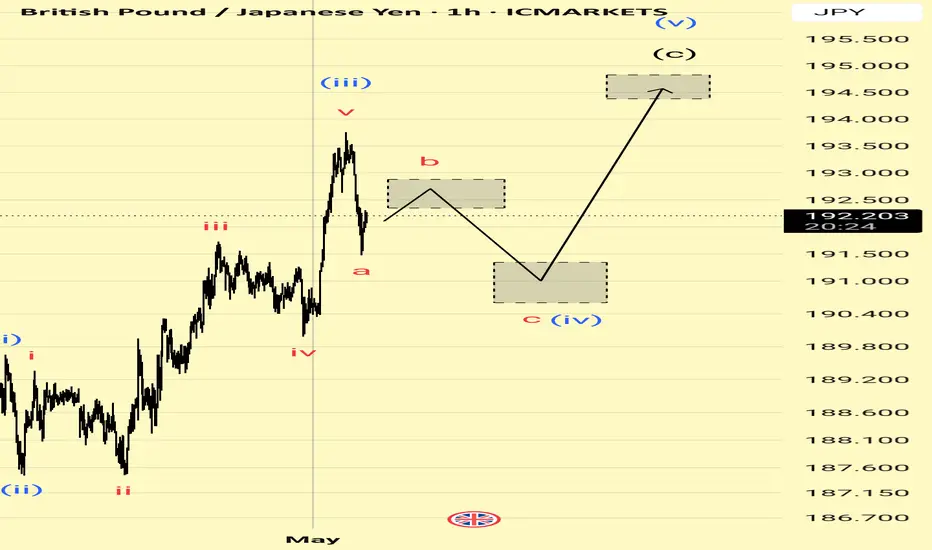
Wave Count Suggests One More Push Higher Toward 196GBPJPY is unfolding a clear 5-wave impulsive structure from the April low. Current price action suggests we are in a wave (iv) correction of the larger wave (C). The substructure shows:
Wave (i), (ii), (iii) are complete
Wave (iv) is developing as an ABC flat or zigzag
Wave (v) still expected to complete wave (C) higher
What to Watch:
The correction may dip toward the 190.50–189.50 support zone before completing wave (c) of (iv)
From there, potential bullish continuation toward 196.00 to complete wave (v) of (C)
Trade Idea (Not Financial Advice):
If price confirms a reversal from the lower support box, long entries could target the upper box near 196.00. Invalidation would be a break below the April low.
#ElliottWave #GBPJPY #ForexAnalysis #WaveCount #JPY #GBP #ICMarkets
GBPJPY – Breakout Buy Setup (Macro Alignment)GBPJPY long setup backed by rising LEI, strong macro trend, JPY weakness, and bullish seasonal window approaching after April 24.
Waiting for breakout confirmation above resistance to validate entry.
🧠 Macro + Model Alignment
LEI score rising → 33 (April), macro outlook improving
Exo+LEI = 1153 → strong bullish signal
JPY COT: Overbought → reversal risk
GBP fundamentals outperform JPY across April
Seasonality: GBP bearish till April 24, then bullish into month-end
📌 Best entry window = April 25+
📊 Technical Setup – 1H Chart
Price testing key resistance zone ~190.00
Watching for breakout & candle close above resistance for confirmation
Clear R:R with defined structure zones
📥 Entry: Break and close above 190.284
⛔ Stop Loss: 187.414
🎯 Take Profit: 192.608
🧮 R:R ≈ 1:2+
Confirmation required before entry ✅

GBP/JPY LONG GBP/JPY LONG " break of a resistance area and retest it + 61.8% fib retracement + 50 ema dynamic support "
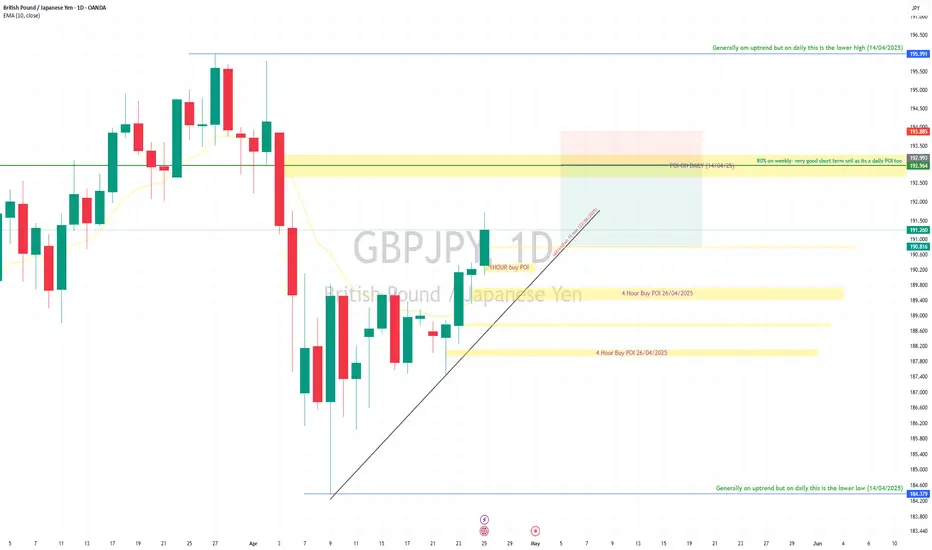
GBPJPY SHORT TERM SELL around 192.964GBPJPY is currently in an overall long trend, but remains highly volatile.
My Point of Interest (POI) is 192.964, based on the following:
1. It aligns with a daily short-term POI as of today.
2. It represents the 80% retracement level of the weekly range, which falls within the daily POI zone.
Given this, I’ll be looking to enter a short term sell position around 192.964, with my stop loss set just above the daily high and my first take profit (TP) target around the 191.500 level.
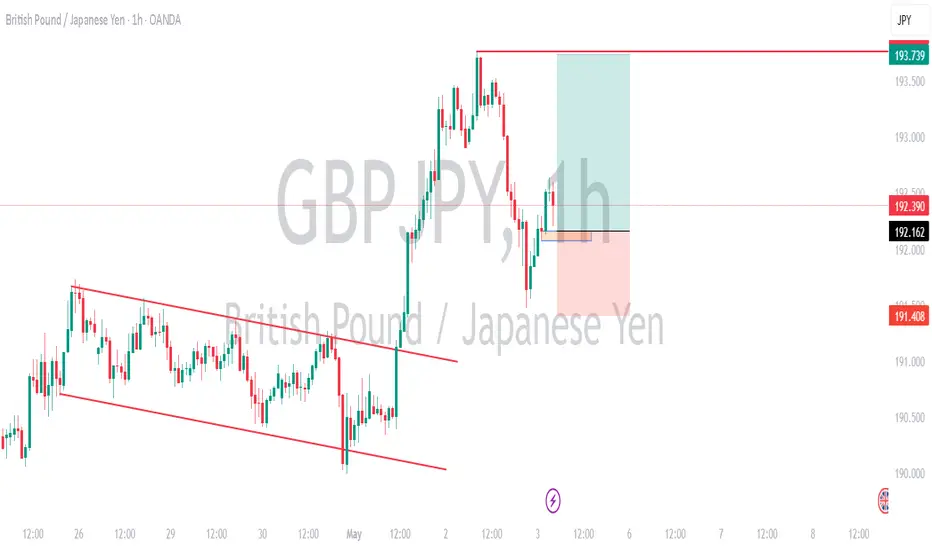
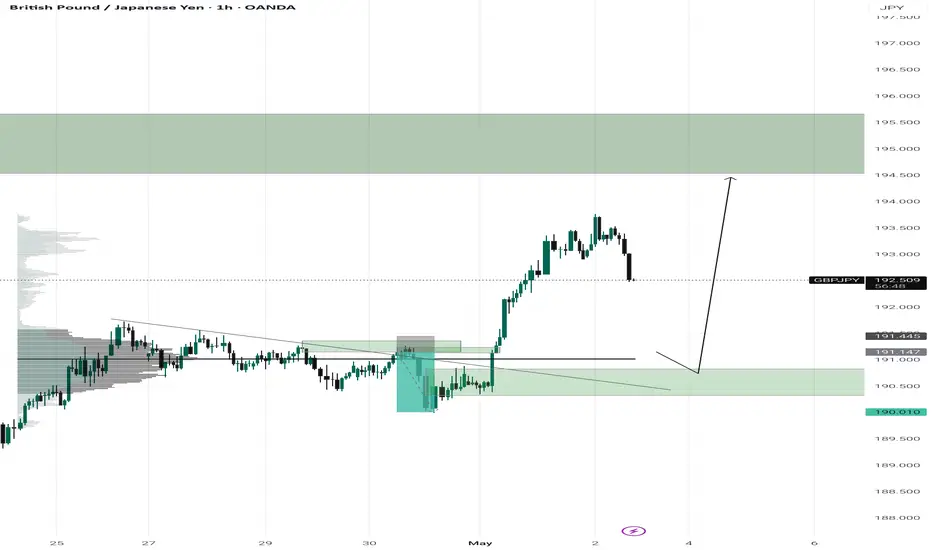
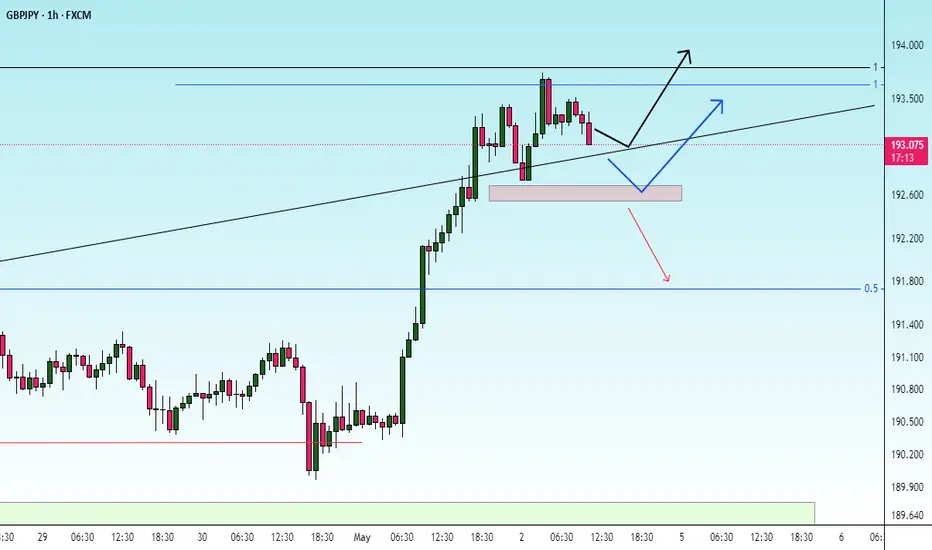
GBPJPY Breakout Play: Will the Retest Fuel the Next Rally?
GBPJPY recently broke out of a descending trendline and resistance zone, fueling a strong bullish move past 193. With momentum slowing, price is now pulling back — setting up a textbook retest opportunity.
Key Zones:
Breakout Support / Demand Zone: 190.500–191.150
Price to Watch: 191.147 — potential retest and bounce zone
Next Target: 194.500–195.000 supply area
Scenarios in Focus:
1. Bullish Retest: A clean bounce from the 190.5–191.1 demand zone could trigger a strong continuation toward 195.
2. Deeper Pullback: A break below 190.5 would invalidate the bullish structure in the short term.
Volume profile shows heavy accumulation below, adding confluence to the support. Patience is key — wait for bullish confirmation around 191.
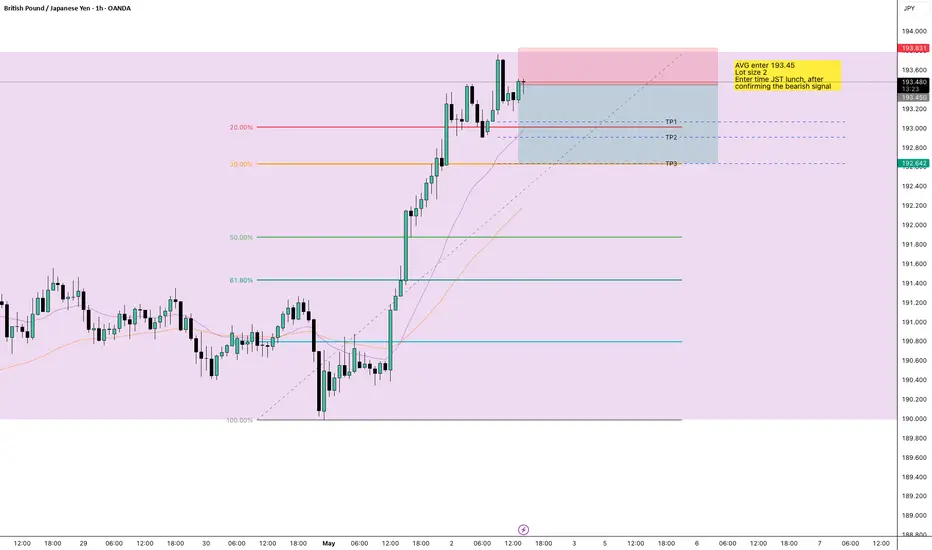
GBPJPY: TGIF setup 2Clear Fibonacci retracement confluence.
Visible signs of exhaustion, but slightly less immediate bearish confirmation. Good candidate for a careful and controlled entry.
#propfirm #100K
correctionA correction to the specified support zones is expected, then there is a possibility of continuing the upward trend. A break of the red support zone will cause a continuation of the downtrend.
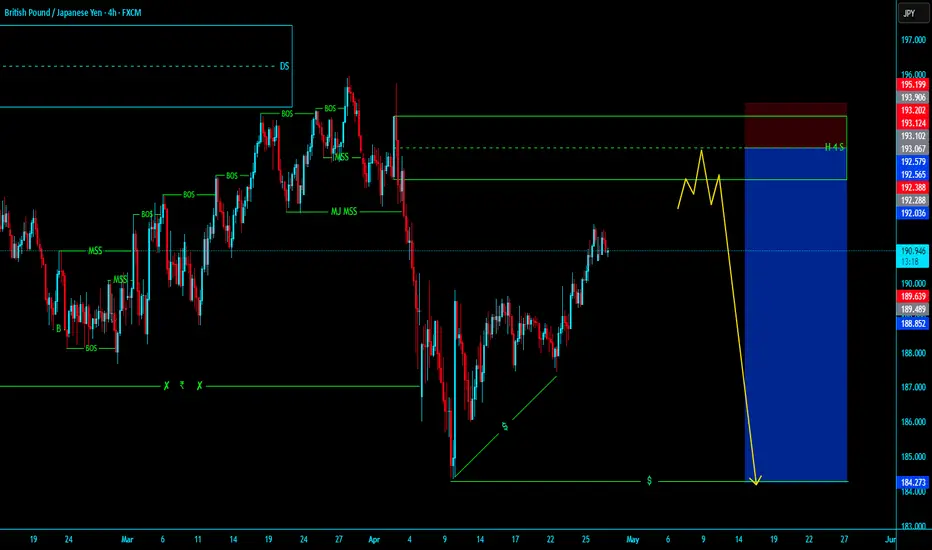
#GBPJPY H4 TF Analysis #GBPJPY H4 TF is bearish once market is comming to our *AOI* then entry with LTF Conformation for a Good trade .
KGB Priyabrat Behera
ICT AND Advance Mapping SMC Trader
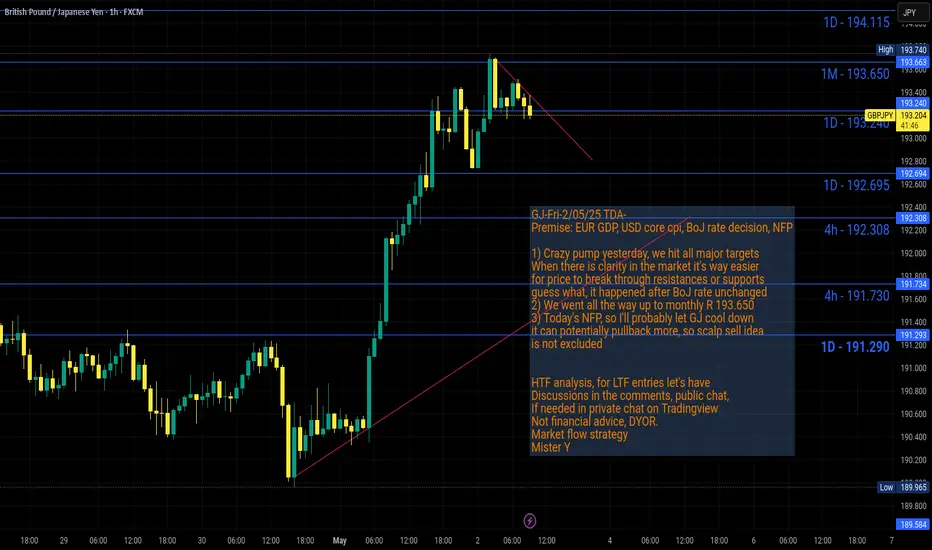
GJ-Fri-2/05/25 TDA-Crazy pump,targets hit beautifully! Now what?Analysis done directly on the chart
Consistency matters
Consistency matters
Consistency matters
Not financial advice, DYOR.
Market Flow Strategy
Mister Y
GBPJPY SHORT FORECAST Q2 W18 D2 Y25GBPJPY SHORT FORECAST Q2 W18 D2 Y25
Professional Risk Managers👋
Welcome back to another FRGNT chart update📈
Diving into some Forex setups using predominantly higher time frame order blocks alongside confirmation breaks of structure.
Let’s see what price action is telling us today!
💡Here are some trade confluences📝
✅Weekly order block rejection
✅Daily order block rejection
✅15' order block targets
✅Weekly imbalance fill targets
🔑 Remember, to participate in trading comes always with a degree of risk, therefore as professional risk managers it remains vital that we stick to our risk management plan as well as our trading strategies.
📈The rest, we leave to the balance of probabilities.
💡Fail to plan. Plan to fail.
🏆It has always been that simple.
❤️Good luck with your trading journey, I shall see you at the very top.
🎯Trade consistent, FRGNT X

GBPJPY: Consolidation Phase Targeting the Main TrendHey Traders, in today's trading session we are monitoring GBPJPY for a buying opportunity around 189.600 zone, GBPJPY is trading in an uptrend and currently is in a correction phase in which it is approaching the trend at 189.600 support and resistance area.
Trade safe, Joe.
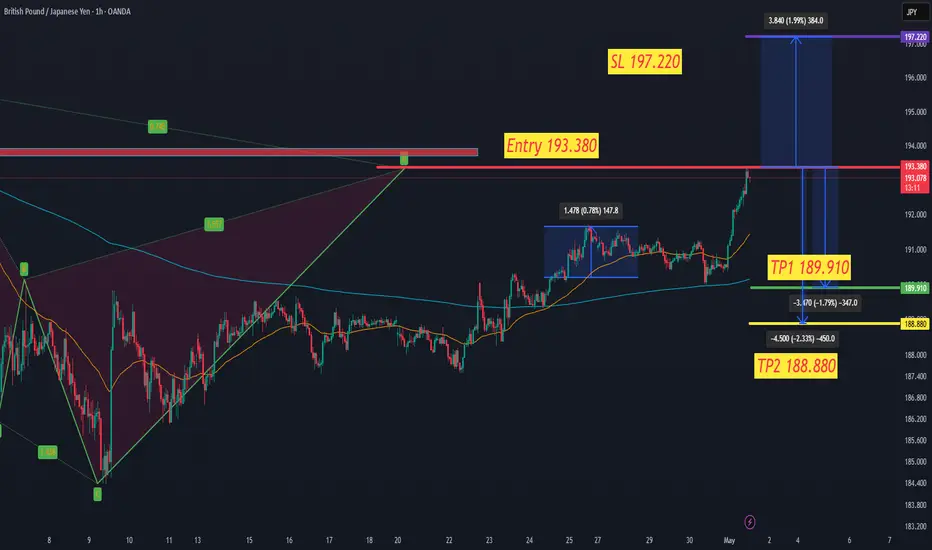
GBPJPY Sell swing ideaFollowing the harmonic pattern strategy. for it to be true. we should wait for a reversal pattern because it's alot of points. and then when the market shifts, we enter.
support and resistances plays a big role in it.
happy trading
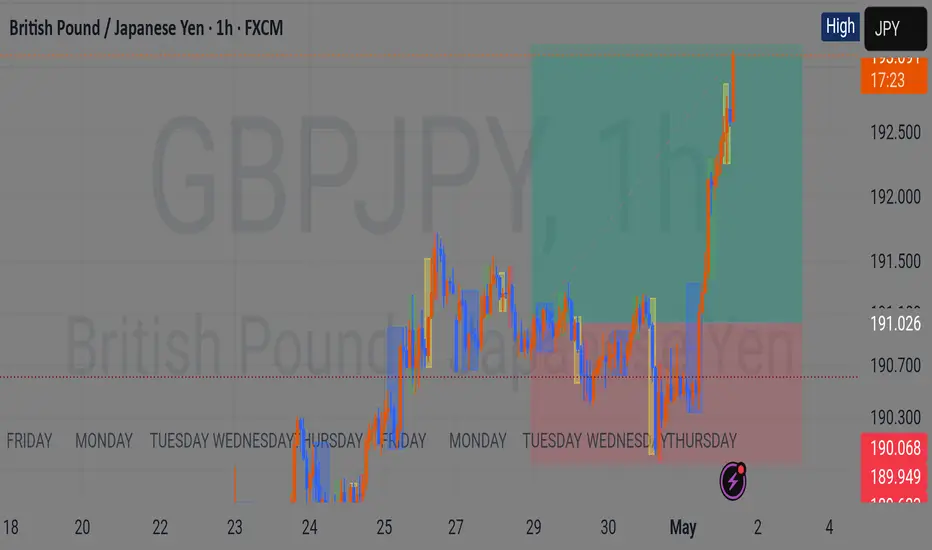
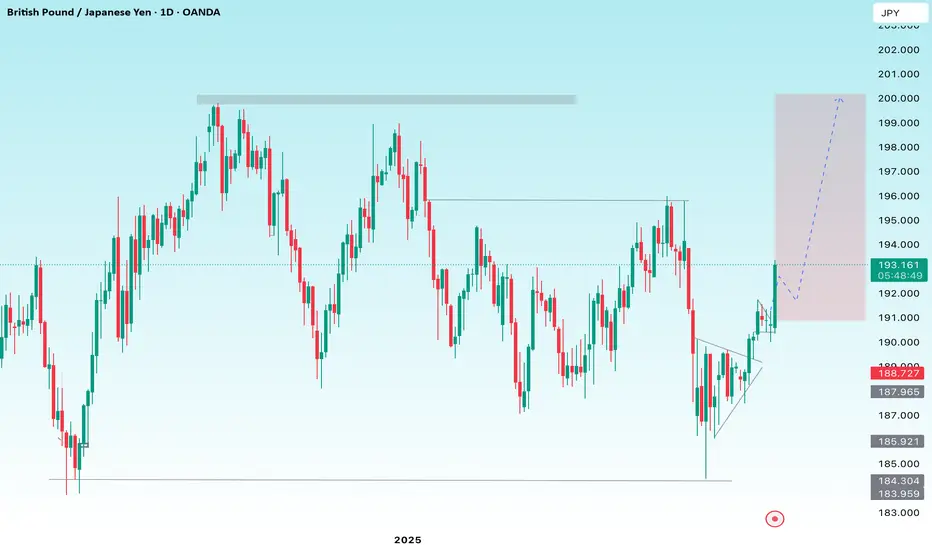
“GBPJPY Surges 200+ Pips After Breakout – More Gains Coming?”GBPJPY Hits +200 Pips After Classic Breakout – More Upside Ahead?
Description:
In a recent analysis shared here, GBPJPY followed through perfectly after breaking out of a bullish triangle pattern. The pair surged over +200 pips, breaching the key resistance zone around 191.00 and now trading near 193.20.
This breakout aligns with strong bullish momentum on the daily chart. While a minor pullback may occur, the next potential upside targets are 195.00, followed by the major 200.00 psychological level, where historical resistance lies.
As long as price holds above the 190.00 support zone, the bullish scenario remains valid. Traders may watch for intraday corrections to rejoin the uptrend.
Follow for more updates and trade setups across major FX pairs.
GBPJPY LONG SETUP UPDATE: FULL TAKE-PROFIT ARCHIVED Excellent execution! Our 1:2 full take-profit target has been reached. Well done! Enjoy the profits and let's look forward to the next trading opportunity.