BuyTrend Line Break
Previous High Break
Order Point
London Session
Previous Week High Break
Head And Shoulder Pattern
JPYGBP trade ideas

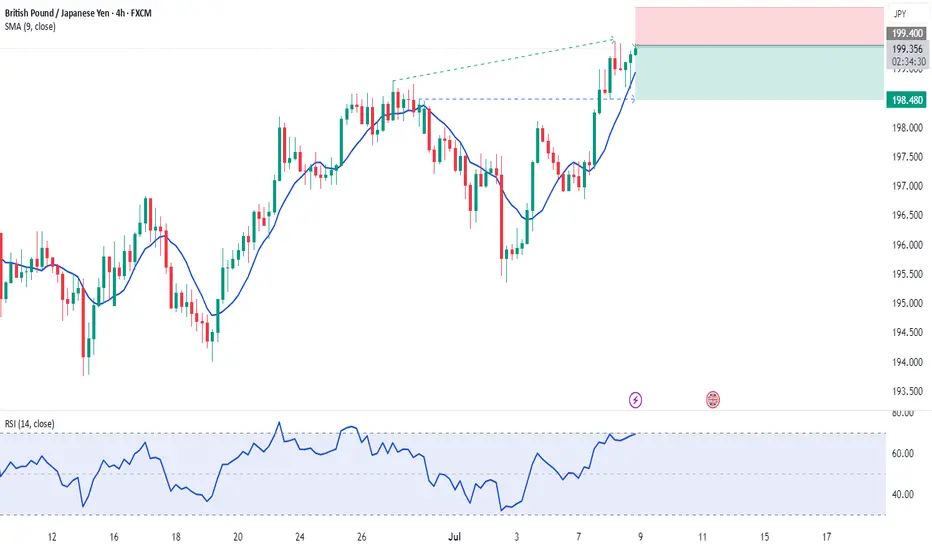
GBPJPY – Correction Pressure Is Building UpGBPJPY is still trading within a well-defined ascending channel on the H4 chart. However, recent signals suggest a potential short-term correction. The price has repeatedly rejected the upper boundary of the channel and is now forming a distribution pattern with lower highs. The FVG zone near 200.400 may act as a short-term take-profit area before price pulls back toward the support zone around 198.400, which also aligns with the lower trendline.
Additionally, the upcoming UK GDP data this week could strongly impact GBP. If the data comes in weaker than expected, downside pressure may intensify and reinforce the developing correction scenario. Traders should monitor price action around 198.400 for confirmation of the pullback.

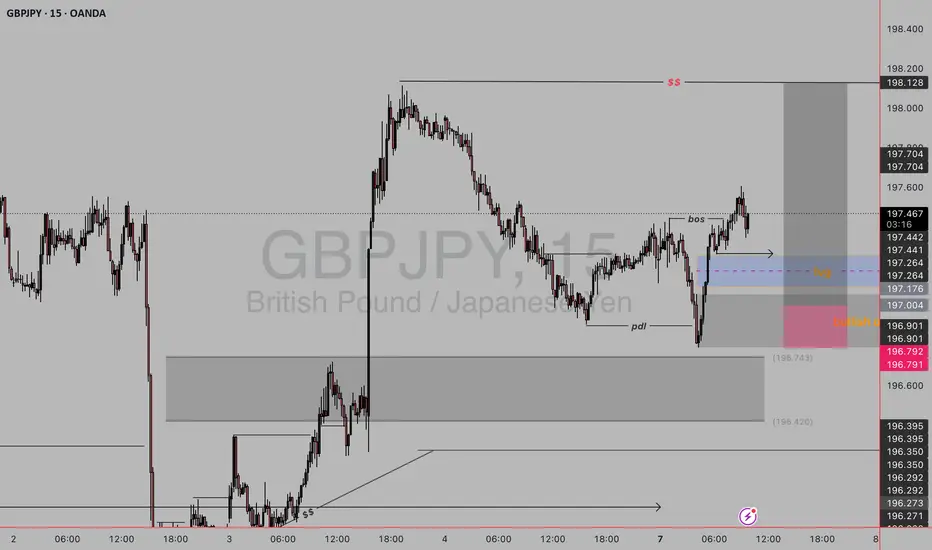
gbpjpy sell setup🔍 Key Concepts in This Setup:
1. Break of Structure (BOS) – Bullish Shift
The BOS shows that price has broken above a previous swing high, signaling a shift from bearish to bullish market structure.
This confirms bullish intent and opens the door for pullback buys.
2. Fair Value Gap (FVG) – Blue Zone
This imbalance zone is created when price aggressively moves up, leaving a gap.
Price is expected to return to this area to fill orders before continuing up.
3. Bullish Order Block – Orange Zone
A bullish order block (OB) is marked just below the FVG.
It represents the last bearish candle before a bullish impulse — an area where institutions may re-enter long positions.
4. PDL Sweep (Previous Day Low)
Price took out the previous day’s low (PDL) and then reversed.
This is a liquidity grab – a classic smart money move before shifting bullish.
5. Premium to Discount Retracement
Price moved from a discount zone after sweeping lows and breaking structure.
Now waiting for a retracement back into a discounted FVG/OB zone to enter a buy.
✅ Buy Entry Plan:
Entry Zone: Around the FVG + OB confluence (196.90–197.10 area).
Confirmation: You might wait for bullish PA (price action) like a bullish engulfing or lower-timeframe BOS at the FVG.
Stop Loss: Below the order block or just under 196.79.
Target: Back to recent highs near 198.10 or even the supply zone (SS) above it.
Follow up on GBPJPY outlookA quick entry at LND open. Monitoring for any invalidation that might present
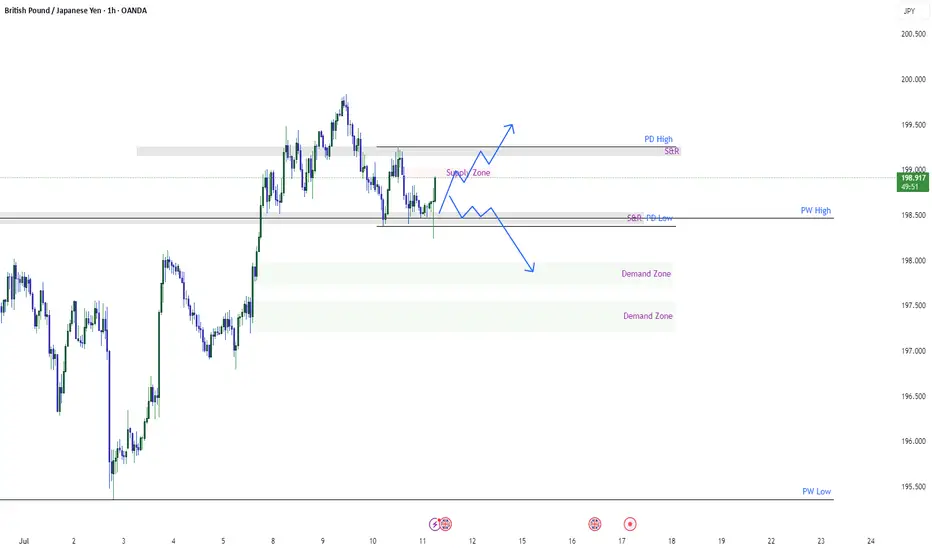
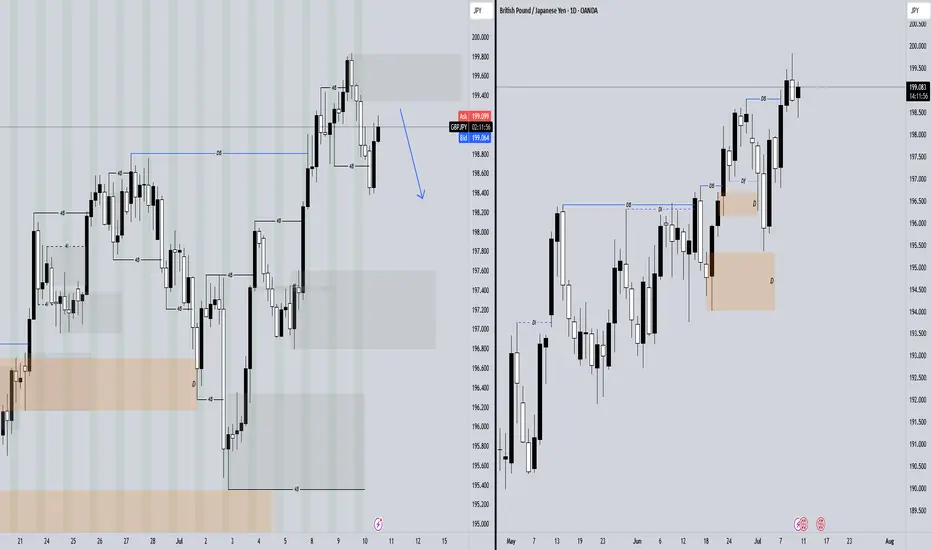
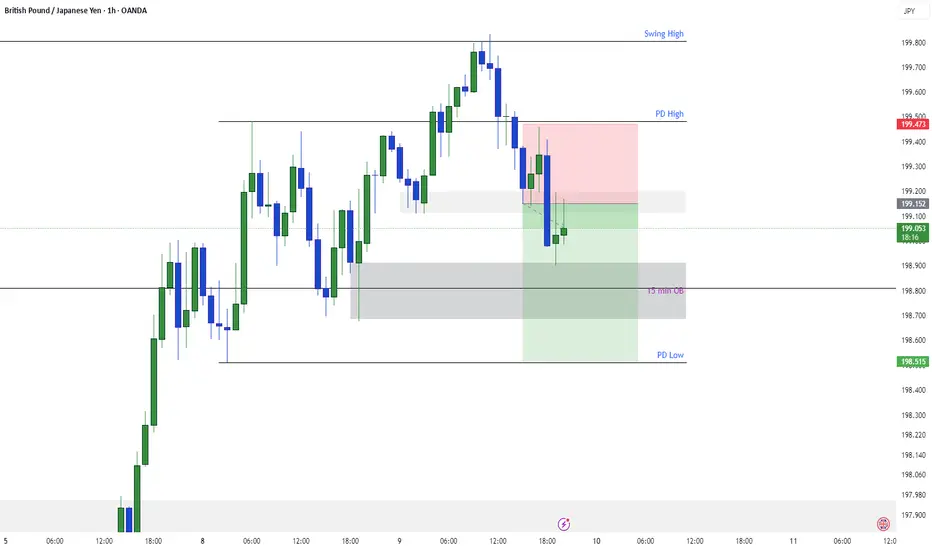
GBPJPY is still in pullbackGJ possibilities has been drawn on chart. GJ is in pullback still. It had developed liquidity around S&R Level and has taken. GJ may touch PD high today because it has already taken PD low. It may go towards the demand zone residing below PD low.
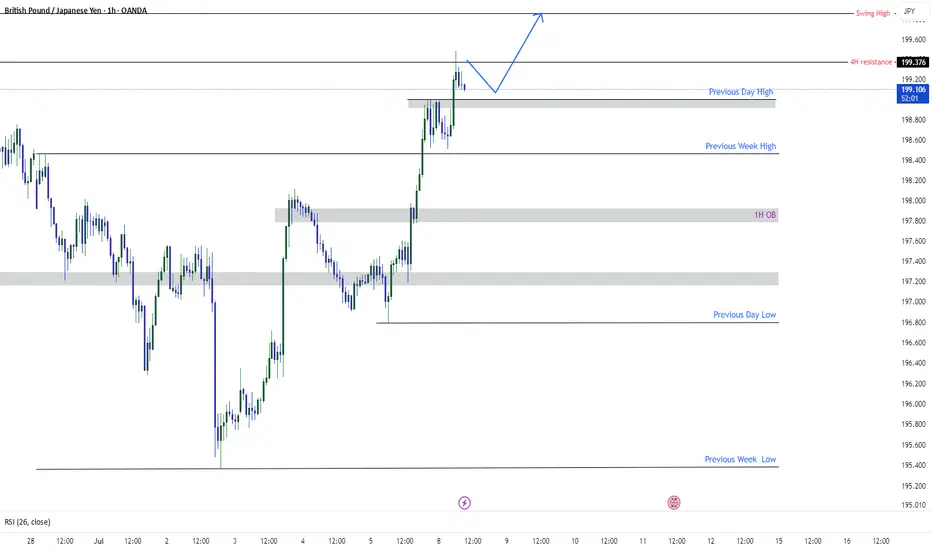
GBPJPY Targeting SwingGBPJPY has currently broken previous day high and wants to target the swing high which is 199.857 after retracing form previous 4H resistance GJ wants to travel to swing high. Chart is showing everything clearly. do not make things complex. Simplify as much as you can.
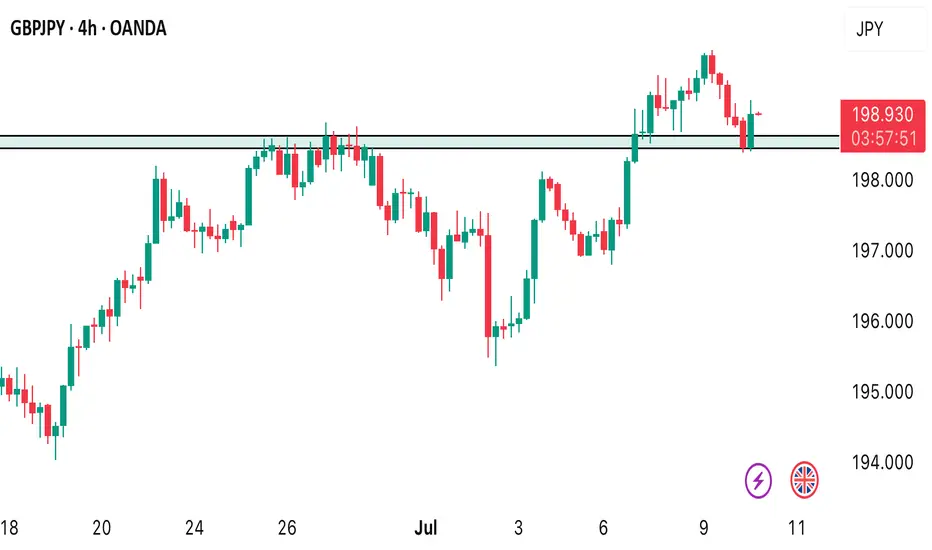
GBPJPY is Holding above the SupportHello Traders
In This Chart GBPJPY HOURLY Forex Forecast By FOREX PLANET
today GBPJPY analysis 👆
🟢This Chart includes_ (GBPJPY market update)
🟢What is The Next Opportunity on GBPJPY Market
🟢how to Enter to the Valid Entry With Assurance Profit
This CHART is For Trader's that Want to Improve Their Technical Analysis Skills and Their Trading By Understanding How To Analyze The Market Using Multiple Timeframes and Understanding The Bigger Picture on the Charts
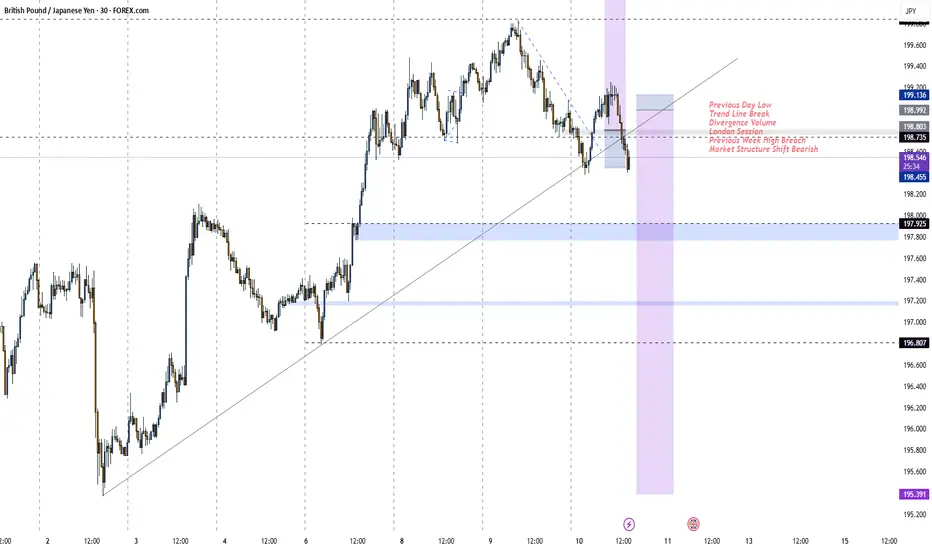
SellPrevious Day Low
Trend Line Break
Divergence Volume
London Session
Previous Week High Breach
Market Structure Shift Bearish
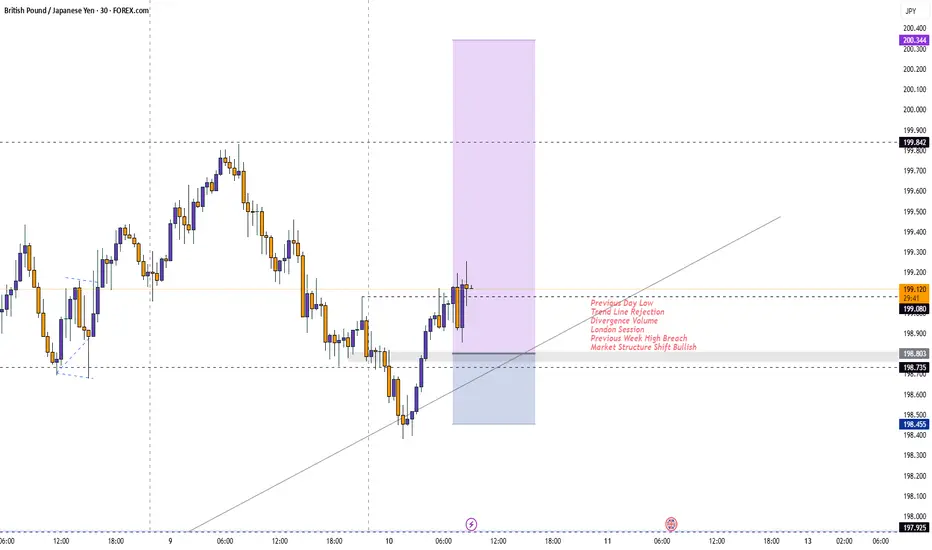
BUYPrevious Day Low
Trend Line Rejection
Divergence Volume
London Session
Previous Week High Breach
Market Structure Shift Bullish
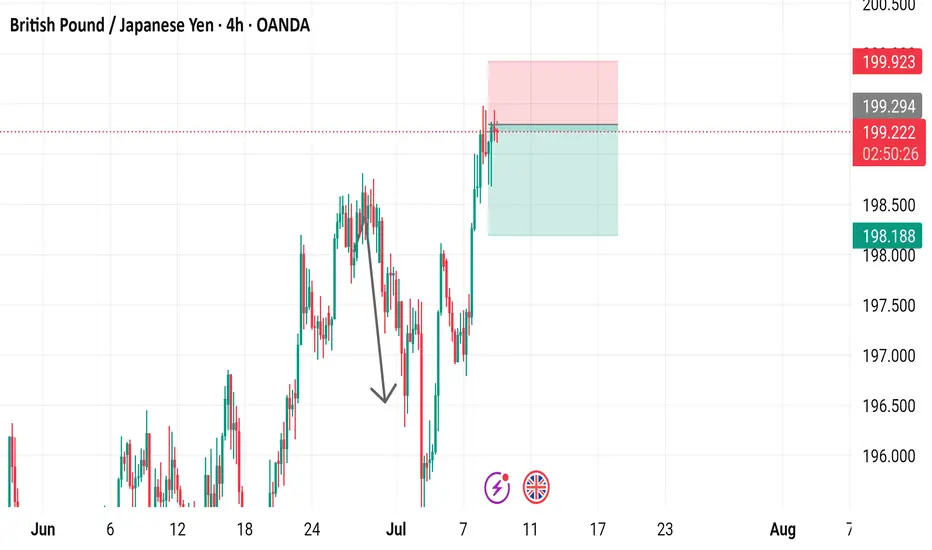
4H CHoCH Formed – Short from Supply with CautionHello Traders,
Today we’ve seen a Change of Character (CHoCH) form on the 4-hour chart after price broke above the higher time frame’s weak high (HH) from yesterday. This suggests we’re now in a bearish counter-trend pullback phase. Trading short from the 4H supply zone with lower time frame (LTF) confirmation presents a high-probability setup.
However, keep in mind that on the daily chart, price is reacting from a Fair Value Gap (FVG) or imbalance zone, meaning there’s still a chance price could push higher. So using LTF confirmation before entering shorts is essential.
BUYPrevious Day Low
Trend Line Rejection
Divergence Volume
London Session
Previous Week High Breach
Market Structure Shift Bullish
Watch
Trade
Manage
Smile

Will GBPJPY uptrend continue??Price is at a crucial point where traders are beginning to watch what’s likely to happen next in the market. Is market likely to continue to trade higher? From the technical standpoint, if price continues to rise and break the 200.000 level we will look for a buy opportunity in this market.
British Pound / Japanese Yen - 4H Chart (OANDA)4-hour chart from OANDA displays the GBP/JPY currency pair's price movement, with the current price at 199.248 (+0.024 or +0.01%). The chart highlights a recent upward trend, breaking through a resistance level around 199.274, with buy and sell indicators at 199.274 and 199.220 respectively. Key price levels include a high of 199.923 and a low of 198.188, with the chart spanning from June to early August 2025.
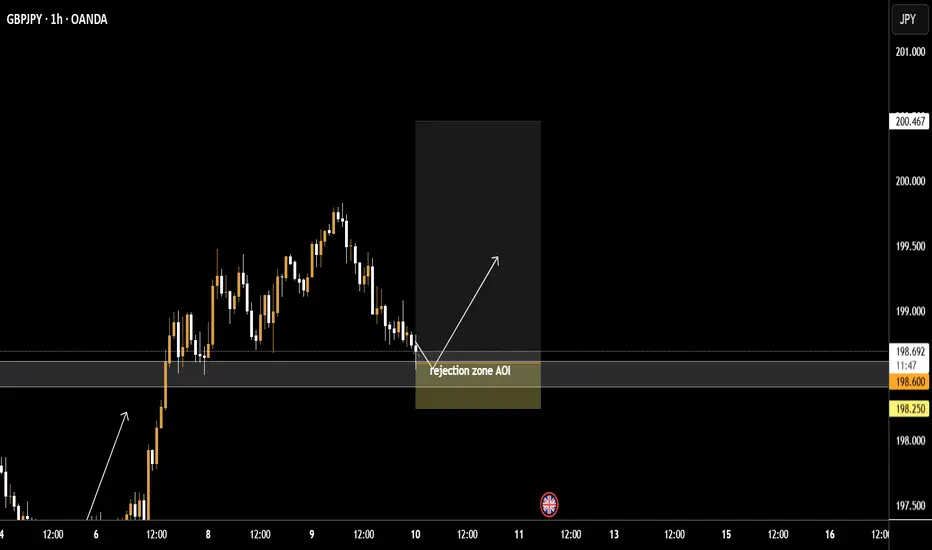
IDEA TRADE GBPJPY LONG POSITION Hi Traders
Pair: GBPJPY
📈 Position: LONG (BUY)
✅ Entry: 198.600
🔺 SL: 198.250 (-35 pips )
🎯 Take Profits:
• TP 1: 198.950
• TP 2: 199.300
• TP 3: 199.650 Trailing SL)
GBPJPY Shown Good Pullback after hitting Swing HighAs share earlier GJ show good bullish move and hit swing high. After hitting swing has given a good pull back and entered into the trade. The engulfing hourly candle showing strong pullback which will possibly go further down to retest a demand zone and an area.
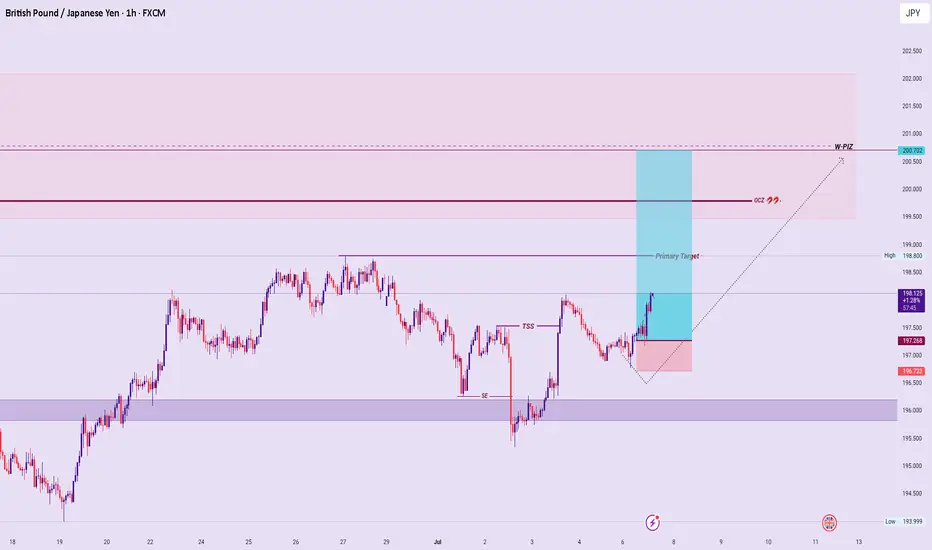
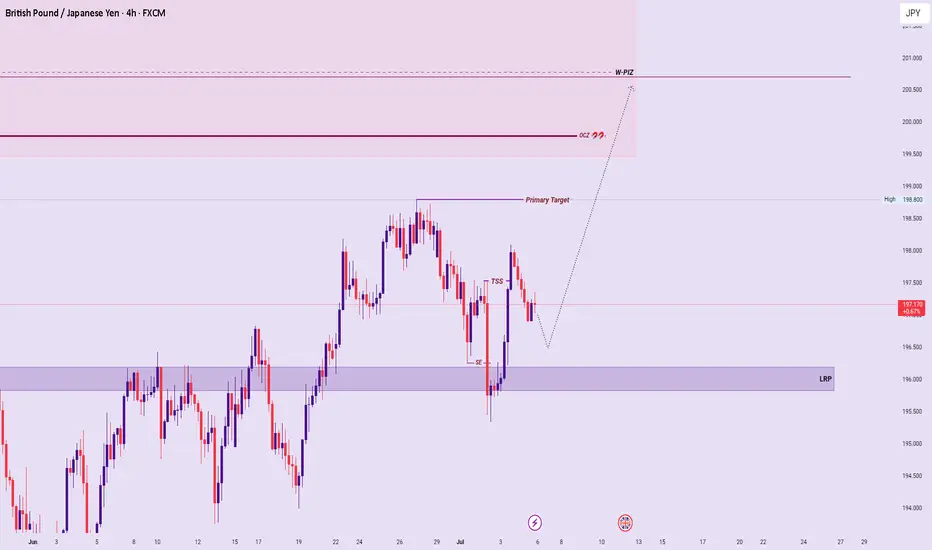
GBPJPY OutlookClean Sweep Event (SE) tapped liquidity, followed by a Trend Signature Shift (TSS) hinting bullish reversal. Eyes on price retesting the LRP zone before targeting Primary Liquidity at 198.800, with extended focus on the OCZ/W-PIZ zone above 199.500.
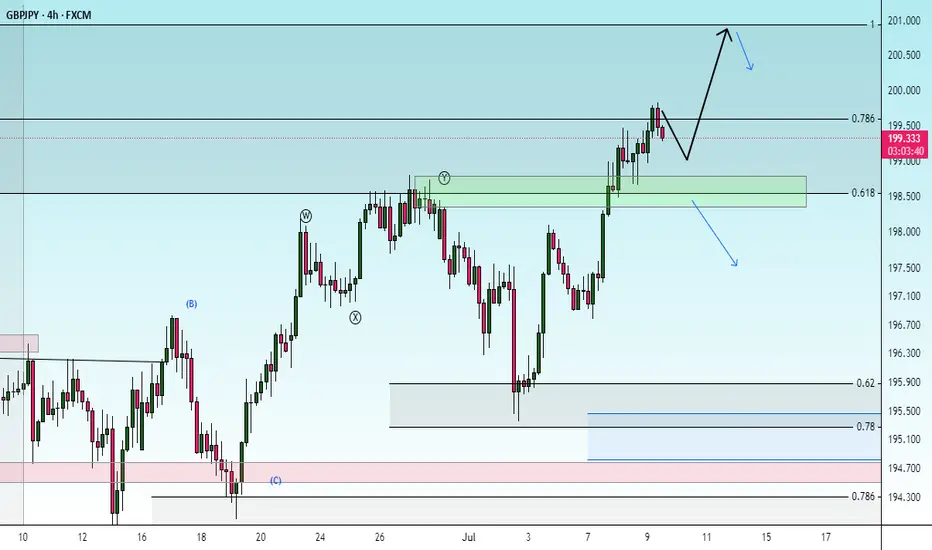
GBPJPY BullishAfter exiting a correction, the first impulse (Wave 1) appears. I expect a retracement of at least 50% of the Fibonacci.
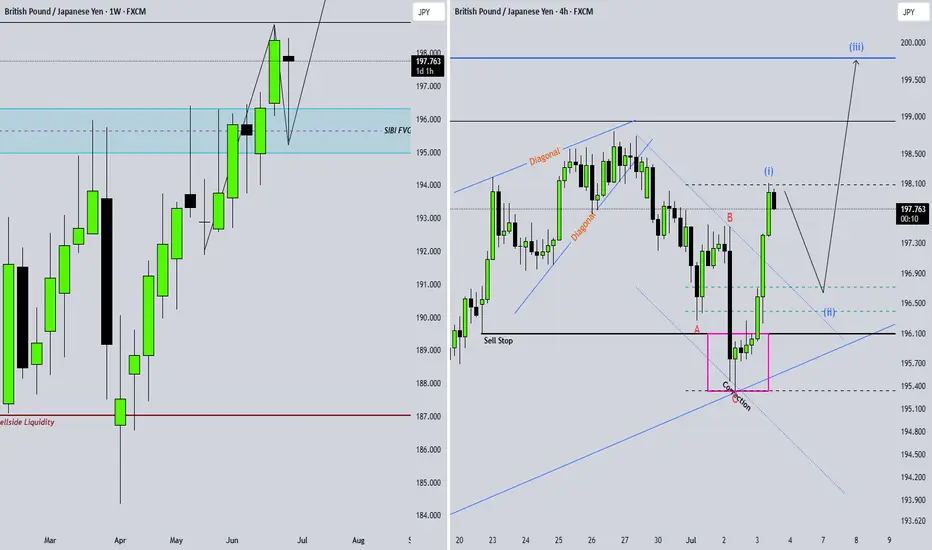
possibility of uptrendAs long as the price is above the green support range, the continuation of the upward trend is likely. Upon reaching the 100% level, a correction trend will probably form.
sell GBPJPYprice rejected the supply with pressure, i think the supply is increasing and buyers have lost momentum.

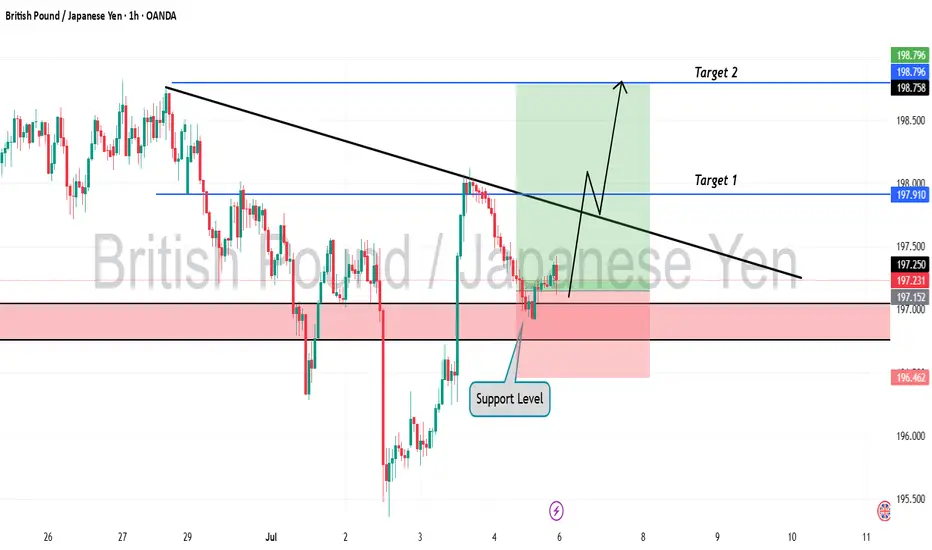
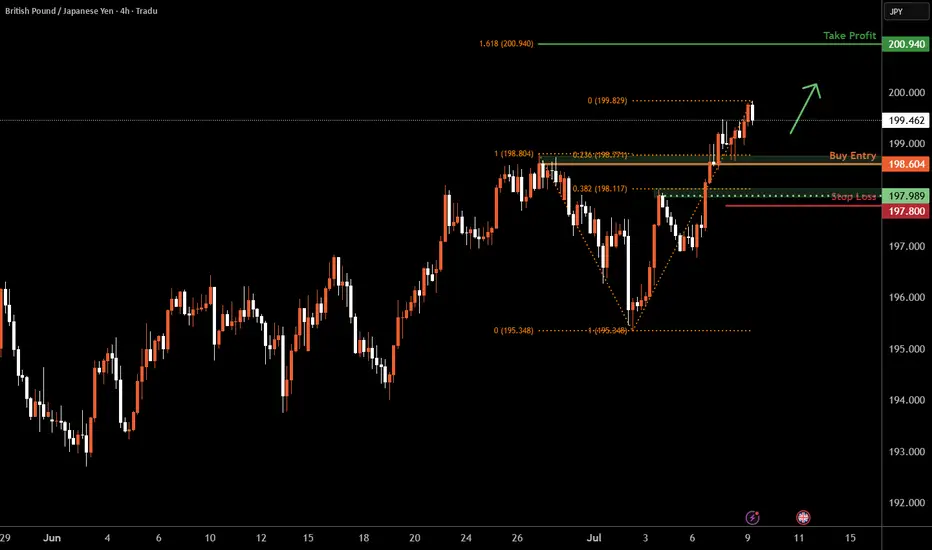
GBP/JPY H4 | Falling toward a pullback supportGBP/JPY is falling towards a pullback support and could potentially bounce off this level to climb higher.
Buy entry is at 198.60 which is a pullback support that aligns with the 23.6% Fibonacci retracement.
Stop loss is at 197.80 which is a level that lies underneath a pullback support and the 38.2% Fibonacci retracement.
Take profit is at 200.94 which is a resistance that aligns with the 161.8% Fibonacci extension.
High Risk Investment Warning
Trading Forex/CFDs on margin carries a high level of risk and may not be suitable for all investors. Leverage can work against you.
Stratos Markets Limited (tradu.com ):
CFDs are complex instruments and come with a high risk of losing money rapidly due to leverage. 63% of retail investor accounts lose money when trading CFDs with this provider. You should consider whether you understand how CFDs work and whether you can afford to take the high risk of losing your money.
Stratos Europe Ltd (tradu.com ):
CFDs are complex instruments and come with a high risk of losing money rapidly due to leverage. 63% of retail investor accounts lose money when trading CFDs with this provider. You should consider whether you understand how CFDs work and whether you can afford to take the high risk of losing your money.
Stratos Global LLC (tradu.com ):
Losses can exceed deposits.
Please be advised that the information presented on TradingView is provided to Tradu (‘Company’, ‘we’) by a third-party provider (‘TFA Global Pte Ltd’). Please be reminded that you are solely responsible for the trading decisions on your account. There is a very high degree of risk involved in trading. Any information and/or content is intended entirely for research, educational and informational purposes only and does not constitute investment or consultation advice or investment strategy. The information is not tailored to the investment needs of any specific person and therefore does not involve a consideration of any of the investment objectives, financial situation or needs of any viewer that may receive it. Kindly also note that past performance is not a reliable indicator of future results. Actual results may differ materially from those anticipated in forward-looking or past performance statements. We assume no liability as to the accuracy or completeness of any of the information and/or content provided herein and the Company cannot be held responsible for any omission, mistake nor for any loss or damage including without limitation to any loss of profit which may arise from reliance on any information supplied by TFA Global Pte Ltd.
The speaker(s) is neither an employee, agent nor representative of Tradu and is therefore acting independently. The opinions given are their own, constitute general market commentary, and do not constitute the opinion or advice of Tradu or any form of personal or investment advice. Tradu neither endorses nor guarantees offerings of third-party speakers, nor is Tradu responsible for the content, veracity or opinions of third-party speakers, presenters or participants.

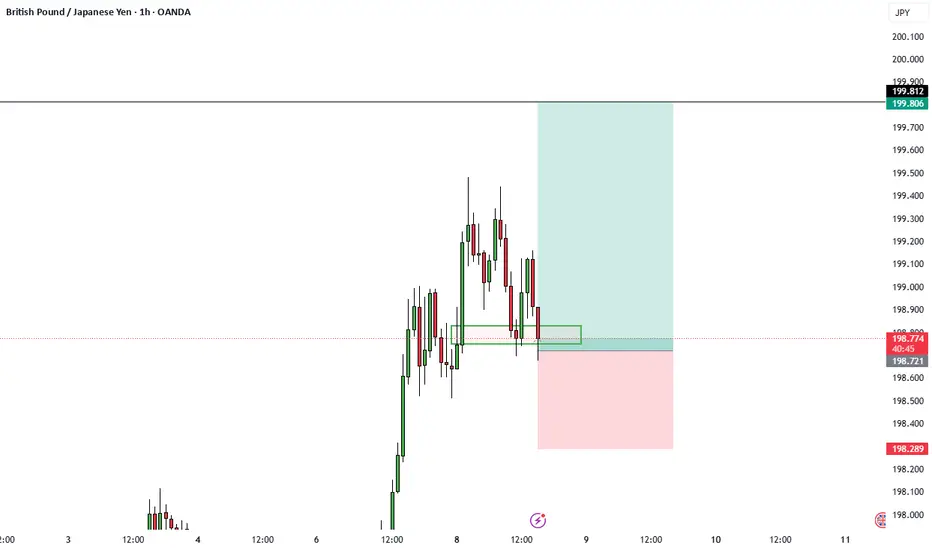
GBPJPY 1:2.51 R 1HR Trade Idea ICTNice entry giving out a 1:2.51 potential R, bullish on GBP, taking out the daily buyside liquidity.