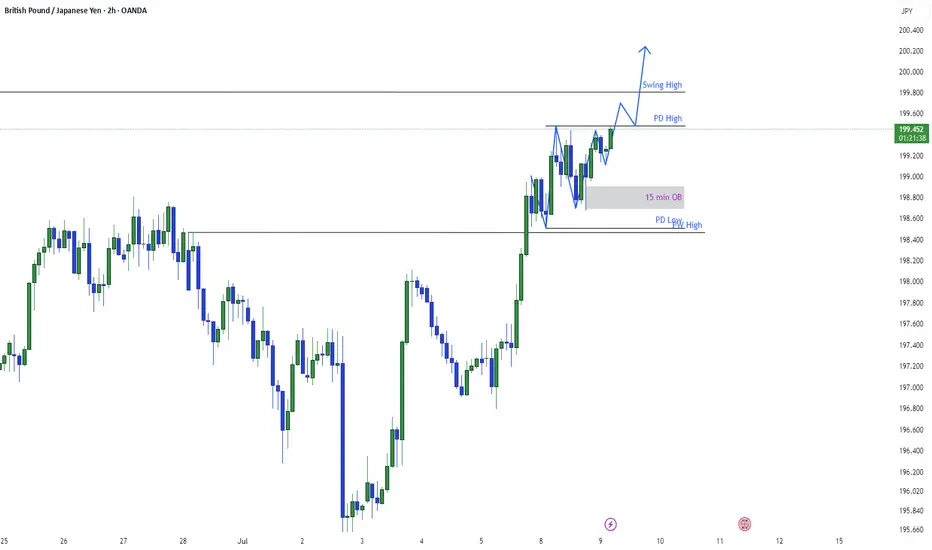
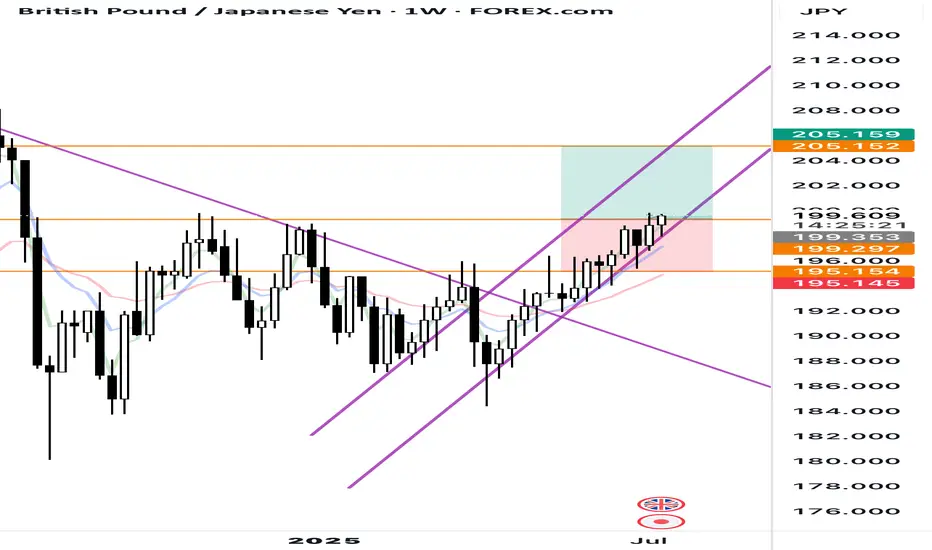
GBPJPY Extremely BullishAs described earlier GJ is extremely bullish and wants to target previous swing. current trading at 199.400 and travelling to the 199.857 which is previous swing high. In my yesterday's analysis I have given clue of GJ's being retracing and accumulating and going up again same is showing. We can see a pullback after taking swing high.
JPYGBP trade ideas
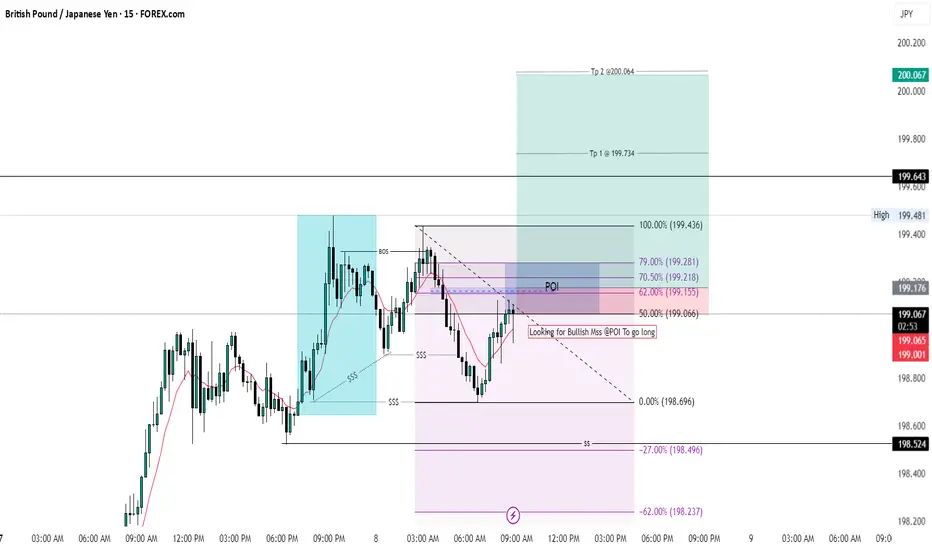
GJ BuysI'm waiting for that small FVG to be used as an iFVG — once that happens, I'll take my first entry on the retest.
Another entry will come from MSS on the lower time frame; if a swing low forms, that will also confirm another entry.
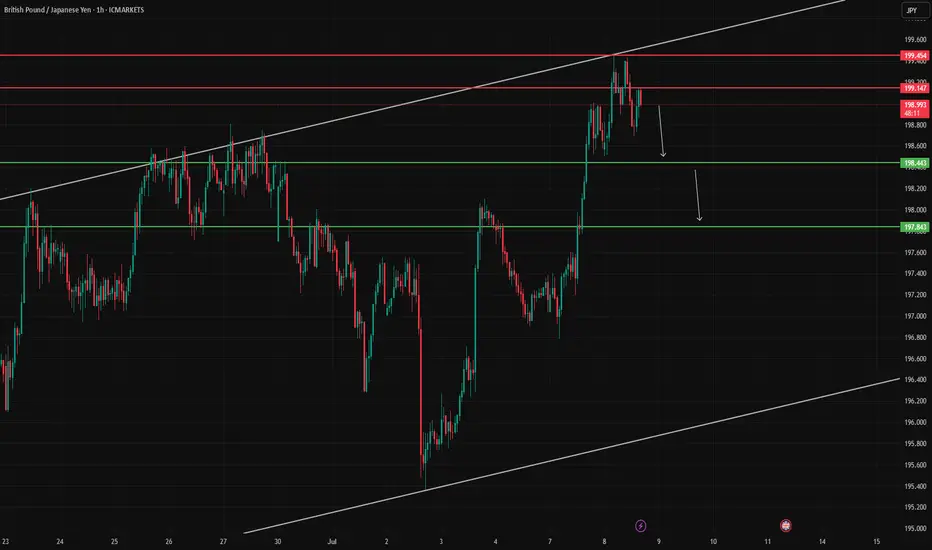
GBPJPY – Rejected from Upper Channel LineGBPJPY has failed to break above the upper channel resistance at 199.454. The pair is now showing signs of bearish rejection.
Targets to watch:
🔻 First: 198.443
🔻 Second: 197.843
Invalidation above 199.454 would negate the setup.
GBP/JPYGBP/JPY has been bullish since April, since then price has reached a significant key area at 199.000-200.000. Over the next few days/weeks i shall be watching this pair to see if price rejects this key zone or if its able to push through. This will determine my next move as to whether we go short or long.

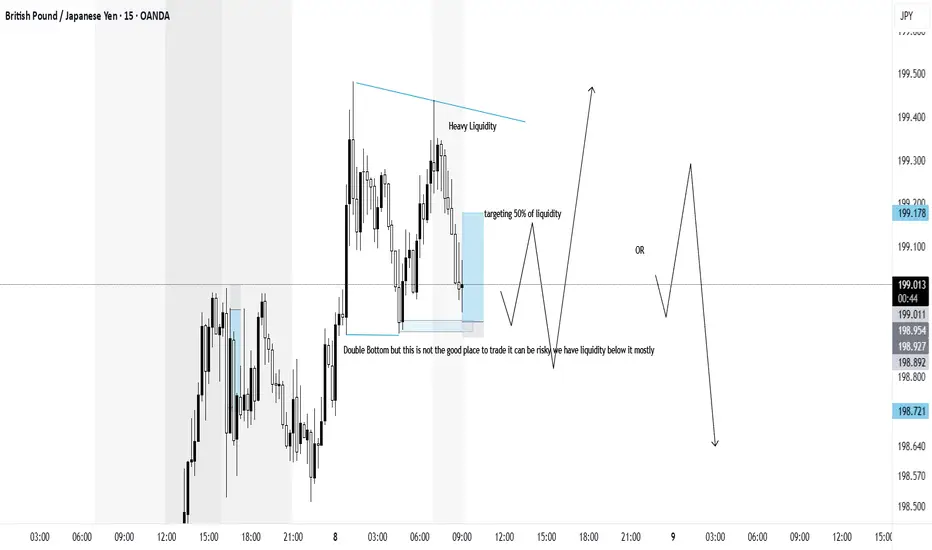
GBPJPYTargeting 1:7 RR this trade can be risky but have good potential as Price can even Take me out ( touch me SL then go UP ) so be cautious but yes its a good trade and has reason low liquidity retailers are trying to push price below and later retailers will try to buy at Double bottom same will be done by institutional and sellers will be taken out then buyers will be taken out so it will go up then can go down than back up
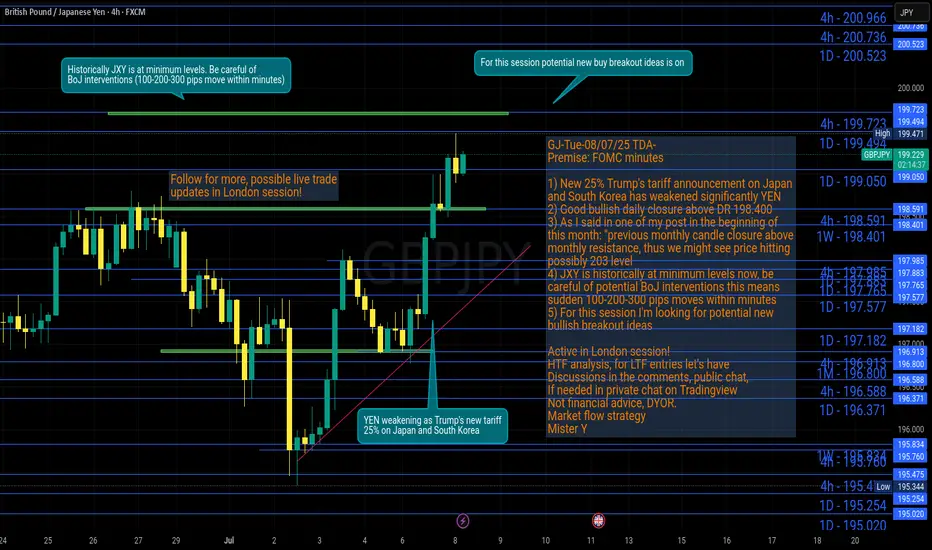
GJ-Tue-08/07/25 TDA-Trump's new tariff 25% on Japan, YEN weakAnalysis done directly on the chart
Follow for more, possible live trades update!
I often share my live trades in Tradingview public chat in London session, stay tuned!
Trump's new tariff 25% on Japan and South Korea has Yen weakening
further more significantly. Historically JXY is at minimum levels, where
BoJ can possibly intervene and buy back YEN and strengthening it.
Possibly causing massive dump on GJ like 100-200-300 pips move
within minutes. Always be careful and stay up to date to recent global
events and more.
Premise:
A simple idea plan (like Tradingview public posts) won't describe everything.
No one can predict how market will move, it's always good to react to how it moves.
It gives an idea of how price might move, but no one come from FUTURE.
So I always encourage people to openly and actively discuss in real time.
For example discussing on Tradingview public chat (and more).
I don't give signals blindly, people should learn
and understand the skill.
Following blindly signals you won't know how to
manage the trade, where precisely put sl and tp,
lot size and replicate the move over time.
That's why you need active real time discussions.
Trading is not get rich quick scheme!
Active in London session!
Not financial advice, DYOR.
Market Flow Strategy
Mister Y
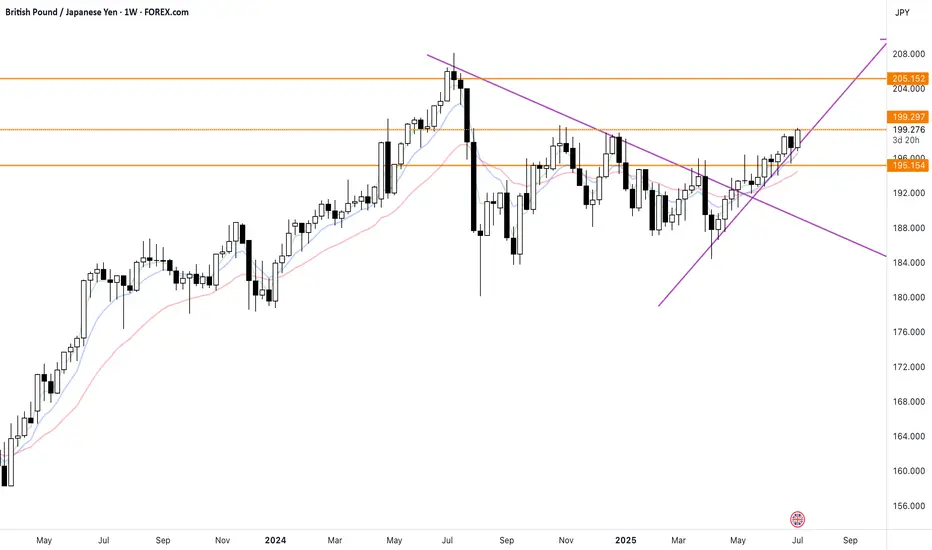
gbpjpy long outlookif anyone see any different lmk what you see. whati am seeing based off weekly chart is price breaking ristance asreas and moving on up to another ristsance zone. what do you guys think
?
IDEA TRADE GBPJPY LONG POSITION Hi Traders
Pair: GBPJPY
📈 Position: LONG (BUY)
✅ Entry: 197.150
🔺 SL: 196.750 (-40 pips )
🎯 Take Profits:
• TP 1: 197.550
• TP 2: 197.950
• TP 3: 198.350 Trailing SL)
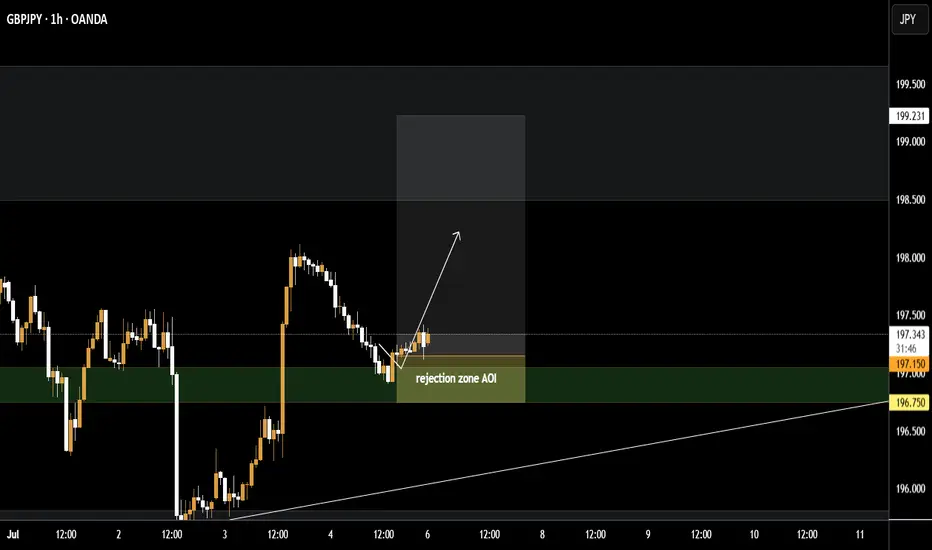
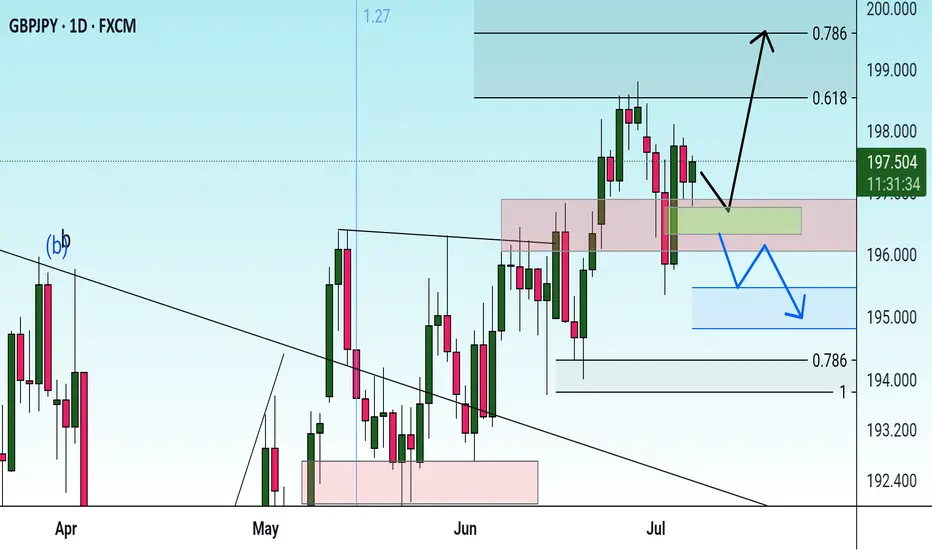
Possibility of uptrend It is expected that a trend change will take place within the green support area and we will witness the start of an upward trend. Otherwise, the correction trend will continue to the next support levels.
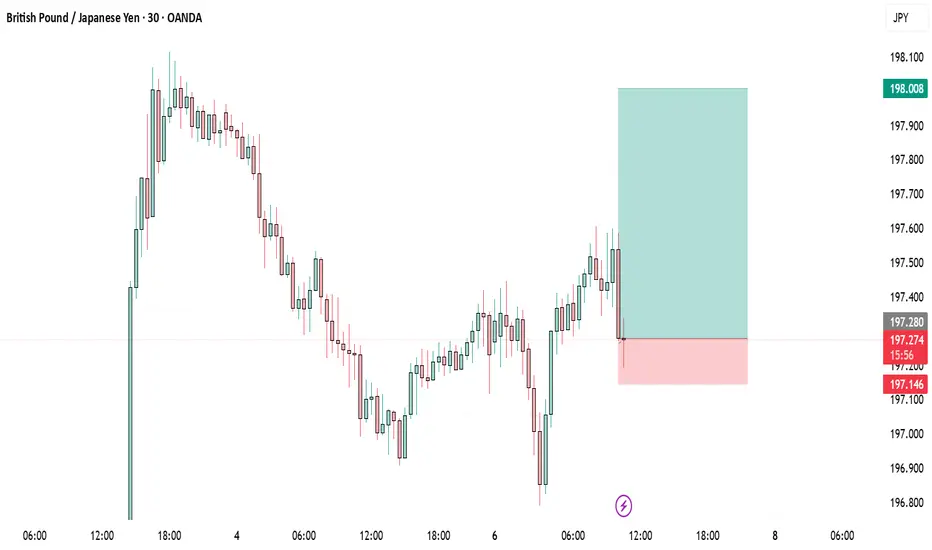
BUY GBPJPYWhile everyone sells, the chart prints signs of bullish movement. Buy this double bottom from 197,2 and take profit it 198. 80 pips trade
GBPJPY SHORT DAILY FORECAST Q3 D7 W28 Y25GBPJPY SHORT DAILY FORECAST Q3 D7 W28 Y25
Professional Risk Managers👋
Welcome back to another FRGNT chart update📈
Diving into some Forex setups using predominantly higher time frame order blocks alongside confirmation breaks of structure.
Let’s see what price action is telling us today! 👀
💡Here are some trade confluences📝
✅Daily Order block identified
✅4H Order Block identified
✅1H Order Block identified
🔑 Remember, to participate in trading comes always with a degree of risk, therefore as professional risk managers it remains vital that we stick to our risk management plan as well as our trading strategies.
📈The rest, we leave to the balance of probabilities.
💡Fail to plan. Plan to fail.
🏆It has always been that simple.
❤️Good luck with your trading journey, I shall see you at the very top.
🎯Trade consistent, FRGNT X
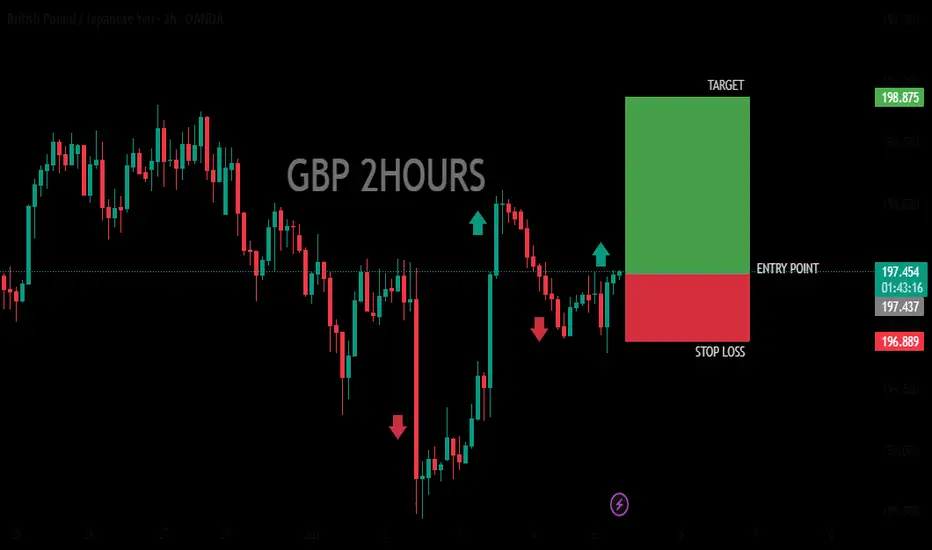
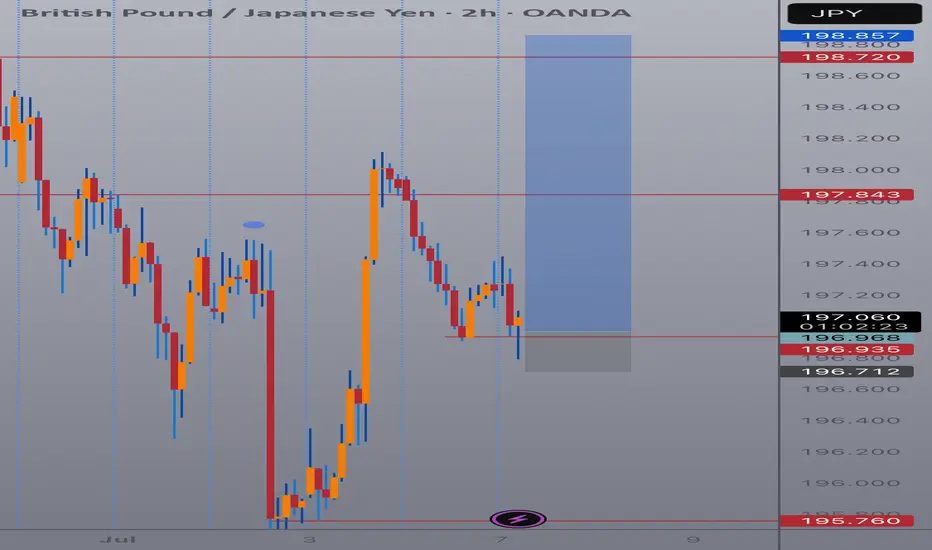
GBP 2HORS BULISH ANALYSISThe image shows a computer screen displaying a trading platform, specifically a chart for the British Pound/Japanese Yen (GBPJPY) currency pair. The chart is set to a 2-hour time frame and features a black background with red and blue bars indicating price movements.
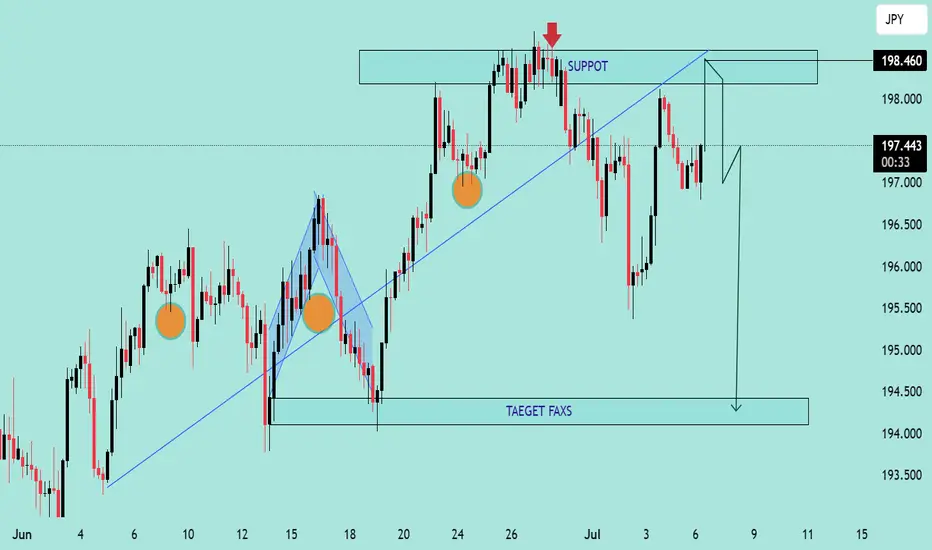
GBP/JPY Rejection from Resistance Zone GBP/JPY Rejection from Resistance Zone 🧱📌 | Bearish Setup In Play 🔻💹
📌 Technical Analysis Overview:
The chart illustrates a clear rejection from the resistance zone around 198.460, where previous price action formed a double-top pattern (🔴 red arrow). This suggests a strong supply area with selling pressure building.
🔍 Key Observations:
📏 Trendline Break:
The upward trendline (blue) has been decisively broken.
This break signals a loss of bullish momentum.
🧱 Resistance Zone @ 198.000–198.460:
Price tested this zone multiple times but failed to break above.
Acts now as a strong resistance zone.
🟠 Support Turned Resistance:
Former support has now turned into resistance (highlighted in blue text: "SUPPOT").
📉 Bearish Projection:
The projected path indicates a possible retest of the resistance zone before a sell-off continuation.
Target area: around 194.500, marked as “TAEGET FAXS” (typo: should be “TARGET ZONE”).
🔄 Possible Scenarios:
✅ Bearish Continuation:
If price rejects again near 198.000, expect a bearish move toward 194.500.
⚠️ Invalidation:
A strong breakout above 198.460 would invalidate the bearish thesis and may resume bullish momentum.
🔚 Conclusion:
The pair is currently under pressure with a confirmed break in trend structure. As long as price remains below 198.460, the bias remains bearish with a target toward the 194.500 zone. 📉👀
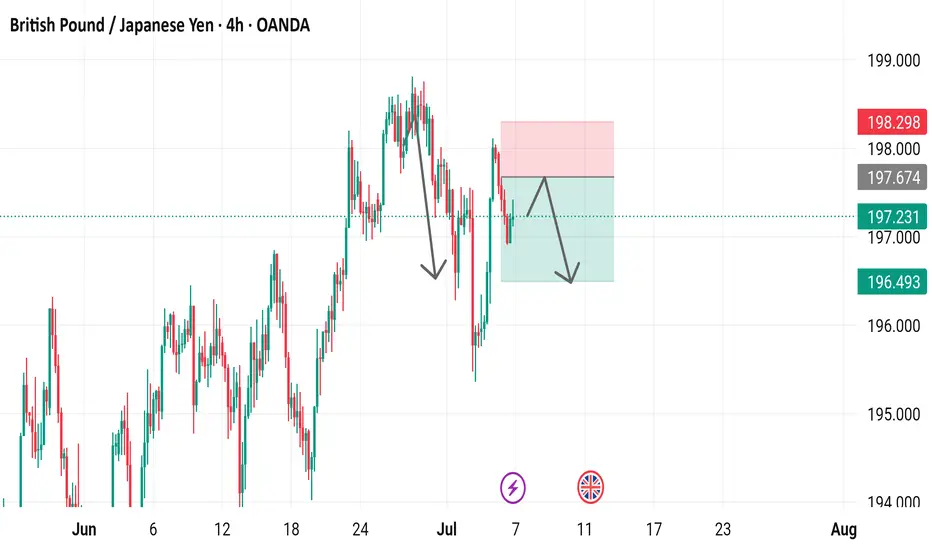
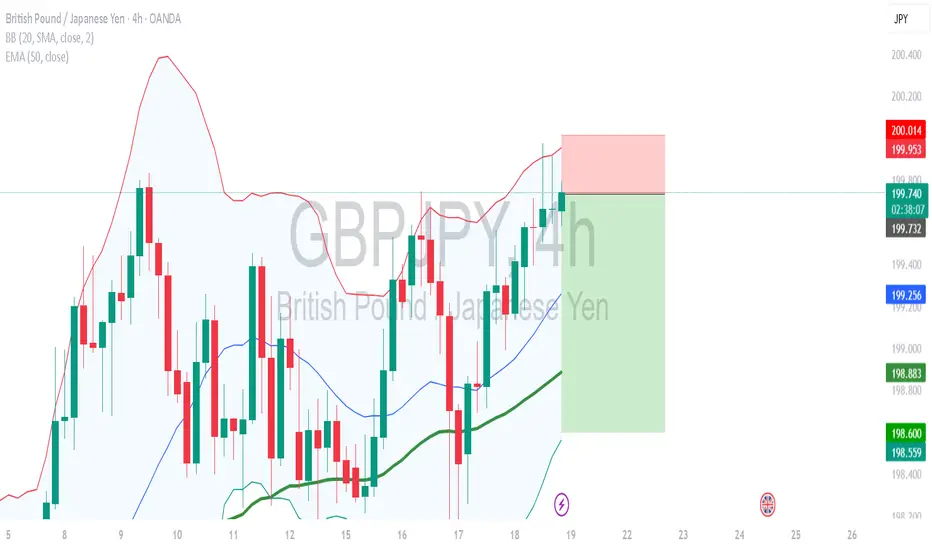
GBP/JPY 4-Hour Chart Analysis - OANDA4-hour chart of the British Pound (GBP) against the Japanese Yen (JPY) from OANDA shows a recent price of 197.231, with a decrease of 0.653 (-0.33%). The chart highlights a sell signal at 197.006 and a buy signal at 197.456, with a 45.0 pip difference. A downward trend is indicated with a shaded resistance zone between 198.298 and 197.674, suggesting potential selling pressure as the price approaches this level. The chart covers data from late June to early July 2025.
Shorty GbpJpyLook for liquidity sweep at the end of each trend
Mark your retracement zones
Use Fibonacci to find your sl and tp zones
Rule of your deposit
Try to set sl at 10% of your deposit
Use a reasonable lot size
AND MAKE A TRADE
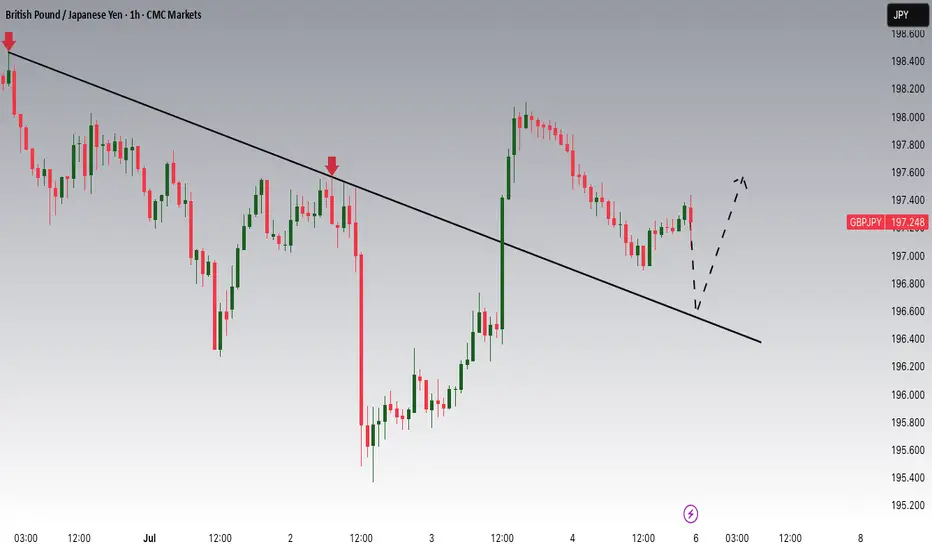
GBPJPY Breakout and Potential RetraceHey Traders, in the coming week we are monitoring GBPJPY for a buying opportunity around 196.600 zone, GBPJPY was trading in a downtrend and successfully managed to break it out. Currently is in a correction phase in which it is approaching the retrace area at 196.600 support and resistance zone.
Trade safe, Joe.
GBPJPY - How i see the market. WHAT DO YOU THINK?A channel within a channel .
Short-term bearish pressure to complete the 3-drives pattern, which ultimately suggests a long bullish setup. I'd only consider this setup if the trend continues to 198.000.
side note
198.000 I'll be looking for buying opportunities to the upside probably until we hit the red channel trendline. That should guarantee approx. 350pips.
You could take advantage of the current bearish move and rejoin when the bulls hit the ground running. Remember use your own trading plan and enjoy the ride . It can go either way but hopefully it respects PA and goes with this flow.
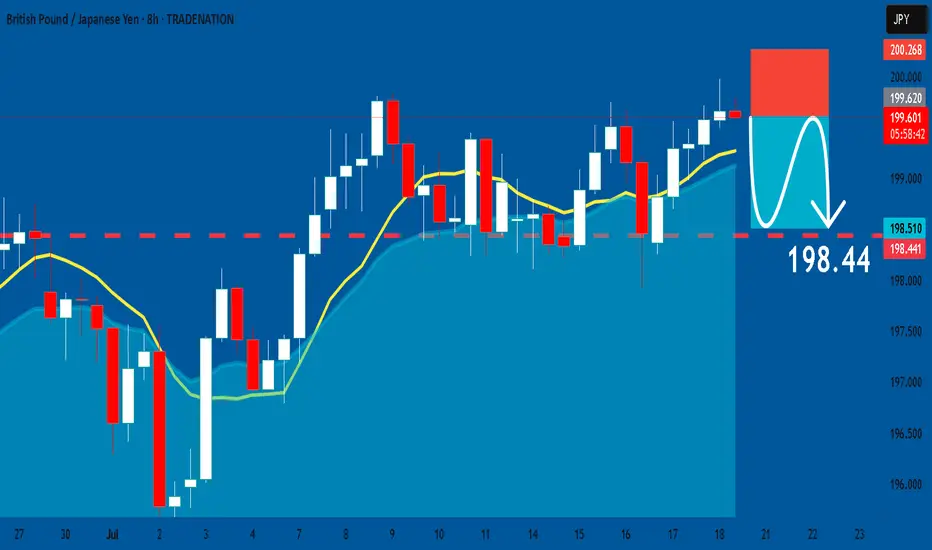
GBPJPY: Short Trading Opportunity
GBPJPY
- Classic bearish formation
- Our team expects pullback
SUGGESTED TRADE:
Swing Trade
Short GBPJPY
Entry - 199.63
Sl - 200.26
Tp - 198.44
Our Risk - 1%
Start protection of your profits from lower levels
Disclosure: I am part of Trade Nation's Influencer program and receive a monthly fee for using their TradingView charts in my analysis.
❤️ Please, support our work with like & comment! ❤️
GBPJPY short at current market priceH4 candle closed in doji pattern, hint for buyer started losing the strength.
i'm short at current market price.
target to take profit at 198.60
calculate your own risk & reward
Good luck
GBPJPY long outlook Looks like we just broke resistance area now heading up to next resistance area level.
I have set some support and resistance lines to project my outlook .
What do you it’s think?
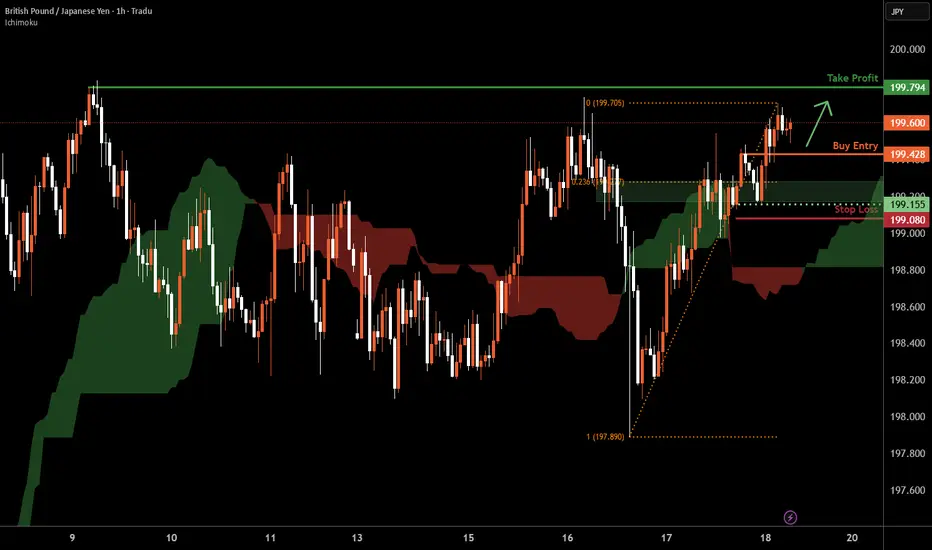
GBP/JPY H1 | Bullish uptrend to extend higher?GBP/JPY is falling towards a pullback support and could potentially bounce off this level to climb higher.
Buy entry is at 199.42 which is a pullback support.
Stop loss is at 199.08 which is a level that lies underneath a swing-low support and the 23.6% Fibonacci retracement.
Take profit is at 199.79 which is a swing-high resistance.
High Risk Investment Warning
Trading Forex/CFDs on margin carries a high level of risk and may not be suitable for all investors. Leverage can work against you.
Stratos Markets Limited (tradu.com ):
CFDs are complex instruments and come with a high risk of losing money rapidly due to leverage. 66% of retail investor accounts lose money when trading CFDs with this provider. You should consider whether you understand how CFDs work and whether you can afford to take the high risk of losing your money.
Stratos Europe Ltd (tradu.com ):
CFDs are complex instruments and come with a high risk of losing money rapidly due to leverage. 66% of retail investor accounts lose money when trading CFDs with this provider. You should consider whether you understand how CFDs work and whether you can afford to take the high risk of losing your money.
Stratos Global LLC (tradu.com ):
Losses can exceed deposits.
Please be advised that the information presented on TradingView is provided to Tradu (‘Company’, ‘we’) by a third-party provider (‘TFA Global Pte Ltd’). Please be reminded that you are solely responsible for the trading decisions on your account. There is a very high degree of risk involved in trading. Any information and/or content is intended entirely for research, educational and informational purposes only and does not constitute investment or consultation advice or investment strategy. The information is not tailored to the investment needs of any specific person and therefore does not involve a consideration of any of the investment objectives, financial situation or needs of any viewer that may receive it. Kindly also note that past performance is not a reliable indicator of future results. Actual results may differ materially from those anticipated in forward-looking or past performance statements. We assume no liability as to the accuracy or completeness of any of the information and/or content provided herein and the Company cannot be held responsible for any omission, mistake nor for any loss or damage including without limitation to any loss of profit which may arise from reliance on any information supplied by TFA Global Pte Ltd.
The speaker(s) is neither an employee, agent nor representative of Tradu and is therefore acting independently. The opinions given are their own, constitute general market commentary, and do not constitute the opinion or advice of Tradu or any form of personal or investment advice. Tradu neither endorses nor guarantees offerings of third-party speakers, nor is Tradu responsible for the content, veracity or opinions of third-party speakers, presenters or participants.
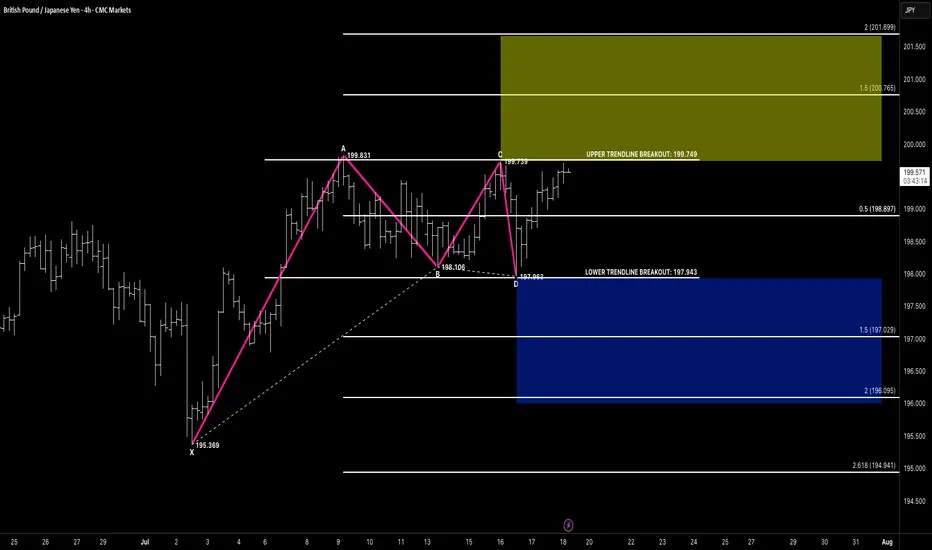
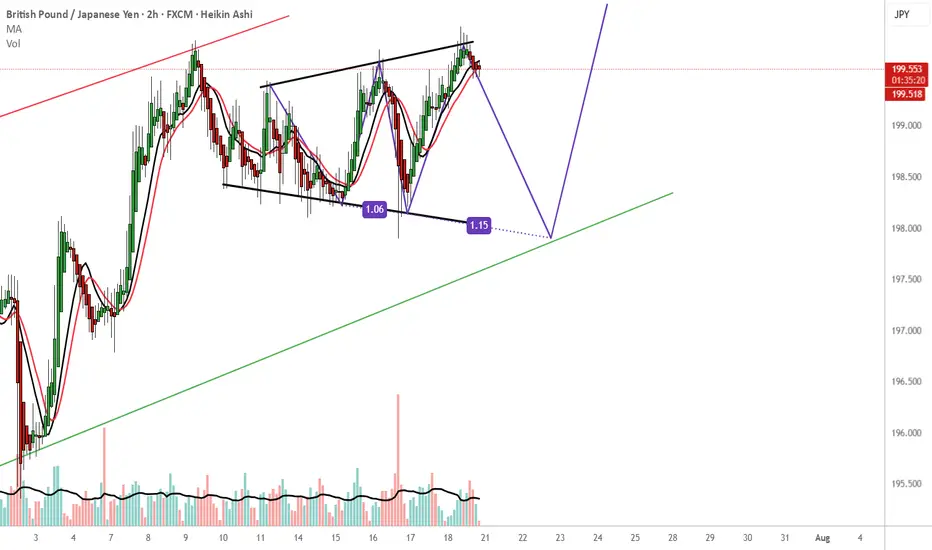
RECTANGLE CHANNELHello awesome traders! 👋
Hope you’ve managed to grab some solid pips from the markets this week. As we head into the weekend, I’m wrapping things up by dropping a few clean chart setups for you to review and reflect on.
Enjoy the weekend, recharge well — and I’ll see you sharp and ready next week for more structure-led opportunities.
📌 Pattern Breakdown
We’ve been tracking a developing rectangle channel between 197.94 (support) and 199.74 (resistance):
🔹 Price formed a clear 4-leg compression
🔹 CD leg bounced off lower support near 197.96
🔹 We’re now approaching the upper edge of the channel at 199.74
🔹 Compression structure suggests breakout potential is building
🚨 Breakout Setup in Focus
🔸 A breakout above 199.75 opens the door toward:
✅ Target 1 Zone:
• 1.5 extension = 200.76
✅ Target 2 Zone:
• 2.0 extension = 201.69
📌 Flip-side: A failed breakout and close back below 197.94 would shift structure toward:
🔻 Bearish Breakdown Targets:
• 1.5 = 197.02
• 2.0 = 196.09
• 2.618 = 194.94
We stay flexible — trade the breakout, not the anticipation.
🧠 Key Concepts in Play
✅ Rectangle consolidation
✅ Breakout-ready structure
✅ Defined upper/lower breakout levels
✅ Volume and reaction at edges = trigger
🗝 Final Thoughts
GBPJPY is boxed in tight — but momentum is clearly leaning bullish.
If we get that clean break above 199.75 with confirmation (volume, close, continuation), the 200.76+ range is firmly in sight. No breakout? No problem — structure has a plan either way.
“Boxes don’t trap the market — they build the tension. Breakouts reward the patient.”