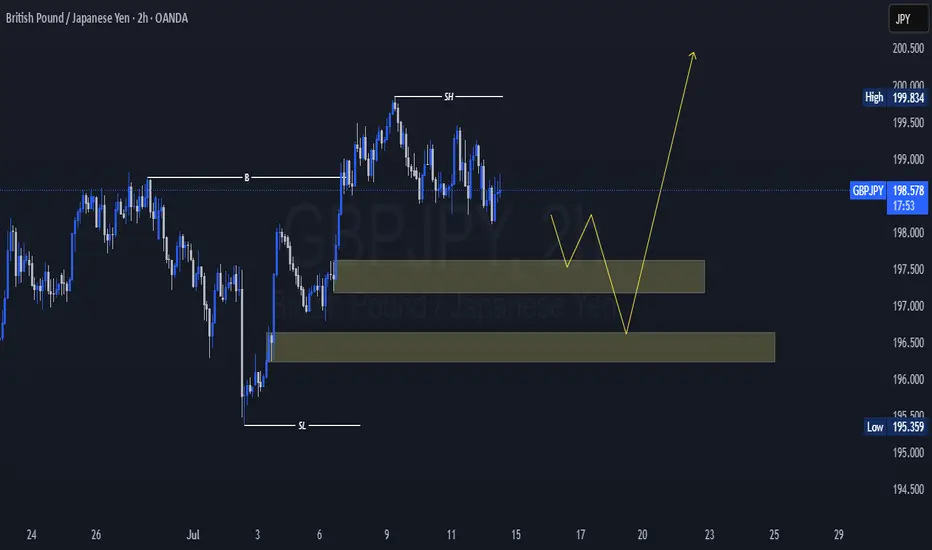
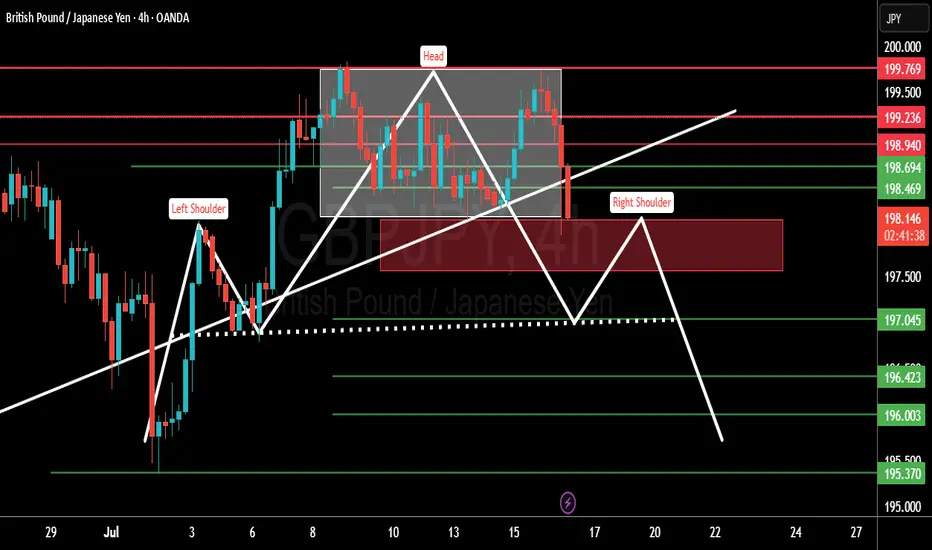
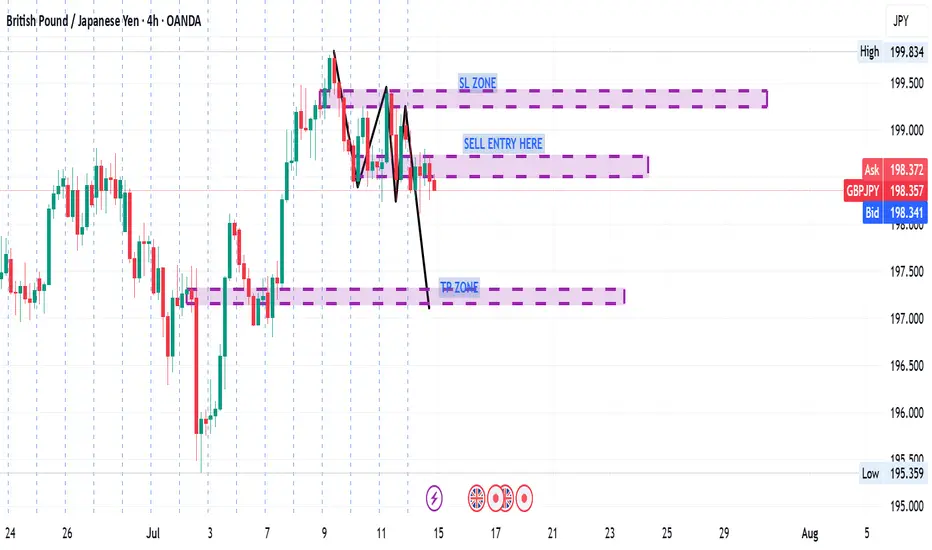
GBPJPY SELLH&S pattern forming fibs also gives a clear sign of sell long tell with the market reversing.
JPYGBP trade ideas
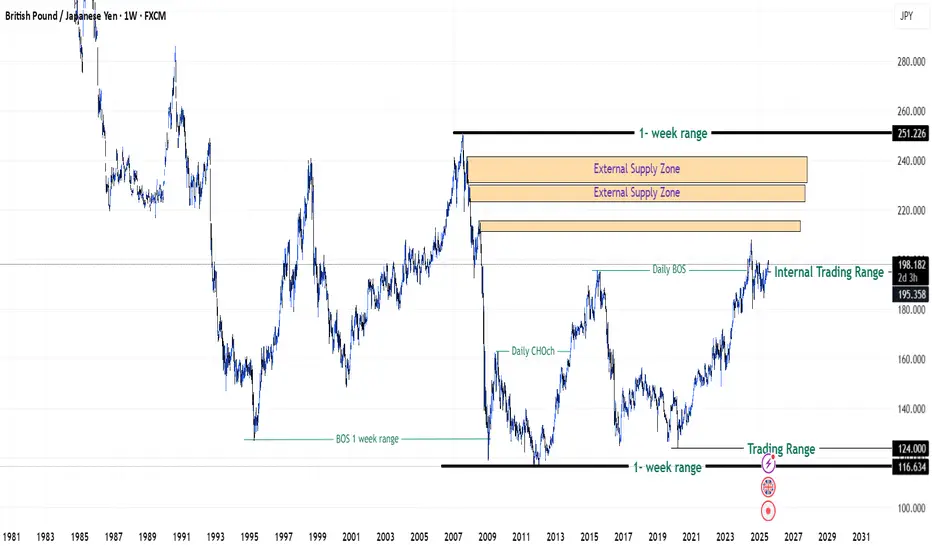
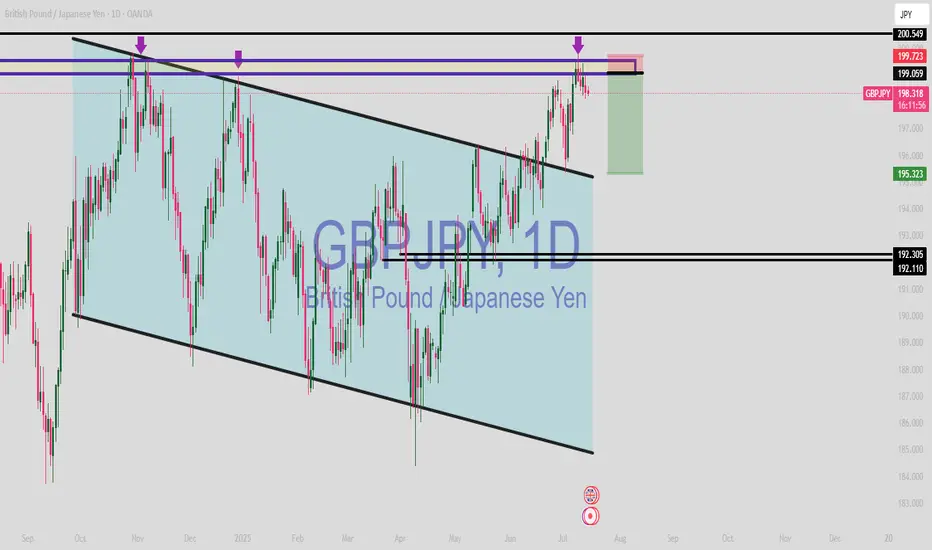
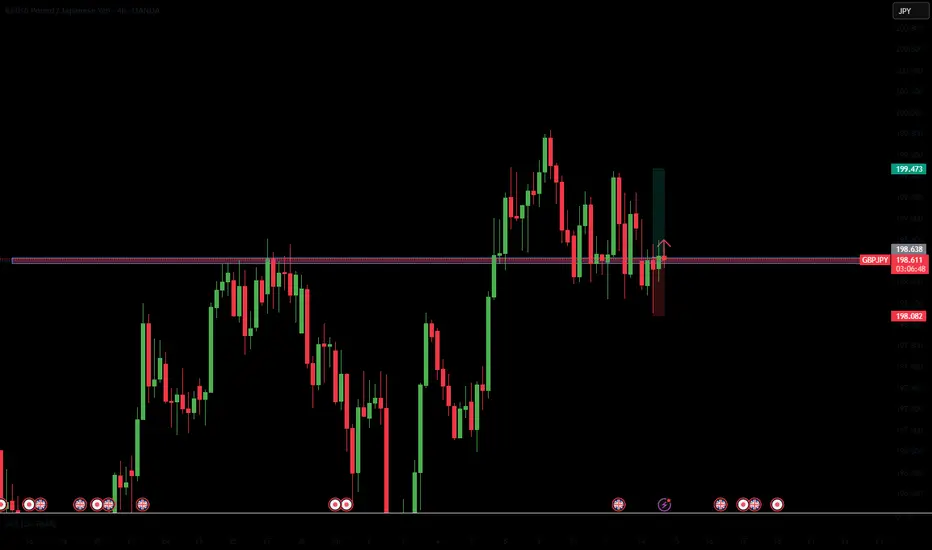
GBPJPY in Premium Zones of 2008 Financial Crisis - {17/07/2025}Educational Analysis says that GBPJPY (FX pair) may give trend Trading opportunities from this range, according to my technical analysis.
Broker - FXCM
So, my analysis is based on a top-down approach from weekly to trend range to internal trend range.
So my analysis comprises of two structures: 1) Break of structure on weekly range and 2) Trading Range to fill the remaining fair value gap
Will Jpy start to lose value like it is doing since 2019 or it will do free fall same like 2008 crisis.
Let's see what this FX pair brings to the table for us in the future.
Please check the comment section to see how this turned out.
DISCLAIMER:-
This is not an entry signal. THIS IS FOR EDUCATIONAL PURPOSES ONLY.
I HAVE NO CONCERNS WITH YOUR PROFIT OR LOSS,
Happy Trading.
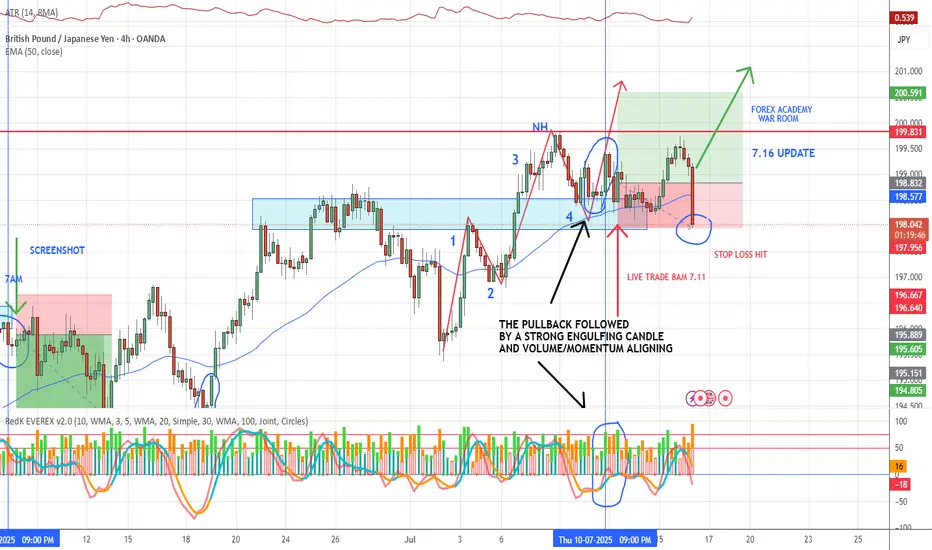
7.16 GBP/JPY LOSSSome days you go through things like this, when the markets make big moves it is great if you are on the right side and sucks if you are not. We have a limit to our exposure in the markets and ALWAYS follow our bankroll management plan. Price hit our stop on this one — no hesitation, no regrets. The setup met all the VMS criteria, but the market had other plans. This happens, and it’s built into the process. No revenge trades. No chasing. Just alignment and discipline. That’s how we grow.
ger30 longLike I previously said, it's a very simple and repetitive approach to the markets
identifying the daily trend
identifying the 4h level
final: entering after entry patterns on the smaller time frame

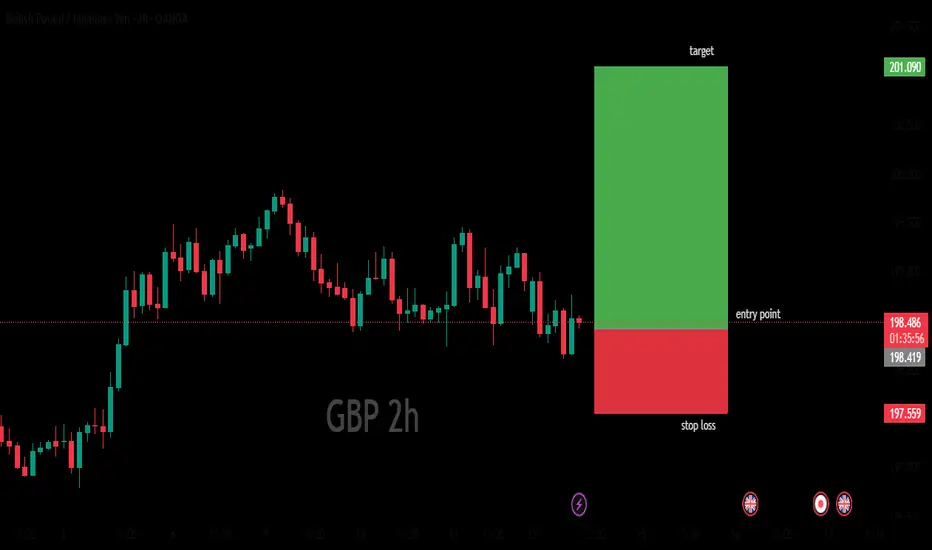
GBP/JPY 2HOURS BULISH ANALYSISThe image shows a computer screen displaying a trading platform with a candlestick chart for the GBP/USD currency pair. The chart is displayed on a black background, with pink and blue bars representing price movements. A green and pink rectangle is visible on the left side of the screen, possibly indicating a trade or order. The overall atmosphere suggests that someone is actively trading or analyzing the market using this platform.
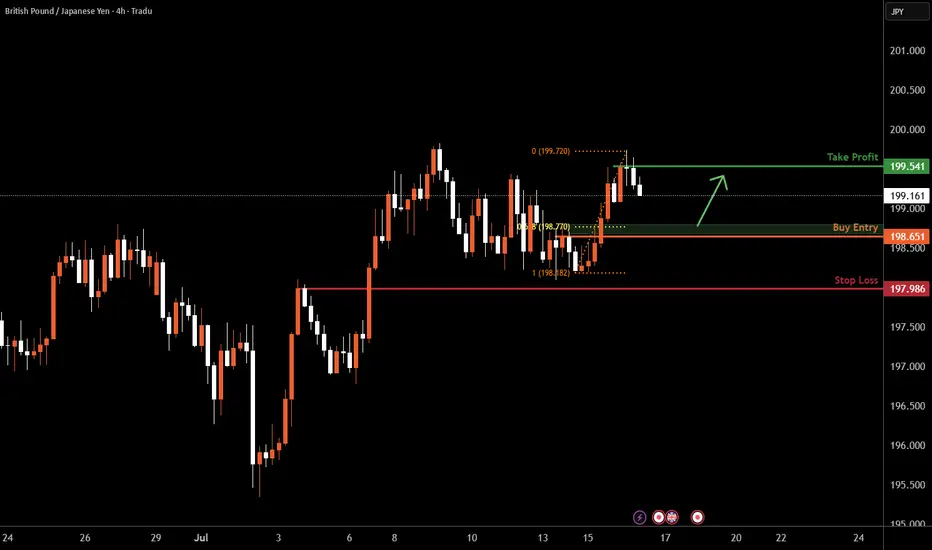
GBPJPY H4 I Bullish Bounce Off Based on the H4 chart analysis, we can see that the price is falling toward our buy entry at 198.65, a pullback support that aligns closely with the 61.8% Fib retracement.
Our take profit will be at 199.54, which is a swing high resistance level.
The stop loss will be placed at 197.98, which is a pullback support level.
High Risk Investment Warning
Trading Forex/CFDs on margin carries a high level of risk and may not be suitable for all investors. Leverage can work against you.
Stratos Markets Limited (tradu.com ):
CFDs are complex instruments and come with a high risk of losing money rapidly due to leverage. 66% of retail investor accounts lose money when trading CFDs with this provider. You should consider whether you understand how CFDs work and whether you can afford to take the high risk of losing your money.
Stratos Europe Ltd (tradu.com ):
CFDs are complex instruments and come with a high risk of losing money rapidly due to leverage. 66% of retail investor accounts lose money when trading CFDs with this provider. You should consider whether you understand how CFDs work and whether you can afford to take the high risk of losing your money.
Stratos Global LLC (tradu.com ):
Losses can exceed deposits.
Please be advised that the information presented on TradingView is provided to Tradu (‘Company’, ‘we’) by a third-party provider (‘TFA Global Pte Ltd’). Please be reminded that you are solely responsible for the trading decisions on your account. There is a very high degree of risk involved in trading. Any information and/or content is intended entirely for research, educational and informational purposes only and does not constitute investment or consultation advice or investment strategy. The information is not tailored to the investment needs of any specific person and therefore does not involve a consideration of any of the investment objectives, financial situation or needs of any viewer that may receive it. Kindly also note that past performance is not a reliable indicator of future results. Actual results may differ materially from those anticipated in forward-looking or past performance statements. We assume no liability as to the accuracy or completeness of any of the information and/or content provided herein and the Company cannot be held responsible for any omission, mistake nor for any loss or damage including without limitation to any loss of profit which may arise from reliance on any information supplied by TFA Global Pte Ltd.
The speaker(s) is neither an employee, agent nor representative of Tradu and is therefore acting independently. The opinions given are their own, constitute general market commentary, and do not constitute the opinion or advice of Tradu or any form of personal or investment advice. Tradu neither endorses nor guarantees offerings of third-party speakers, nor is Tradu responsible for the content, veracity or opinions of third-party speakers, presenters or participants.
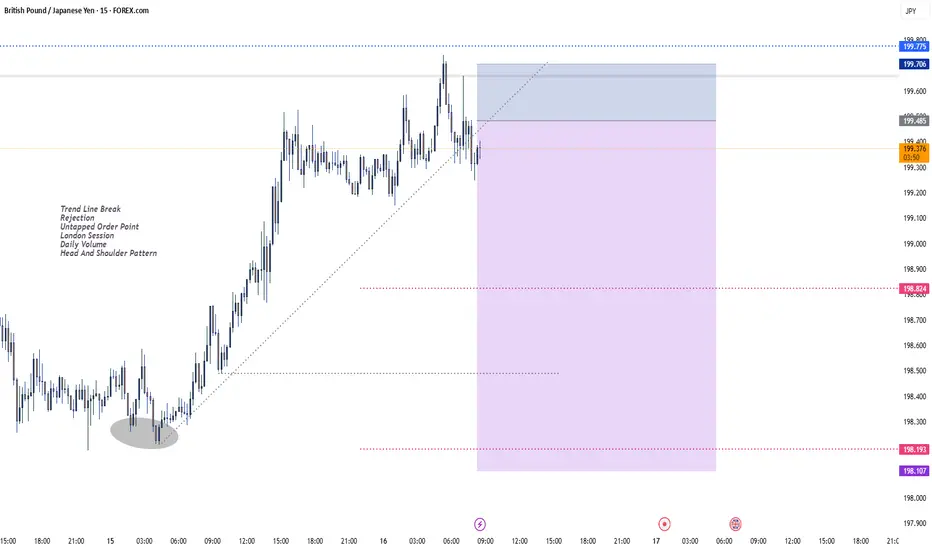
SellTrend Line Break
Rejection
Untapped Order Point
London Session
Daily Volume
Head And Shoulder Pattern
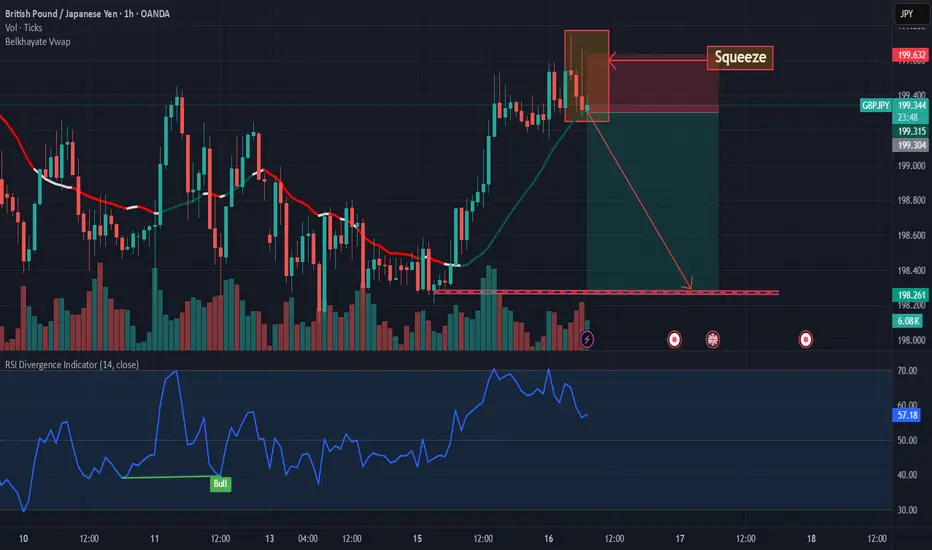
GBPJPY: Squeeze: sell ideaOn GBPJPY as you can see on the chart we would have a hight probability to have a downtrend because we have a squeeze.Thanks.

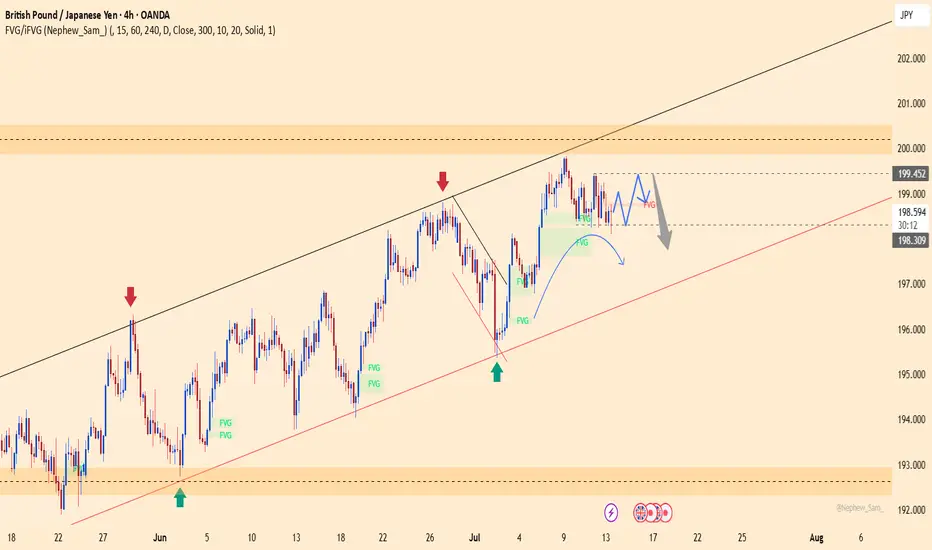
GJ Bullish Shift After Daily FVG MitigationHello Traders,
Hope everyone is having a fantastic week!
Today on GBPJPY, price has shifted the 4-hour swing structure to bullish following the mitigation of the daily Fair Value Gap (FVG)—a strong sign of a change in character (CHoCH). From this point, price may aim for the daily weak buy-side liquidity (BSL). Use your lower time frames (LTF) to identify bullish patterns that support this long trade setup.
GBPJPY is in the Down Trend From Resistance LevelHello Traders
In This Chart GBPJPY HOURLY Forex Forecast By FOREX PLANET
today GBPJPY analysis 👆
🟢This Chart includes_ (GBPJPY market update)
🟢What is The Next Opportunity on GBPJPY Market
🟢how to Enter to the Valid Entry With Assurance Profit
This CHART is For Trader's that Want to Improve Their Technical Analysis Skills and Their Trading By Understanding How To Analyze The Market Using Multiple Timeframes and Understanding The Bigger Picture on the Charts
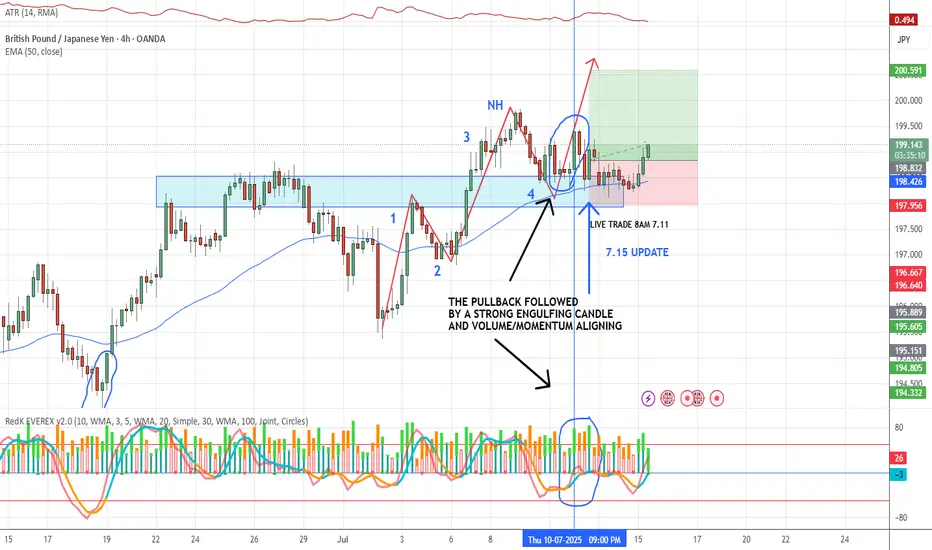
7.15 GBP/JPY LIVE TRADE UPDATEThis is day 3 on this trade. Classic 123 pullback into S/R followed by an engulfing candle, there was a signal on the chart earlier but volume/momentum did not line up so we waited for all indicators to align before hitting the "go" button. We always wait for a new high/low before considering price action as being in a true pullback. We also use the volume indicator alot and rely heavily on it, volume shows the interest this pair has atm. We will keep watching, it should have plenty of room to hit our 2:1 R/R target. What target do you normally go for?

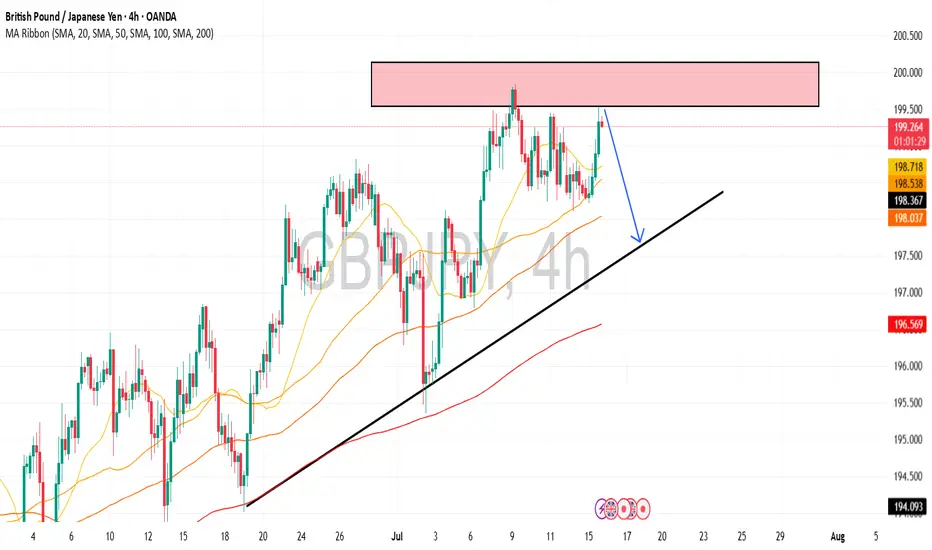
Falling Wedge Formation Ive been bullish on GBPJPY for a couple weeks now and I still believe that it has more upside potential. Here we have a Falling Wedge Formation. we have 4 touches on our pattern already and just waiting for a break and retest to enter again. I am currently in a position based of the retest price gave of the previous resistance (circled on chart). Lets see how it goes.
GBPJPY CONTINUATIONTechnically:
Printing bullish flag
Retrace from 0.382 fib level.
Retest the resistance which became support.
Scenario 1 is based on support became resistance
Scenario 2 based on bullish flag breakout of pole
GBPJPY (SHORT)
GBPJPY broker the trendline and went to resistance level.
Jpy has been weak for 6months (1st half of year) now it will gain strength and jpy pairs to sell.
WHY: It summer holidays so tourist are traveling to Japan strengthening it currency Value.
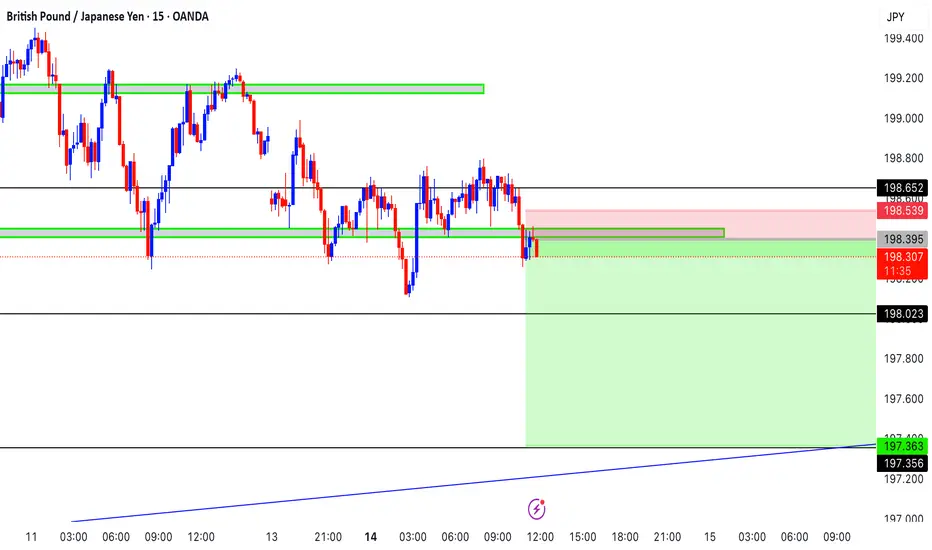
GBPJPY: Downside Pressure Increasing - Sell Opportunity!GBPJPY is showing clear signs of weakness, currently trading around 198.620. If it breaks and holds below 198.300, the bearish trend will be confirmed, with the next potential target at 192.000.
Upcoming key economic news from the UK (inflation, retail sales) and Japan (BOJ policy) will be decisive. Prioritize selling strategies, monitor news closely, and manage risk tightly.
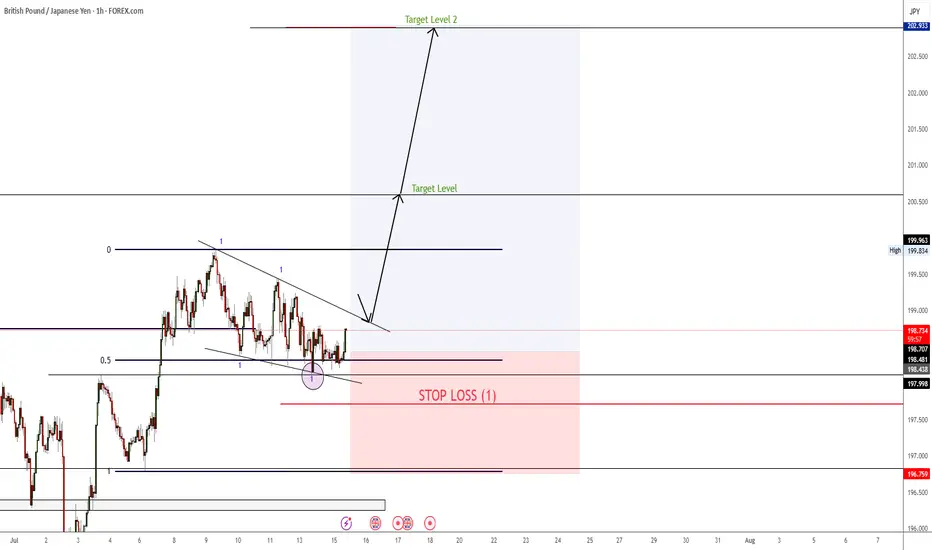
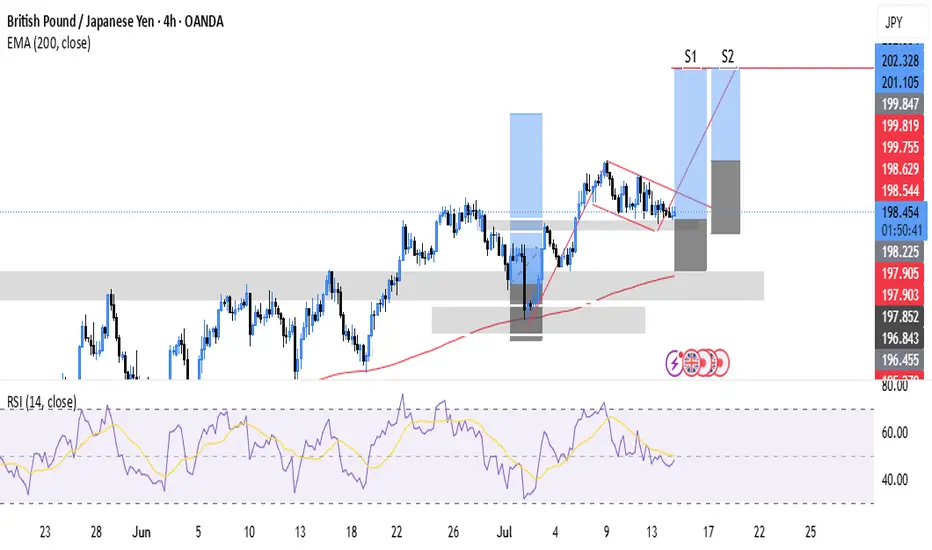
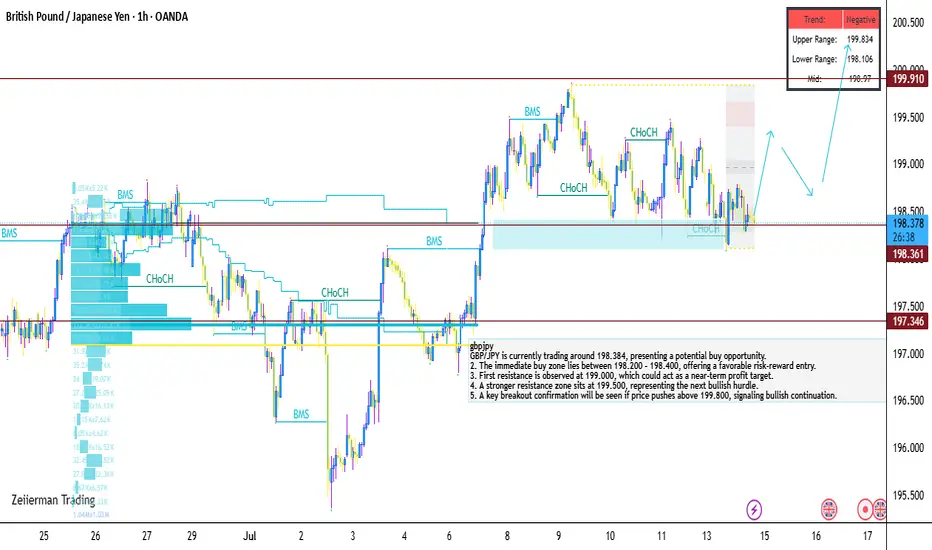
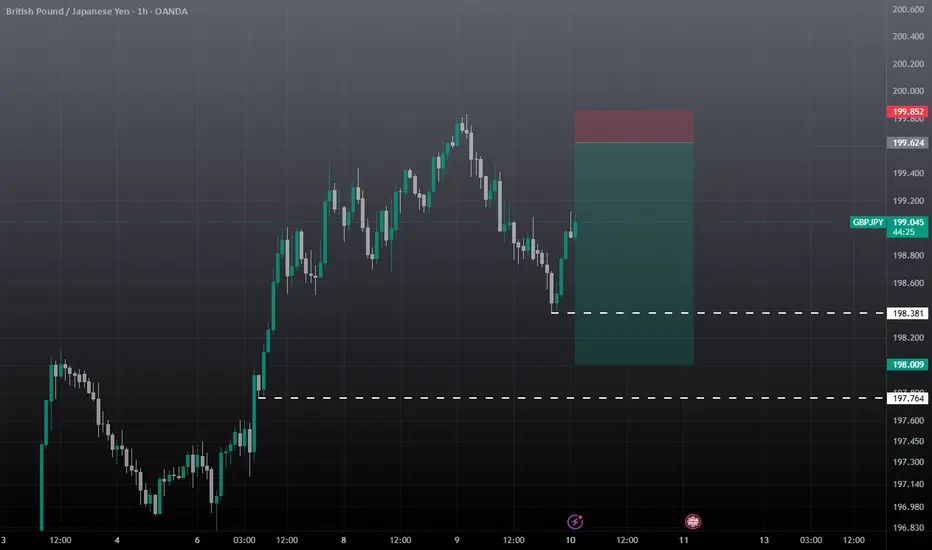
GBP/JPY is currently trading around 198.384, presenting a potentGBP/JPY is currently trading around 198.384, presenting a potential buy opportunity.
2. The immediate buy zone lies between 198.200 – 198.400, offering a favorable risk-reward entry.
3. First resistance is observed at 199.000, which could act as a near-term profit target.
4. A stronger resistance zone sits at 199.500, representing the next bullish hurdle.
5. A key breakout confirmation will be seen if price pushes above 199.800, signaling bullish continuation.
Place your stop-loss below 197.500, as a break below this level would invalidate the bullish setup.
7. The current setup suggests buyers are stepping in near 198.300, respecting the recent support base.
8. Momentum may build up toward 199.00+ if GBP remains strong or JPY weakens further.
9. Price consolidation above 198.50 would strengthen bullish conviction ahead of the breakout zone.
10. Overall, GBP/JPY remains bullish above 197.500, with upside potential toward 199.800 in the short term.
GBPJPY SELLView live British Pound / Japanese Yen chart to track latest price changes. Trade ideas, forecasts and market news are at your disposal as well.
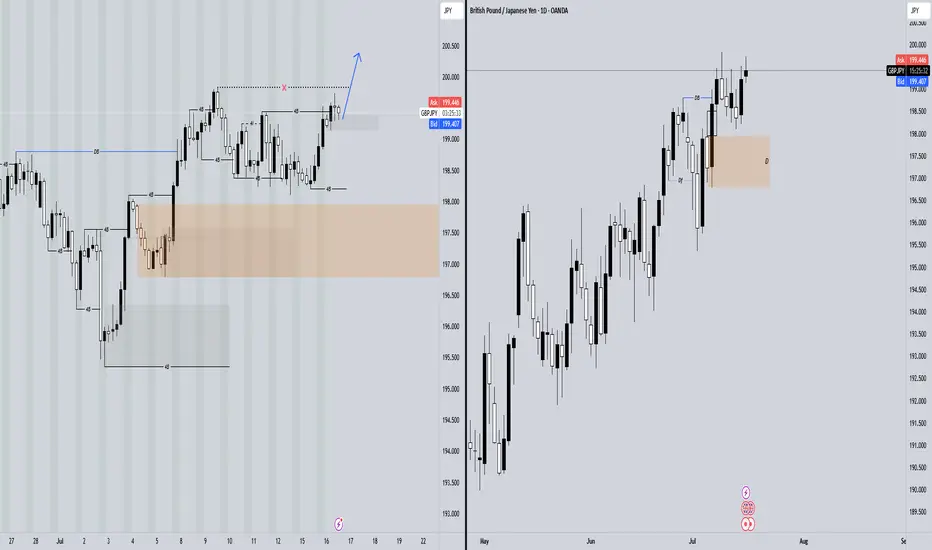
gbpjpy long Hi, I am a bit late but the probabilities are long because the daily trend is bullish and also in a good zone to buy on the level on the image ,of course you need to enter only after your entry pattern has been formed
GBPJPY Swing Trade Setup, Sell, Short SetupA Good RR setup, wait for the entry, when price reaches the poi, look for any weakness ltf and then take trade, we are taking trade on 1hr, so for entry look for 5m tf. I will update the trade status where to take or not!
GBPJPY long Idea In HTF we can clearly see that GJ is in an uptrend, so after having done the last expansion, I am waiting for the retracement to the 50% Fibo zone where by coincidence there is an OB, the price will probably reject in that zone and later "attracted" by the OB which has a FVG in the 70.5% Fibo zone (which I call the "Gold Zone"), the price can retract to that zone and then continue with its uptrend.