GJ Counter Pullback Likely to Daily DemandHello Traders,
On GJ, price remains in a daily counter-trend pullback phase. This has just been confirmed by a 4-hour break and close below the weak swing low (LL). To stay aligned with the overall bullish trend, I’m expecting a deeper pullback into the daily demand zone before price resumes its upward movement.
JPYGBP trade ideas
BUYTrend Line Break
Previous Day Volume
Rejection Point
Untapped Order Point
London Session
High Structure Swing
Gbpjpy long outlookReviewing past price moevembt . Looks like support is holding and can potentially break out of reisistance area and contour moving foaled. Still early… what do you guys think?
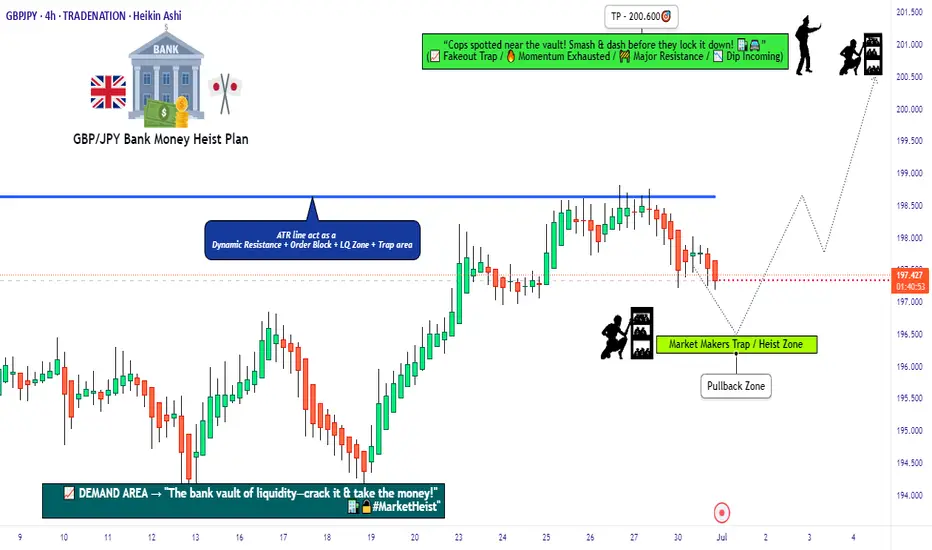
"GBP/JPY: High-Risk Pips Grab – Escape Before Cops! 🏴☠️ GBP/JPY "Dragon Heist" – Bulletproof Bullish Raid (High-Risk, High-Reward) 🚨
🔥 Attention Market Pirates & Profit Raiders! 🔥
(Day/Swing Trade Plan – Long Entry Focused)
🔑 Entry Zone (Vault Cracked!):
"The Dragon’s loot is unguarded! Bullish pullback = prime stealing opportunity."
Buy Limit Orders: Layer entries near 15M/30M swing lows (wick/body). DCA-friendly!
Thief Pro Tip: Scalpers ride long-only waves. Swing traders? Stack slowly, escape rich.
🎯 Target (Escape Routes):
200.600 (or bail early if cops (resistance) swarm!)
🚨 Red Zone = High-Risk Take-Profit (Overbought? Reversal? Police (bears) lurk here!)
⛔ Stop Loss (Emergency Exit):
4H Swing Low/High (Wick-based) – Adjust for risk/lot size!
No martyr trades! SL = your heist survival kit.
📢 Breaking News (Fundamental Edge):
Dragon’s bullish fuel? Macro data, COT reports, sentiment—CHEK THE LIiNKk 👉🔗 (Don’t skip homework!)
💣 Trading Alerts:
News = Landmines! Avoid new trades during releases.
Trailing SL = Your Getaway Car (Lock profits, dodge volatility.)
💥 Boost This Heist!
Smash 👍, hit 🔔, and fund our next raid! Every boost = more stolen pips for the crew.
Stay tuned—another heist drops soon! 🤑 #ForexBandits
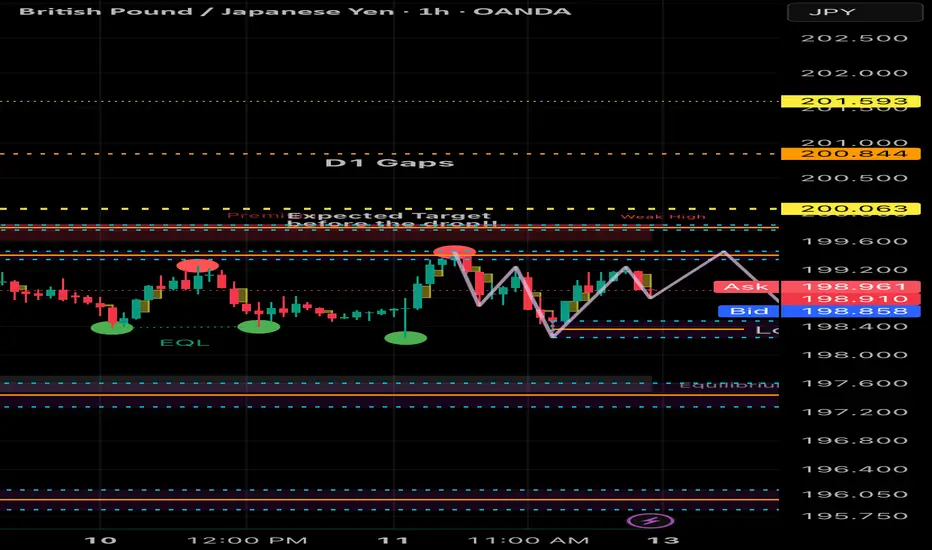
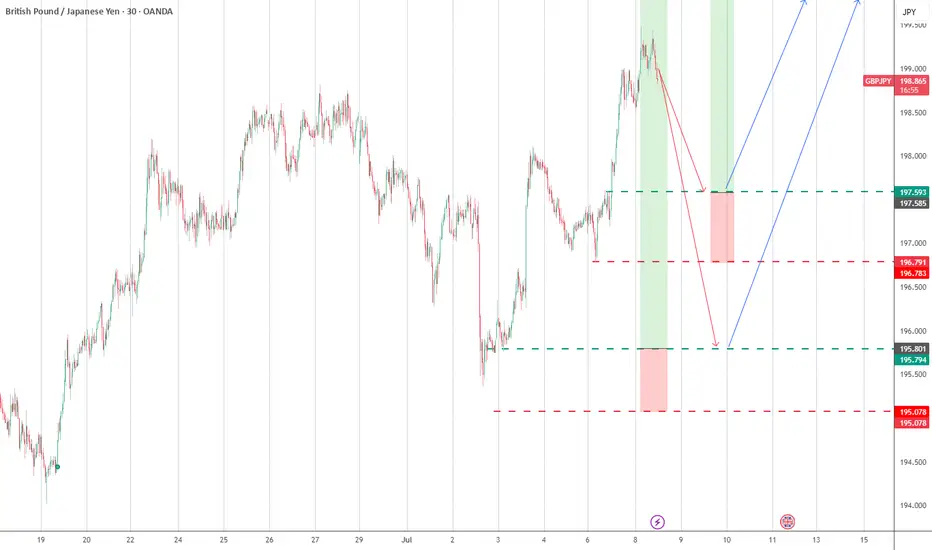
I expect liquidity grab up a bit GJ can make some liquidity grab up to 199.4ish region and reject for a move down to 197.3 region based on 1HR chart..
But overall trend is still bullish .
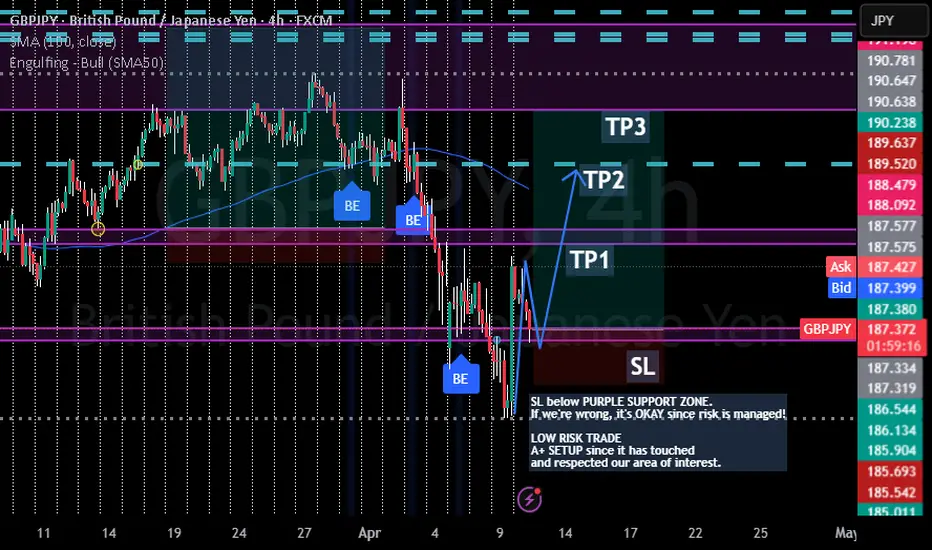
GBP/JPY Low Risk BUYS - SWINGLOW RISK TRADE
If you prefer not to swing you can scalp buys on the pullbacks throughout the week ahead.
GBP/JPY - BULLISH ENGULFING CONFIRMED
A+ SETUP since it has touched
and respected our area of interest.
SL - 185.599
TP1 - 190
TP2 - 192.799
TP3 - 194.681
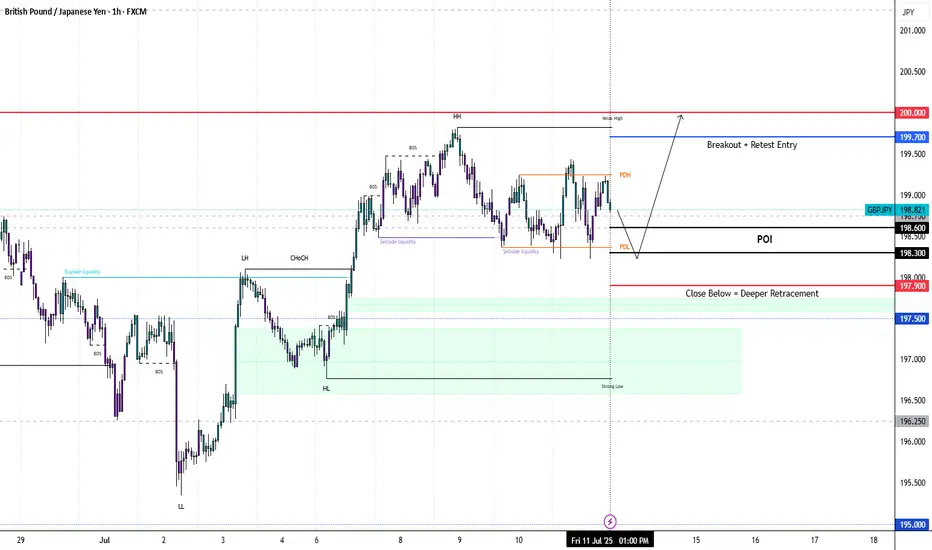
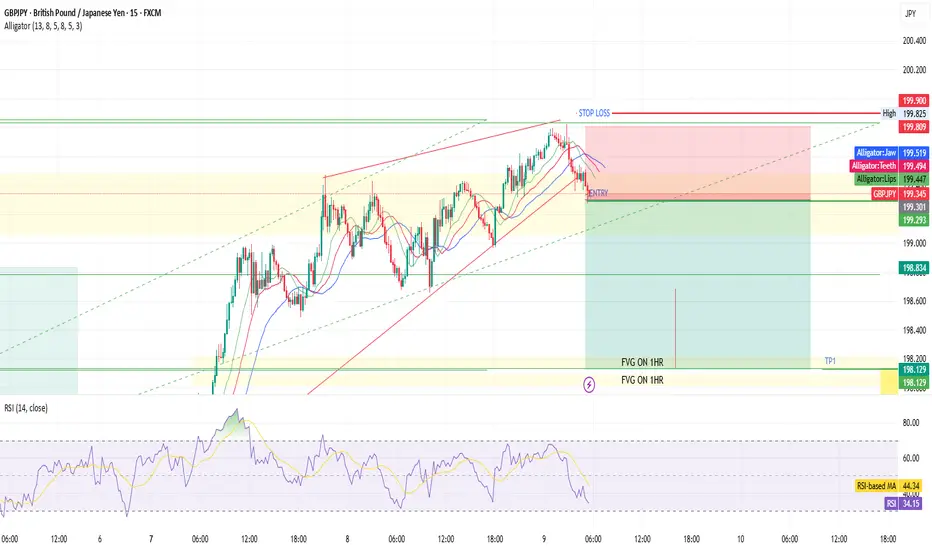
GBPJPY: Bullish Structure Still IntactGJ created a new HH then turned sideways. More consolidation or a deeper pull back could be seen before the next rally.
Last BOS: Break above 199.70 → confirmed bullish strength
H4 Demand Zone (Pullback): 198.30–198.60
Liquidity Above: Clean pools at 200.30 – 200.70
H1 Key Zone: 198.60–198.90 (H1 OB + unfilled FVG) → currently being tested.
Momentum Trigger: BOS above 199.30 to confirm buyers stepping back in.
M15 Micro-Structure: Slightly bearish (short-term), sweeping liquidity under 198.80.
What to Watch: M15 bullish BOS above 199.10–199.30 for intraday buy confirmation.
🟢Entry Zone 198.30 – 198.60
SL 197.90
TP1 199.70
TP2 200.30
TP3 201.00
❌ Bullish Invalidation
H1 close below 197.90 → bullish bias neutralized, expect deeper retrace into 197.20 – 197.50.
GBPJPY SELL IDEA- Weekly chart - Price reached an ATH on the weekly and closed below the major resistance with upward wick rejections - Signal for a downtrend for the new week
- Daily chart - The Last two daily closes (Thurs & Fri) were an inverse bearish pin bar and a weak bullish candle with upward wick rejections
- H4 Chart - Consolidating at the major resistance, but last highs were LHs and LLs
- H1 Chart - Consolidating at the major resistance, but last highs were LHs and LLs
Entry for sells would be break out of the consolidation on H4 and retest on lower Tfs - H1, M30 and M15
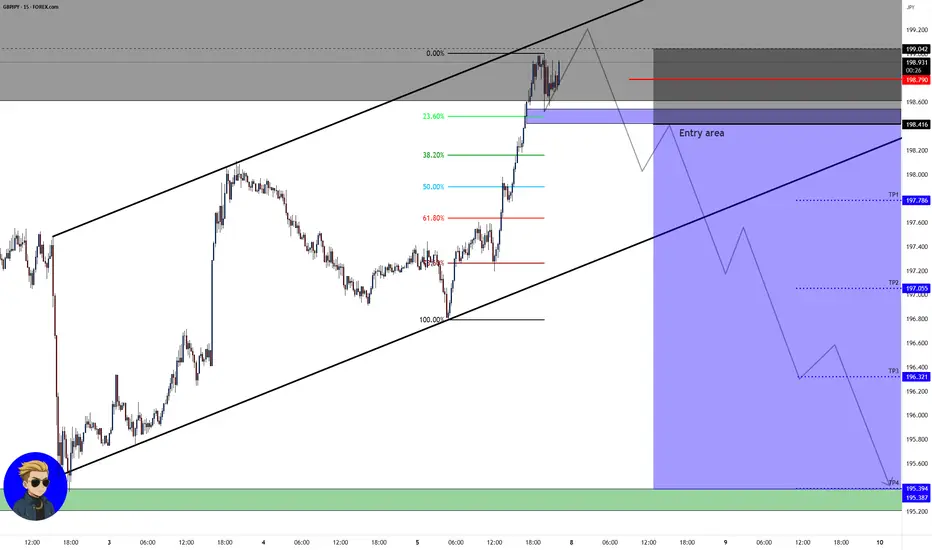
GBP/JPY💰Symbol: { GBP/JPY }
🟩Price: { 198.416 }
🟥Stop: { 199.042 }
1️⃣profit: { 197.786 }
2️⃣profit: { 197.055 }
3️⃣profit: { 196.321 }
4️⃣profit: { 195.394 }
📊Check your chart before entering.
🚨Check before use to make sure there is no important news.🚨
GBPJPY: Still BullishPrice has pulled back and is currently reacting to H1 OB at 197.00–197.20
* FVG Support: Between 196.80–197.10
* Watch for: Bullish BOS above 197.50 to confirm buyers stepping back in
* Confirmation Needed: M15 bullish BOS above 197.50–197.60 for buy entry
🟢Entry: 196.80 – 197.10
Stop Loss: 196.4
TP1: 198
TP2: 198.6
TP3: 200
Breakout Option: If price pushes above 198.30 (M15 BOS + retest), you can enter.
❌ Bullish Bias Invalidation
H1 close below 196.40 → signals potential deeper retracement
GBPJPY TRADE IDEA We are looking at a potential trade to the upside on GBPJPY.
Like always, we await a pullback to our Fibonacci level for a continuation trade.
Let's see how the market plays out.
GBPJPY Short Trade - COT TradeOANDA:GBPJPY Short trade using COT Data - institutional bias, with my back testing of this strategy, it hits multiple possible take profits, manage your position accordingly.
This is good trade, don't overload your risk like greedy, be disciplined trader, this is good trade.
Use proper risk management
Looks like good trade.
Lets monitor.
Use proper risk management.
Disclaimer: only idea, not advice
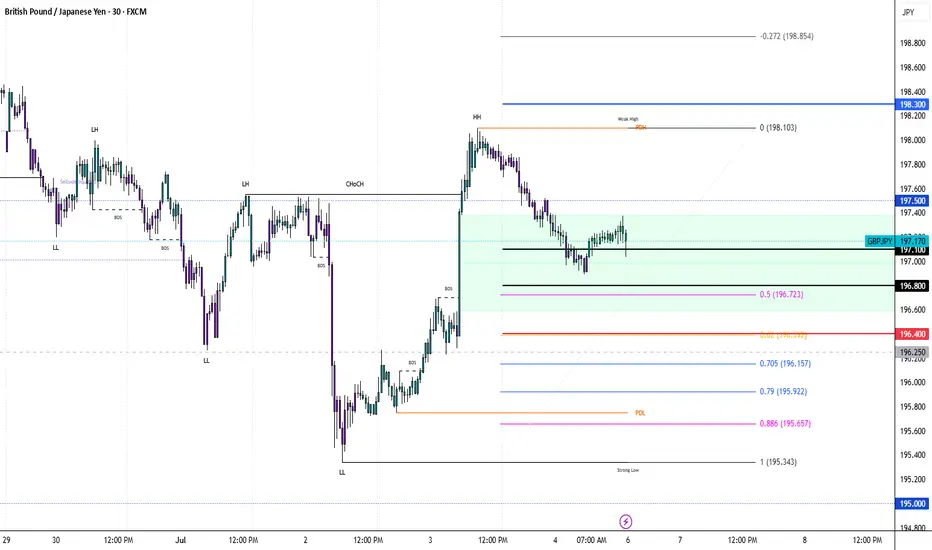
GJ bearslooking for a break of this new support and closure below before entering. daily candle is bearish, and the 4 hr resistance above has been respected.
you can monitor entries on the 30min, again just looking for a candle to close bearish below the zone before entering.
GBPJPY Will Go Lower From Resistance! Sell!
Here is our detailed technical review for GBPJPY.
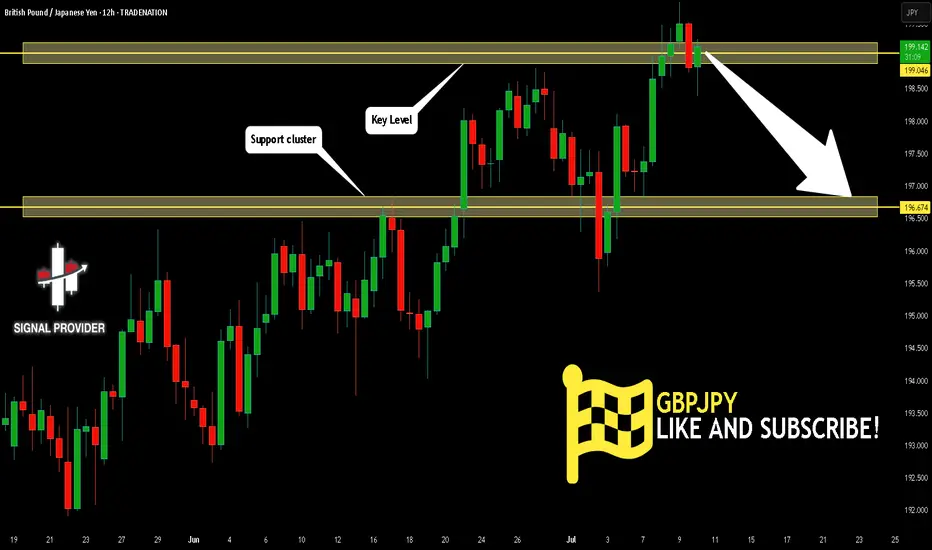
Time Frame: 12h
Current Trend: Bearish
Sentiment: Overbought (based on 7-period RSI)
Forecast: Bearish
The market is trading around a solid horizontal structure 199.046.
The above observations make me that the market will inevitably achieve 196.674 level.
P.S
Overbought describes a period of time where there has been a significant and consistent upward move in price over a period of time without much pullback.
Disclosure: I am part of Trade Nation's Influencer program and receive a monthly fee for using their TradingView charts in my analysis.
Like and subscribe and comment my ideas if you enjoy them!
GBP/JPY 2HOURS BULISH ANALYSISThe image shows a laptop screen displaying a trading platform, specifically the TradingView website. The platform is open to a chart for the British Pound/Japanese Yen (GBPJPY) currency pair, with a 2-hour time frame selected.
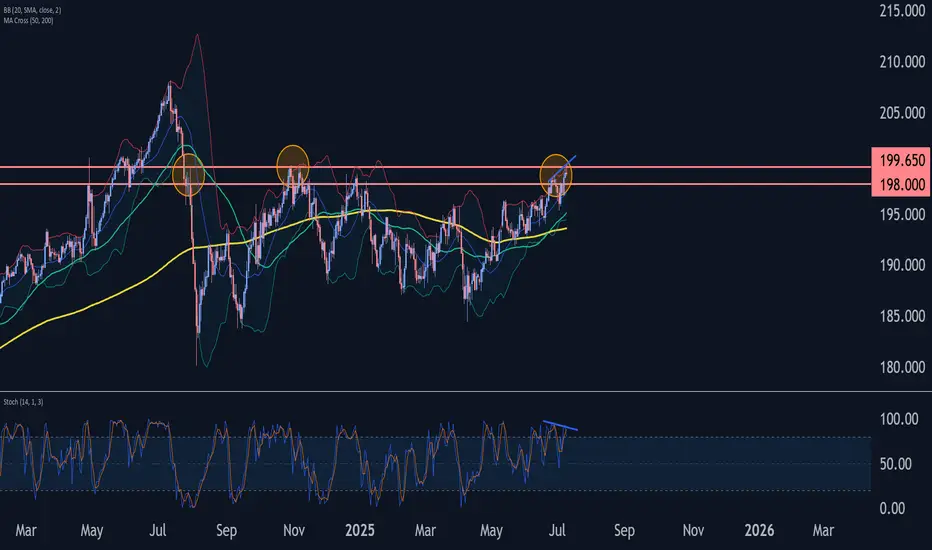
GBPJPY Wave Analysis – 9 July 2025- GBPJPY reversed from long-term resistance level 199.65
- Likely to fall to support level 198.00
GBPJPY currency pair recently reversed from the strong long-term resistance level 199.65 (former strong resistance from October, November and July) standing near the upper daily Bollinger Band.
The downward reversal from the resistance level 199.65 is likely to form the daily Shooting Star reversal pattern.
Given the bearish divergence on the daily Stochastic indicator and the strength of the resistance level 199.65, GBPJPY currency pair can be expected to fall to the next support level 198.00.
GBP JPY SCALPING TRADEDTF HH to HL , Dtf my bias is from bullish side GJ is at resistance level
My Target on Dtf HH to HL 0.382 Fib level tp
1 HR FVG Gap + Divergence
15 Min Scalping Entry + Cambist Comfirmation
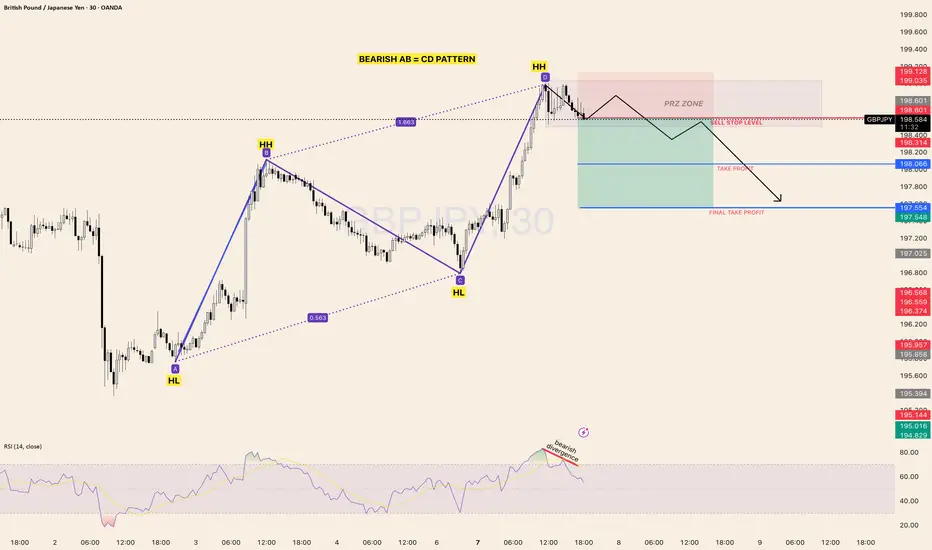
GBP/JPY BEARISH AB = CD PATTERN Potential Short Opportunity fromMarket Structure
Price formed a Higher High (HH) and is now completing a Bearish AB=CD harmonic
pattern
The Potential Reversal Zone (PRZ) has been tapped
RSI shows bearish divergence at the second HH, suggesting weakening bullish
momentum
Technical Details:
Pattern: Bearish AB=CD with clear symmetry
Key zone: PRZ between 198.684 and 199.128
Bearish RSI divergence adds extra confluence
Potential Sell Stop strategy below structure for safer entry confirmation
Bias Bearish (Pattern Completion + Divergence)
Short bias is activated only on the confirmation, either by sell-stop break or strong
rejection candles inside PRZ
If the price breaks above 199.128, the bearish setup is invalidated
Trade Plan
Action Level / Condition
Sell Entry Below 198.684 (Sell Stop Trigger Zone)
Stop Loss Above 199.128 (invalidation of PRZ)
Target 1 198.066
Final Tp 197.564
✅ Wish you best of luck and happy trading!
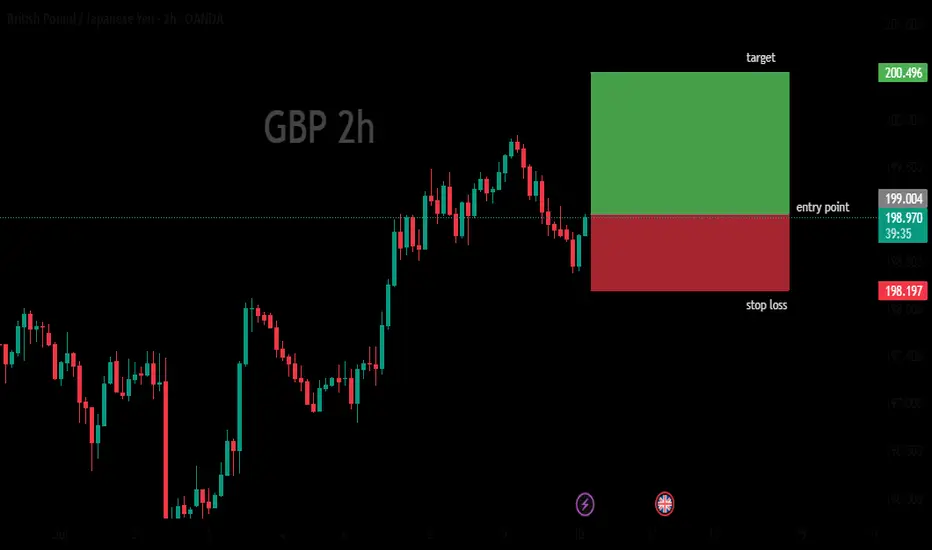
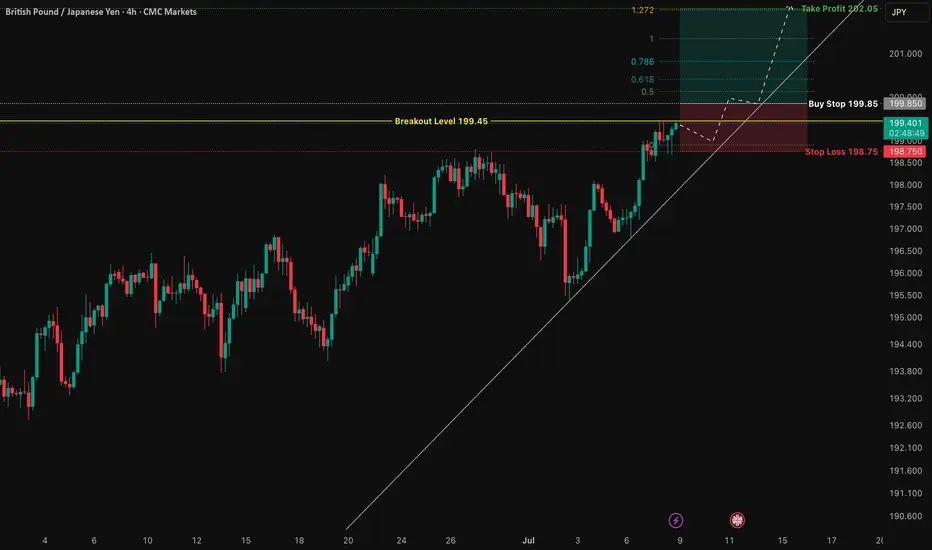
GBP/JPY: Total Confluence Targeting 202.05 BreakoutThis is a high-conviction trade setup based on a powerful confluence of fundamental drivers and multi-timeframe technical alignment. We are anticipating a bullish breakout in GBP/JPY, catalyzed by the upcoming UK GDP data release. The price action has formed a classic "coiled spring" pattern, indicating a significant buildup of energy before a potential move higher.
The analysis is based on pure price action, structure, and macroeconomics. The chart is kept intentionally clean to highlight the strength of the setup itself.
The Fundamental Why 📰
Two core data-driven factors underpin this trade:
1️⃣ Macro Policy Divergence: The primary long-term driver is the stark monetary policy difference between a relatively hawkish Bank of England (BoE), which is still fighting inflation, and an ultra-dovish Bank of Japan (BoJ). This fundamental imbalance creates a natural tailwind for GBP/JPY.
2️⃣ Positive Leading Indicators: Recent economic data from the UK has shown surprising strength. Both the Services and Manufacturing PMIs for June beat expectations, suggesting underlying resilience in the economy. This points to a higher probability of an upside surprise in Friday's GDP figures, which would be the direct catalyst for a breakout.
The Technical Picture 📊
Our confidence comes from a rare "Total Confluence," where every timeframe tells the same bullish story.
The Monthly Chart (Strategic View): Shows a powerful, multi-year uptrend that has decisively broken the critical 8-year resistance from the 2015 highs. The macro trend is undeniably bullish.
The Weekly Chart (The Confirmation): Confirms the uptrend is resuming now after breaking out of a year-long bullish continuation pattern. The "resting" phase appears to be over.
The 4-Hour Chart (The Setup): This is the "coiled spring." Price is consolidating in a very tight range right underneath the key breakout level of 199.45. This shows a lack of sellers and a buildup of buying pressure.
Fibonacci Confluence: Our take profit target is not random. It aligns perfectly with the 1.272 Trend-Based Fibonacci Extension, giving us objective, mathematical confirmation for the target at 202.05.
The Trade Plan ✅
This is a "set and forget" breakout strategy. The order should be placed as a Buy Stop to capture the momentum as it breaks higher.
📉 Asset: GBP/JPY
👉 Entry (Buy Stop): 199.85
⛔️ Stop Loss: 198.75
🎯 Take Profit: 202.05
🧠 Risk/Reward: 1:2
This analysis is for educational purposes. Always conduct your own research and manage your risk appropriately. Good luck.
gbpjpyLet’s take a look at the #GBPJPY pair. Despite continuing in a clear uptrend confirmed by the weekly close and the start of this week, I wouldn’t rush into buying at the current levels just yet. 🚀📈
On the chart, I’ve marked two potential entries with different zones to watch. We’ll need to see if the price pulls back to these areas and finds support before considering a position. 🔍📉
As always, these setups are not fully confirmed, so it’s better to approach them with caution—either by using smaller position sizes or by ensuring that the combined risk of both trades does not exceed what you would risk on a single trade. ⚠️📊
Managing your risk carefully and waiting for a clearer confirmation can help protect your capital and maximize your chances of success. Patience and discipline remain key! 💪💼
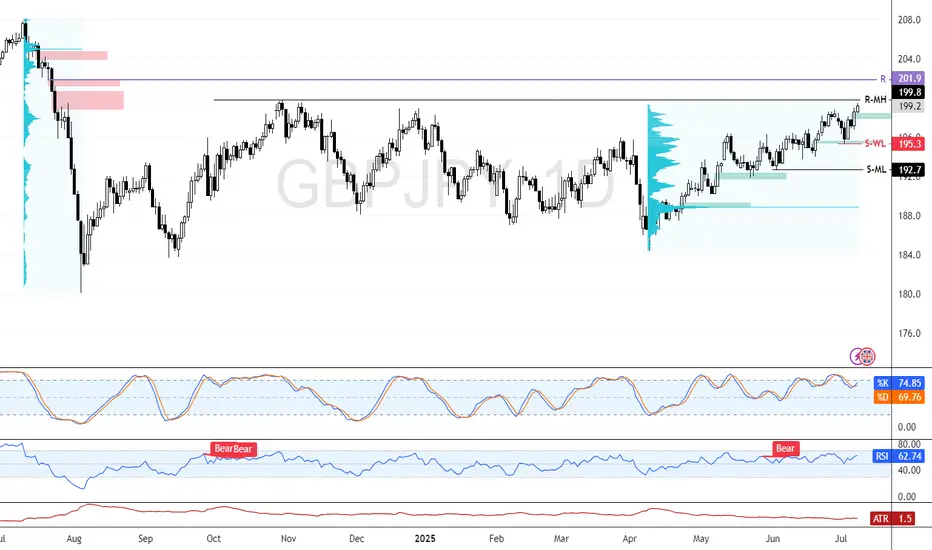
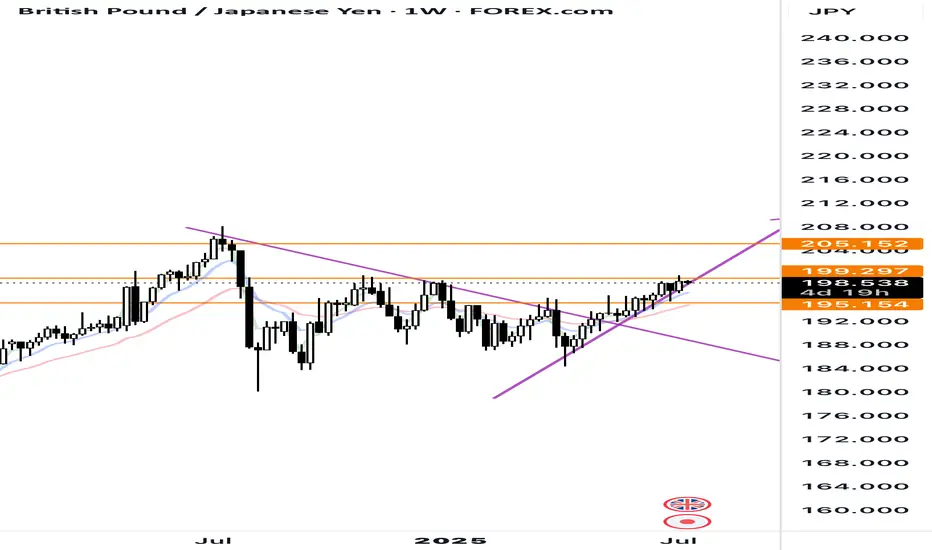
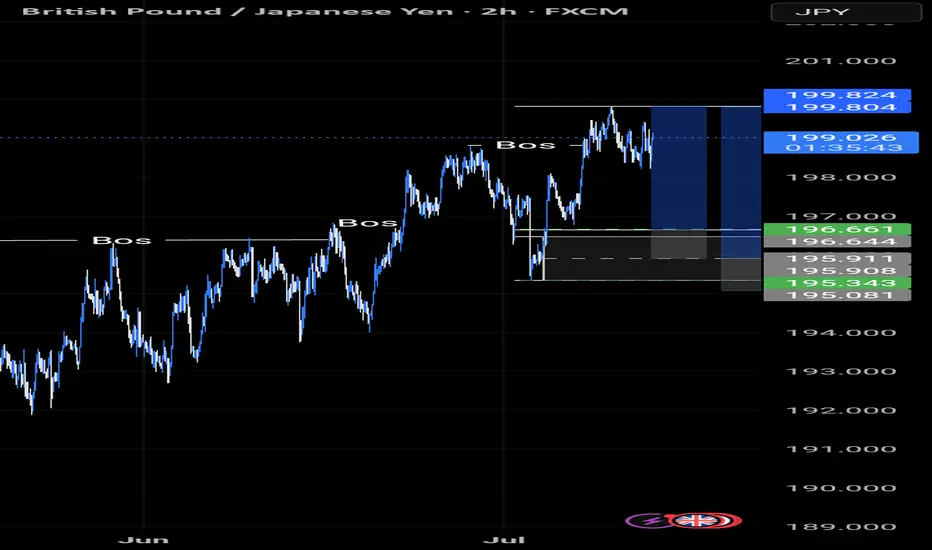
GBP/JPY Faces Critical Supply Zone Near 199.8 Monthly High GBP/JPY hit the monthly high resistance at 199.8, a level backed by a bearish fair value gap from July 2024. The pair now trades near 199.2, just below this zone.
With supply levels extending to 201.9, a decline toward the weekly support at 195.3 is expected if selling pressure builds.