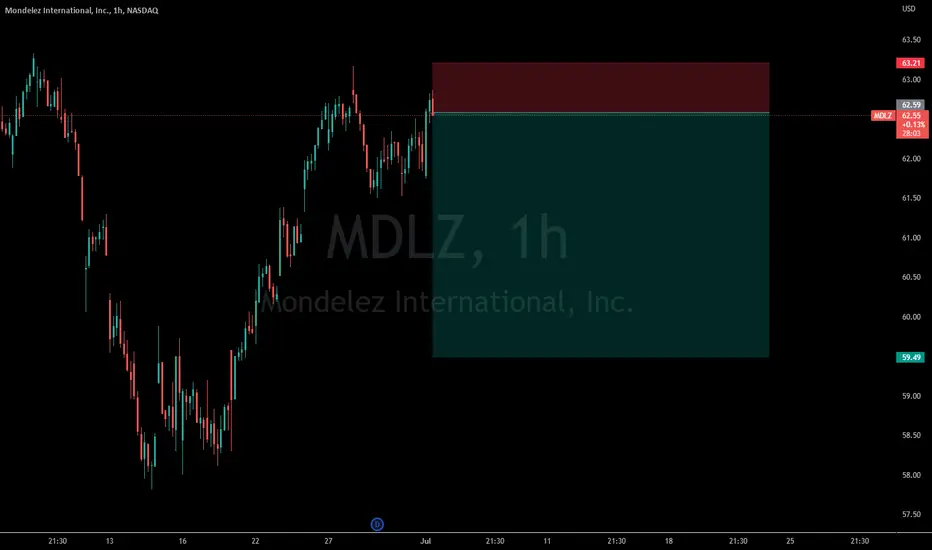
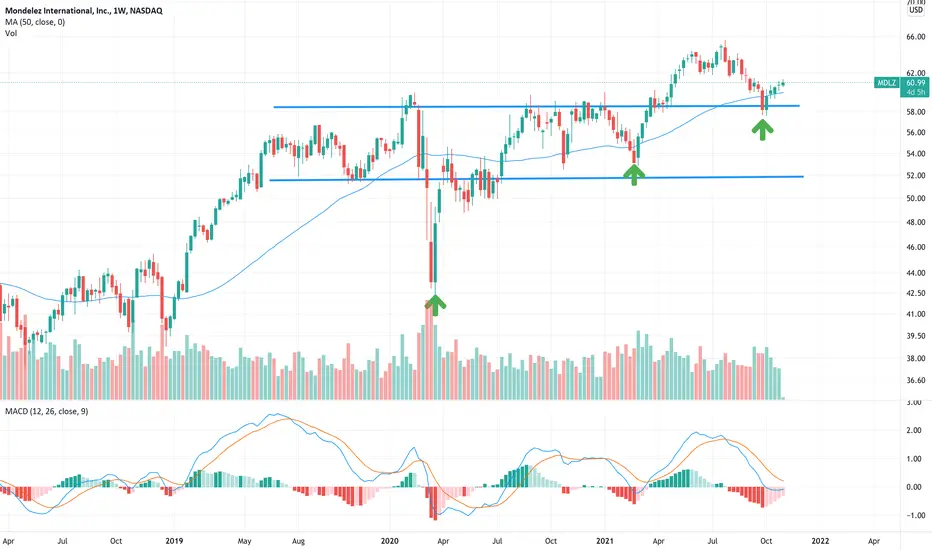
Seeing a possible blow off on Mondelez. MDLZMondelez is in an upgoing zigzag. Just confirmed through passing the most recent high. I like to draw channels to guide my Fib projections and other things, never mind in this case that we are overbought - every single is situational. That is why trading is more than a science, but an artform.
We are not in the business of getting every prediction right, no one ever does and that is not the aim of the game. The Fibonacci targets are highlighted in green with invalidation in red. Confirmation level, where relevant, is a pink dotted, finite line. Fibonacci goals, it is prudent to suggest, are nothing more than mere fractally evident and therefore statistically likely levels that the market will go to. Having said that, the market will always do what it wants and always has a mind of its own. Therefore, none of this is financial advice, so do your own research and rely only on your own analysis. Trading is a true one man sport. Good luck out there and stay safe.
1MDLZ trade ideas
$MDLZ with a Neutral outlook following its earnings #Stocks The PEAD projected a Neutral outlook for $MDLZ after a Negative over reaction following its earnings release placing the stock in drift C with an expected accuracy of 100%.

$MDLZ with a Bullish outlook following its earnings #Stocks The PEAD projected a Bullish outlook for $MDLZ after a Positive over reaction following its earnings release placing the stock in drift B with an expected accuracy of 84.62%.
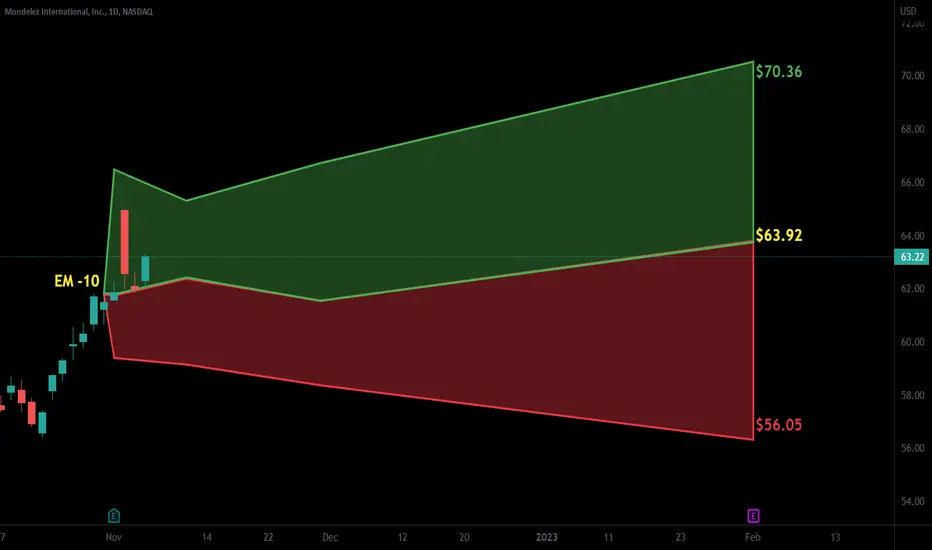
$MDLZ with a Bullish outlook following its earnings #Stocks The PEAD projected a Bullish outlook for $MDLZ after a Positive over reaction following its earnings release placing the stock in drift B with an expected accuracy of 84.62%.
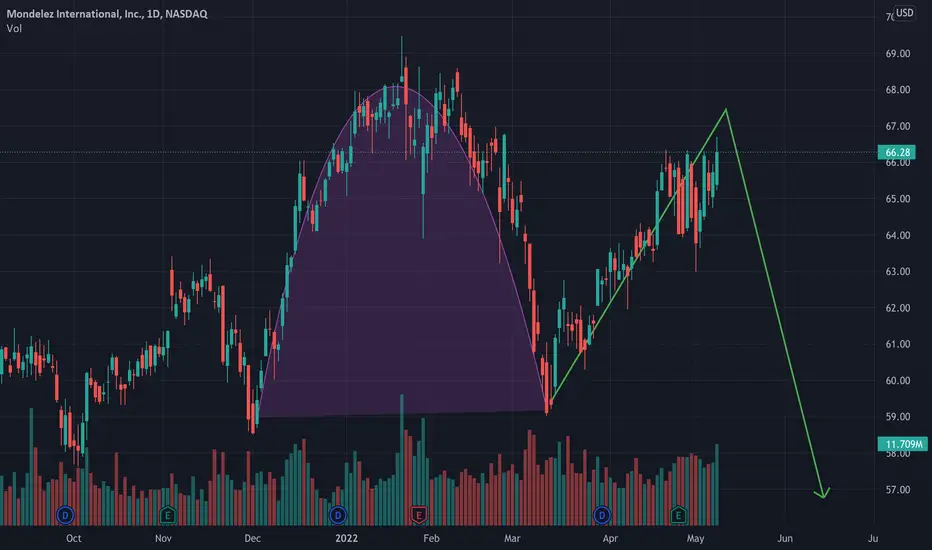
Strong buy suggestions - but about to tank?MDLZ although has weathered some of the most significant bearish price action amongst other large cap companies has formed an inverted cup and handle chart pattern on the 1D time frame. Could power through this pattern, but....only time will tell
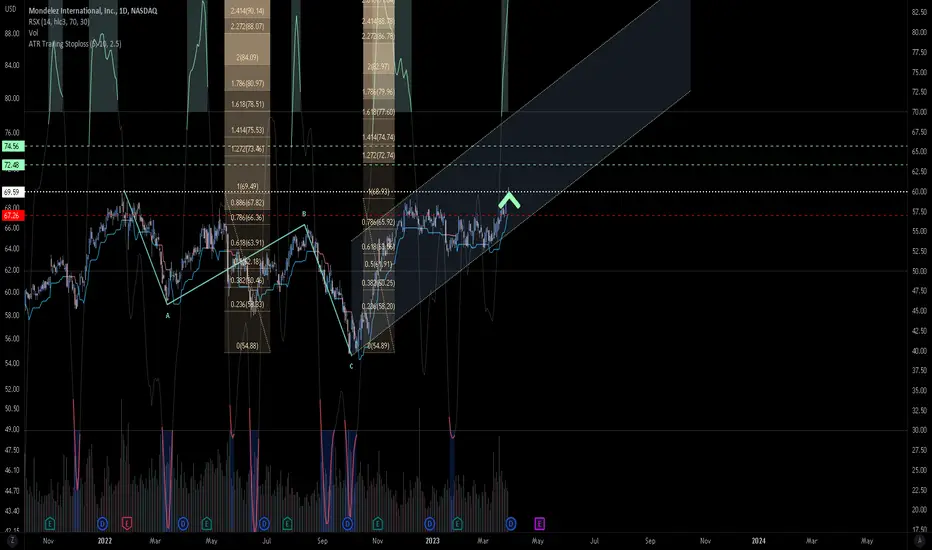
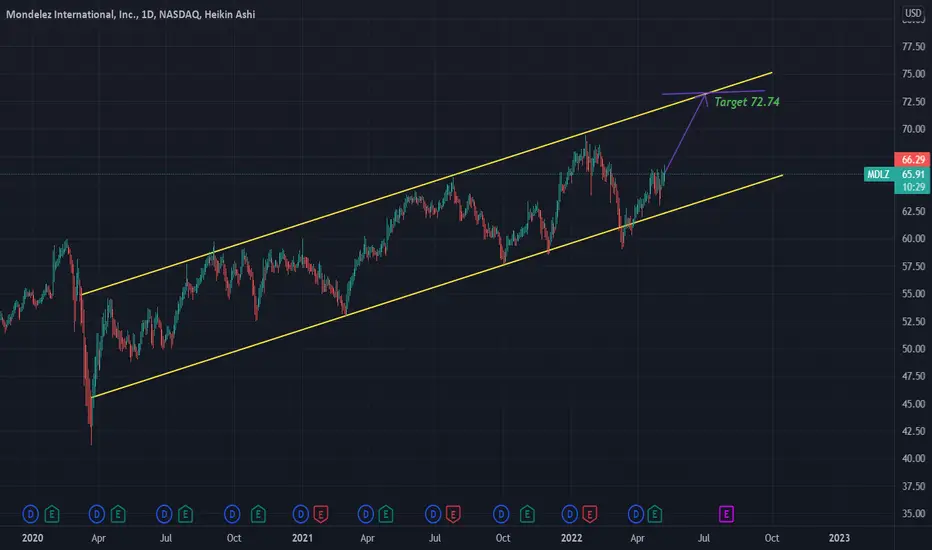
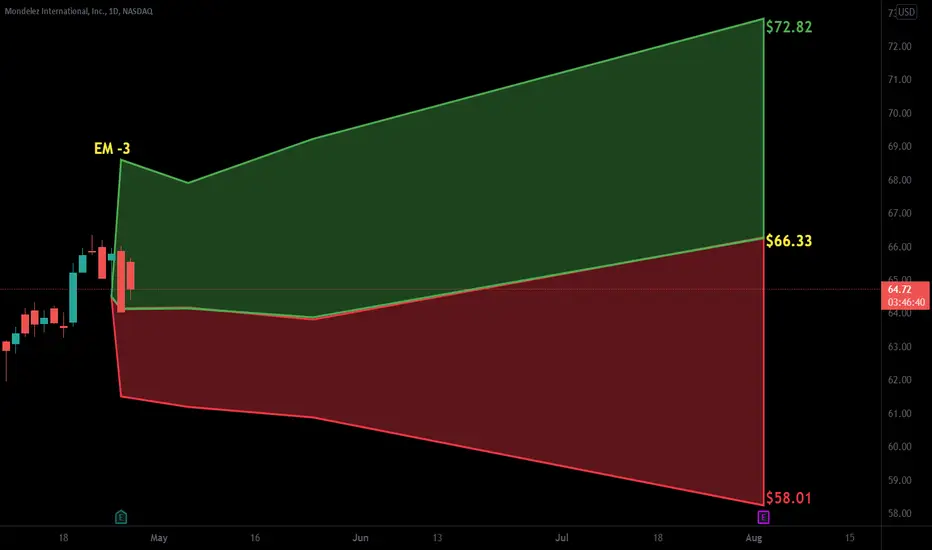
Mondelez Int. Long positionWe can see this stock movement in bullish channel. Next target would be at 72.74. The trend line is also moving towards making a new high with consistent green candles sticks.
MDLZ OREO #MDLZ Very interesting chart and stock.
68% gains since March 2020.
Brands such as Cadbury, Toblerone, Oreos and more.
Potential H & S Target Pre-COVID levels shown on chart.
#stock #StockMarket #trading #chartpatterns

MDLZ RECOMMENDATION FROM THE GIRLFREINDSoon as I charted it I found it hard not to find the H & S on the DTF lol.
If it plays out target is PRE-COVID LEVELS.
NFA.

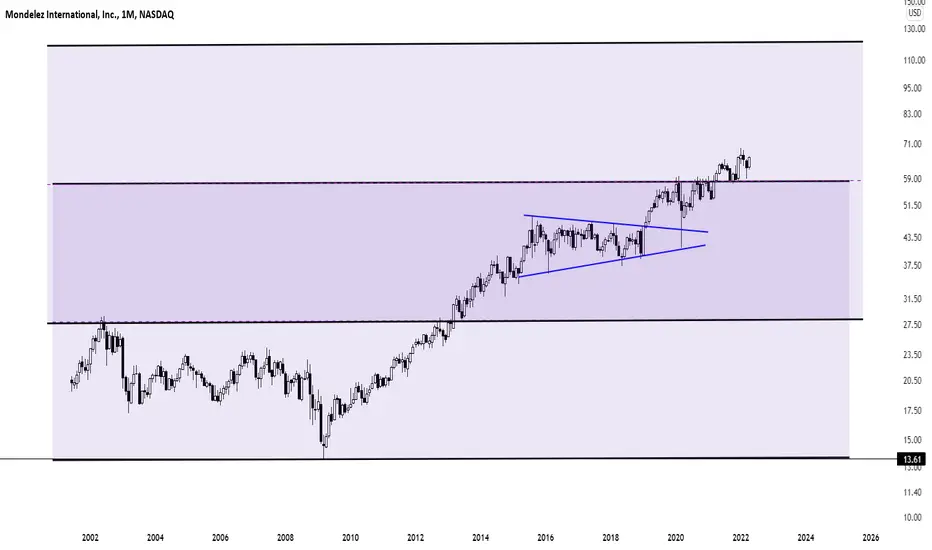
Long term hold, MDLZDuring time of uncertain, upheaval, plus global inflationary situation,
Staple sector always thrive without fail.
Simply because human need food to survive.
After a quick screen of the confectioners stocks,
Mondelez stands out amongst other stocks.
Extremely stable without much fluctuation and correction for the 1Q of March.
Future target is 120, unfortunately this could take 5 years.
Please do take note this is only my research and SHOULD NOT BE considered as a solicitation to buy or sell this stock.
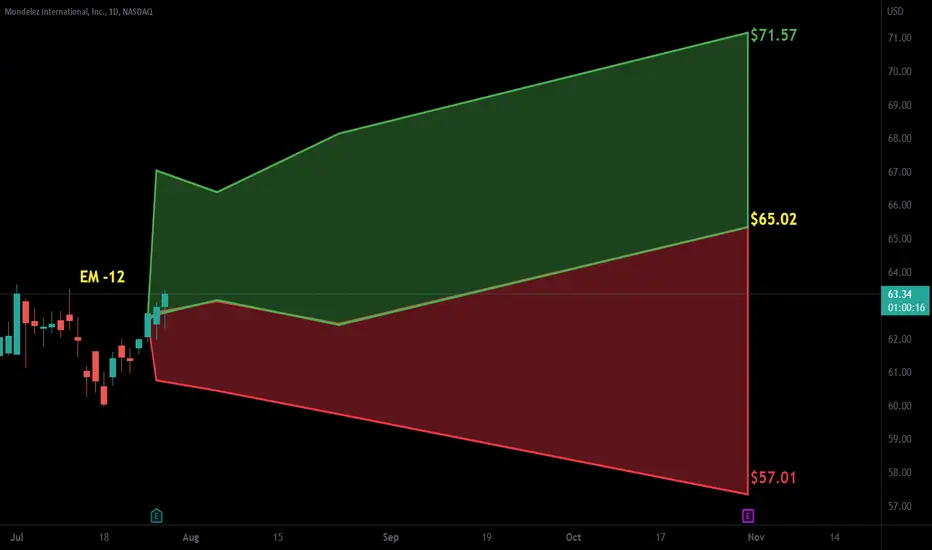
$MDLZ with a Bullish outlook following its earnings #Stocks The PEAD projected a Bullish outlook for $MDLZ after a Positive over reaction following its earnings release placing the stock in drift B with an expected accuracy of 83.33%.
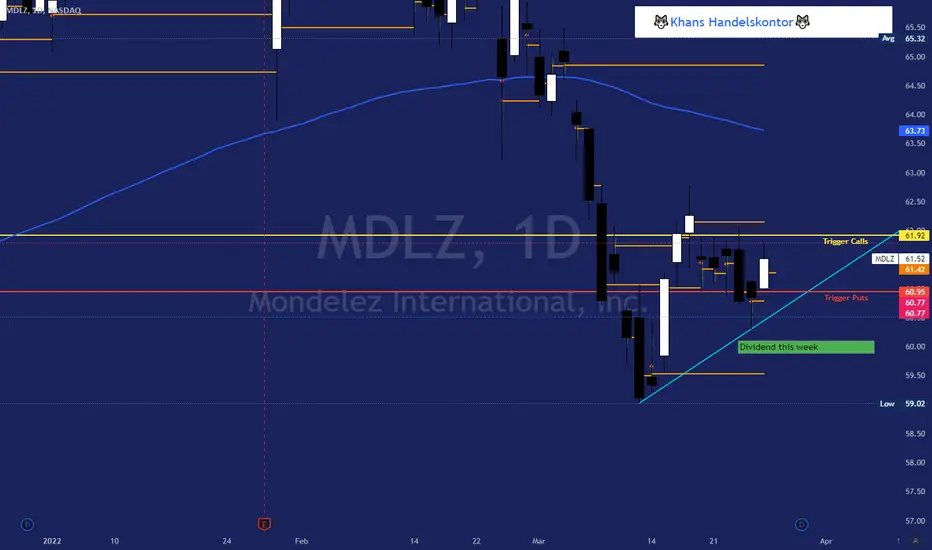
Khans Scalping-Idea - 02/28/22 - $MDLZIn a consolidation area, tends to be a bit more on the bullish side. Dividends on Wednesday - Historically a good sign for the chart.
$MDLZ with a Neutral outlook following its earnings #Stocks The PEAD projected a Neutral outlook for $MDLZ after a Negative over reaction following its earnings release placing the stock in drift C with an expected accuracy of 100%.
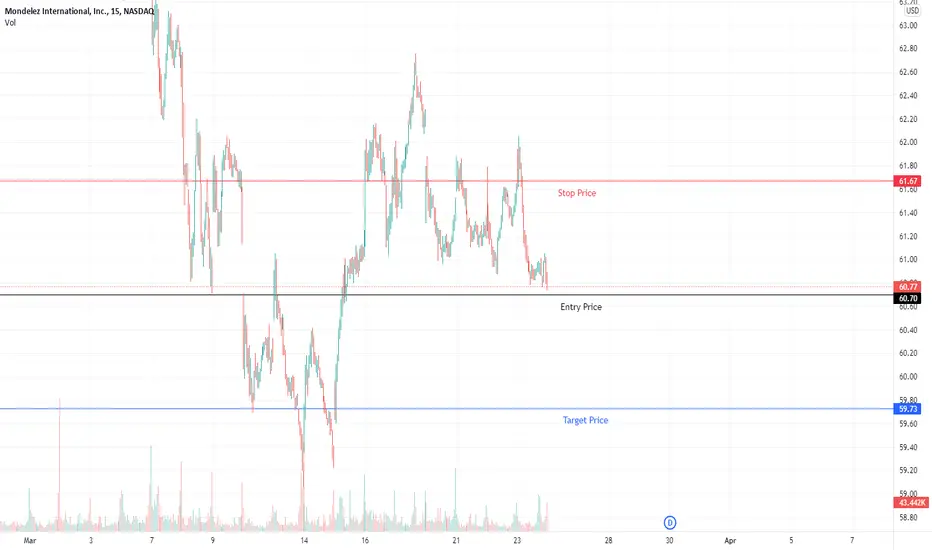
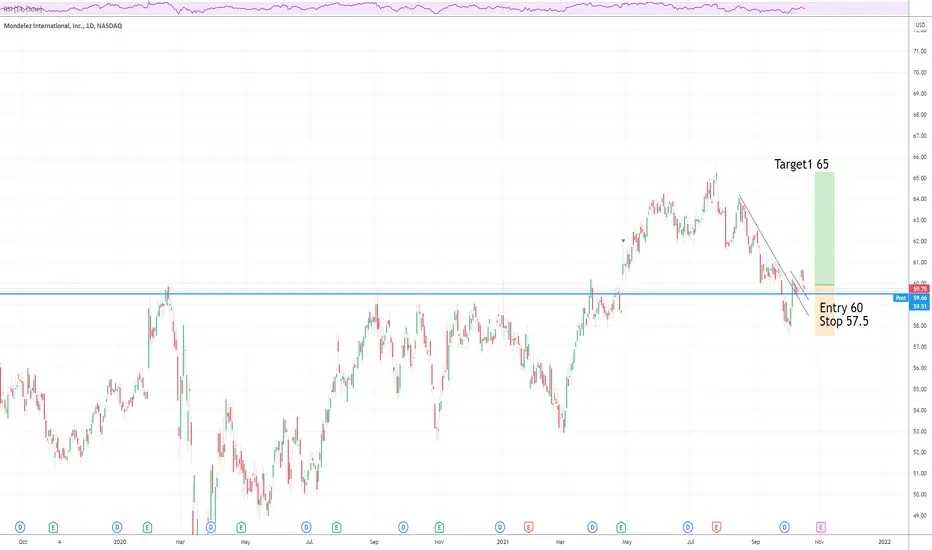
MDLZ LongTrendline break
At support Zone
Entry 60
Stop 57.5
Target 65
Risk management is much more important than a good entry point.
The max Risk of each plan should be less than 1% of an account.
I am not a PRO trader. I trade option to test my trading plan with small cost.
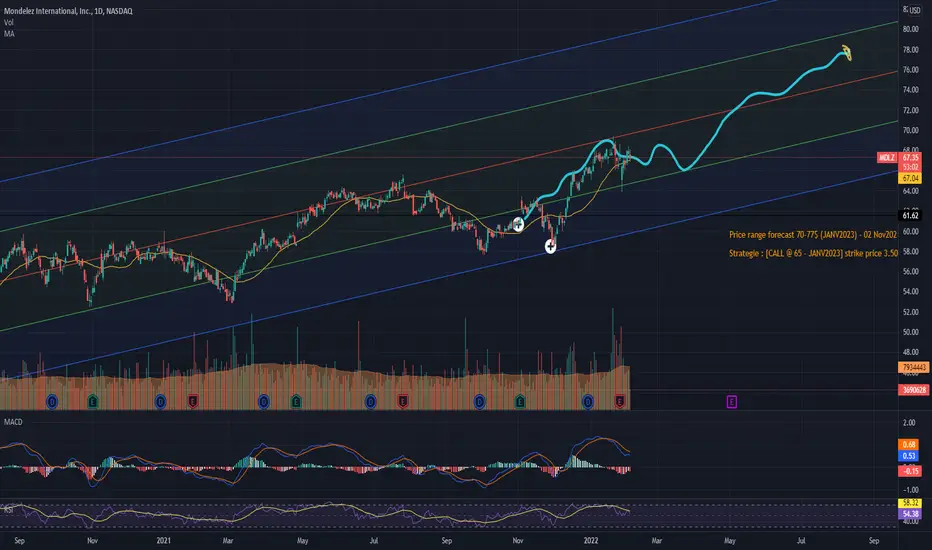
MDLZ is going in the 70's rangeMDLZ will continue to OUTPERFORM SPY for the foreseeable future. Consider LEAP option for JANV2023 when the price reach the lower band of the pitchfork.
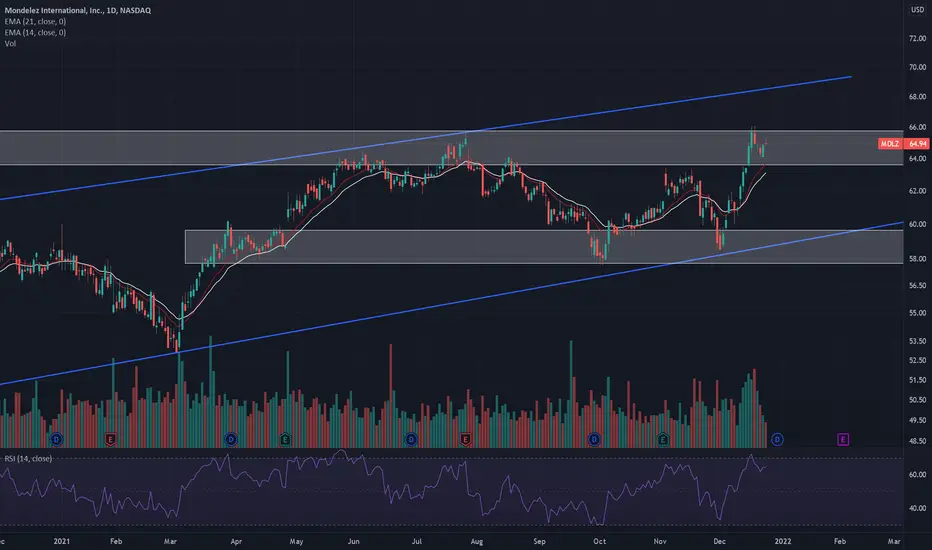
MDLZ might break resistance and go up soonMDLZ has been trading in an upwards channel for quite a while now. It looks like it's currently in a resistance zone leading to a potential breakout. I personally think it would be too early to enter right now but it could be interesting to watch for a potential breakout movement happening soon. Feel free to let me know what you think about this idea!
$MDLZ with a Bullish outlook following its earnings #Stocks The PEAD projected a Bullish outlook for $MDLZ after a Positive over reaction following its earnings release placing the stock in drift B with an expected accuracy of 81.82%.
If you would like to see the Drift for another stock please message us. Also click on the Like Button if this was useful and follow us or join us.
MDLZ: Bounces of Consolidation ResistanceMDLZ consolidation looks to be completed and now is prepared for a long breakout upward
- Pushed off the resistance line (after BU)
Mondelez International: Short term up5th wave has stalled at a weak support zone, minor increase in buyer volume, possible buy trade. Previous batch of trades has closed except AMZN still running. (BABA-0.6%, UPS-1%, V-2%, AXP+1.5%, MAR+1.5%, SBUX+3%, WFC+0%)
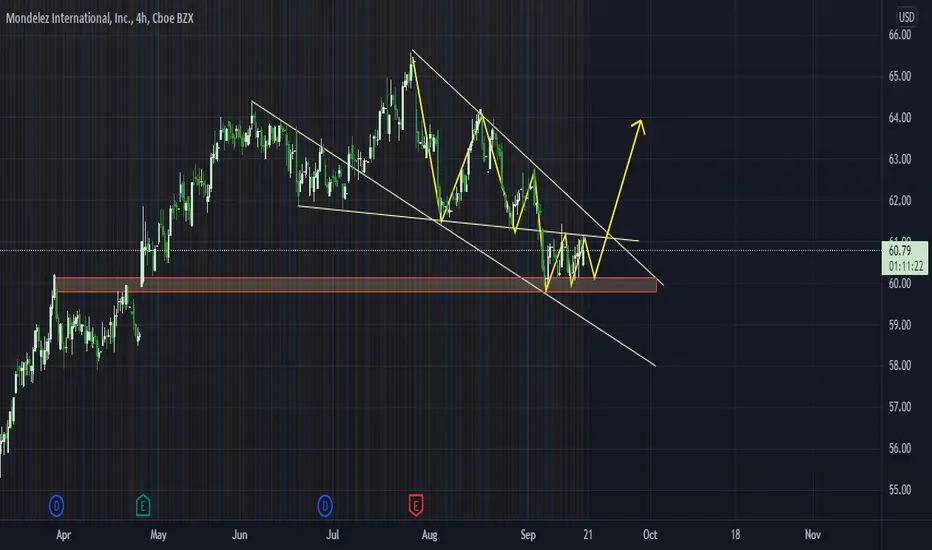
The Flag Pattern is 100% ready on MDLZ Today, we will speak about Mondelez International. Let's check what we can see on the chart:
a) The major structure is an ascending channel, where the price is about to make content with. There we expect a bullish reaction
b) Currently, we can observe a flat pattern that is 100% ready. From a technical perspective, flat patterns are continuation structures which means that after the confirmation breakout, we tend to observe movements in the same direction as the previous impulse.
c) Based on this context, we have defined an activation level (green horizontal line). The idea here is: IF the price reaches the activation level, we will expect a bullish movement towards the Fibo Targets. The maximum target is the higher trendline of the expanding channel
d) If the price keeps falling and breaks the ascending channel, we will cancel our view. Also, if the price reaches the activation level, we will define an invalidation level below the flag pattern.
e) The expected duration of the bullish movement is between 150 and 200 days
f) Another important element is the confluence between the ascending channel and the support/resistance level where we expect the Flag Pattern to be finished and not surpass that area (otherwise, we will consider that the pattern has failed)
Thanks for reading!
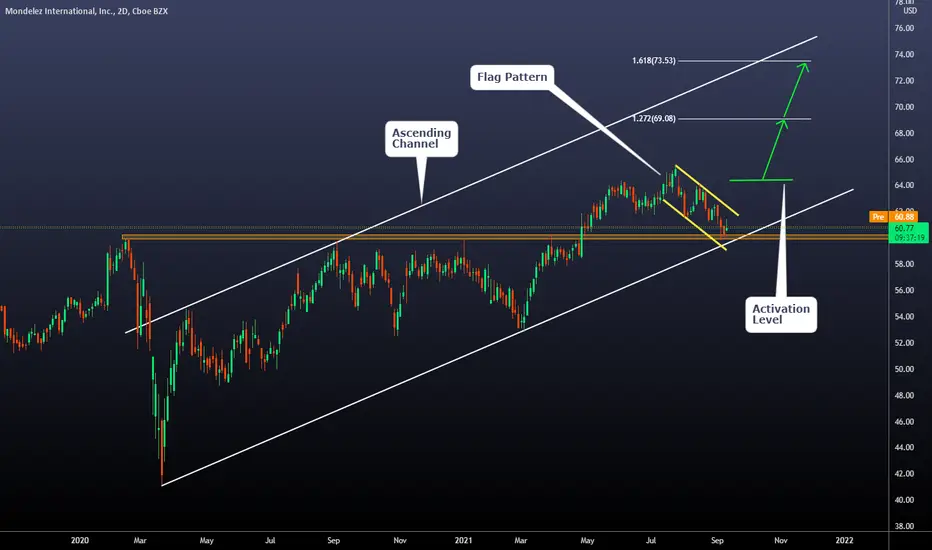
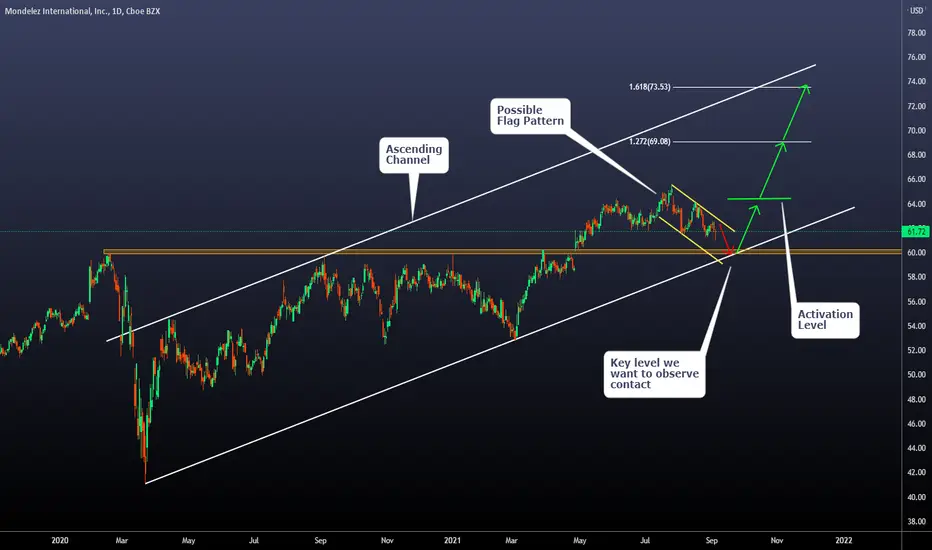
How we will trade MDLZ. Full explanationToday we will speak about Mondelez International.
Let´s see the conclusions we can make on the chart:
a) The price is inside an ascending channel
b) Currently, the price is close to a key support/resistance level which makes convergences with the ascending channel
c) That's a key level we want to observe contact. That would mean for us that the current Flag Pattern is perfect
d) If that happens, we want to observe a bounce. The green horizontal line represents our activation level, where we think it's a confirmation of the bullish movement. The main target we will use is the 2nd fibo extension level which is the same as the higher trendline of the expanding channel.
e) the First level of the fibo extension in our experience is a good place to move the stop to the entry-level if reached. (risk-free situation)
f) The risk we will take on this setup is 1% of our trading account on the stop loss area.
g) This movement can take between 150 - 200 days.
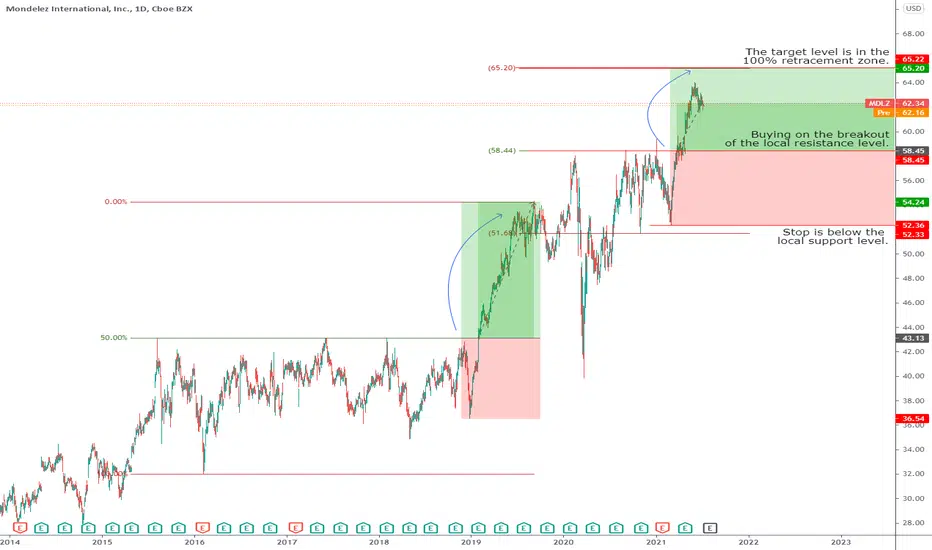
MDLZ: Breakout of the range up.The range resistance level has been broken upwards with the minimum target at 65.20.