III | Elliott Wave Projection - Corrective A Possible Breakout?Price action and chart pattern trading
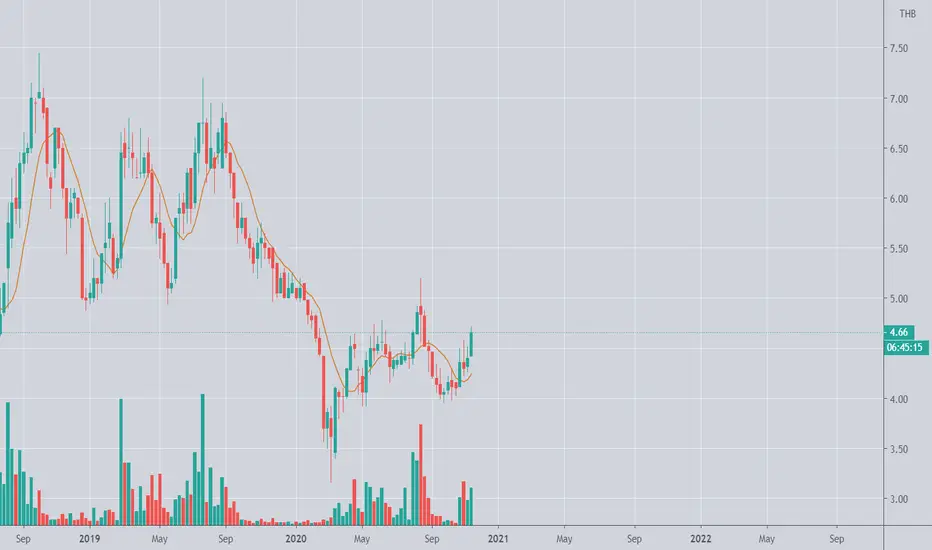
> Elliott Wave projection - a possible breakout of corrective wave A position at 0.618 retracement of previous wave 5.
> Target Wave B zone estimated at 0.618-0.786 of the current wave A uptrend + 15 - 18% upside again
> Stoploss at the lowest wave A position
0.56 THB
441.41 M THB
2.40 B THB
About TRIPLE I LOGISTICS PUBLIC CO LTD
Sector
Industry
CEO
Tipp Dalal
Website
Headquarters
Bangkok
Founded
1991
ISIN
TH8127010R11
FIGI
BBG00HLTVZX7
Triple I Logistics Public Co. Ltd. engages in the provision of logistics services. It operates through the following segments: Air Freight, Sea and In-Land Freight, Logistics Management, Chemical and Hazardous Goods Logistics, and Other Management Services. The Air Freight segment acts as an air freight forwarder, both local and overseas, for airlines, and provides related services, including warehouse management services at airports. The Sea and In-Land Freight segment operates as a sea and in-land freight forwarder, both local and overseas. The Logistics Management segment offers logistics services both air and sea for local and overseas. The Chemical and Hazardous Goods Logistics segment provides services for sea, air, rails, and in-land, both local and overseas, including warehouse management and distribution for chemical and hazardous goods. The Other Management Services segment focuses on office rental and other management services. The company was founded in 1991 and is headquartered in Bangkok, Thailand.
Related stocks

III | Target for uptrend | Previous High BreakoutIII | Thailand SET Index | Transportation Sector | Price Action | Chart Pattern
Estimated Target for Uptrend - Previous High Breakout Pattern
> Strong volume support with downtrend rejection candlestick - clearing previous ATH selling force
> Substantial Banker Volume support
> Banker Fund Flow RS

See all ideas
Summarizing what the indicators are suggesting.
Oscillators
Neutral
SellBuy
Strong sellStrong buy
Strong sellSellNeutralBuyStrong buy
Oscillators
Neutral
SellBuy
Strong sellStrong buy
Strong sellSellNeutralBuyStrong buy
Summary
Neutral
SellBuy
Strong sellStrong buy
Strong sellSellNeutralBuyStrong buy
Summary
Neutral
SellBuy
Strong sellStrong buy
Strong sellSellNeutralBuyStrong buy
Summary
Neutral
SellBuy
Strong sellStrong buy
Strong sellSellNeutralBuyStrong buy
Moving Averages
Neutral
SellBuy
Strong sellStrong buy
Strong sellSellNeutralBuyStrong buy
Moving Averages
Neutral
SellBuy
Strong sellStrong buy
Strong sellSellNeutralBuyStrong buy
Displays a symbol's price movements over previous years to identify recurring trends.