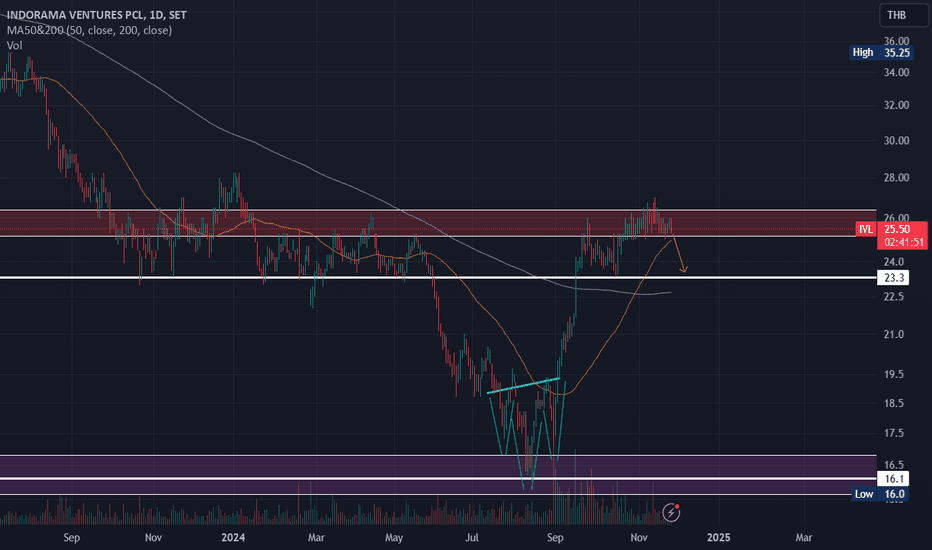
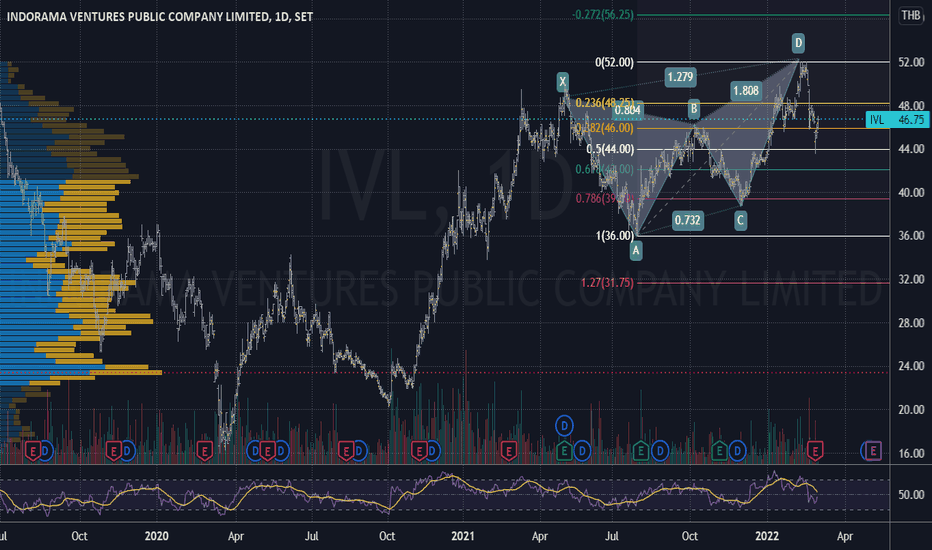
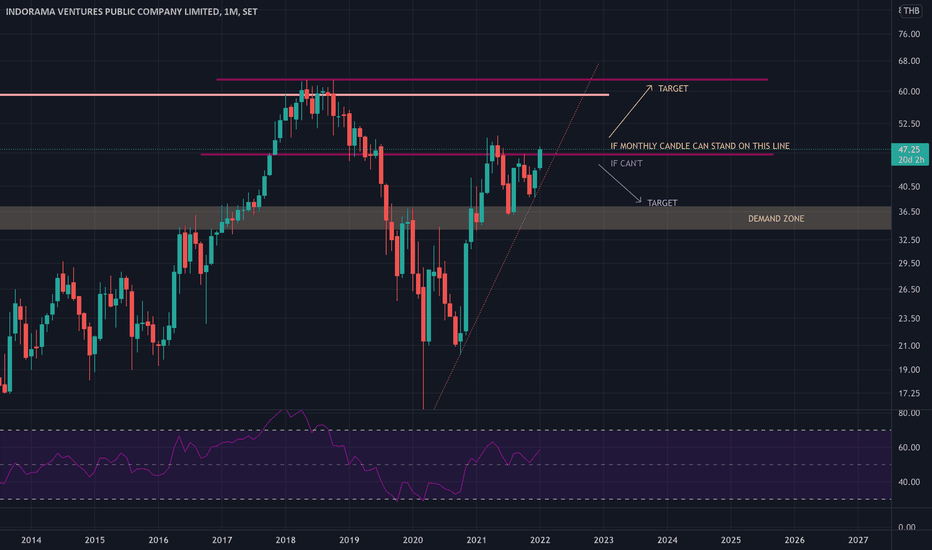
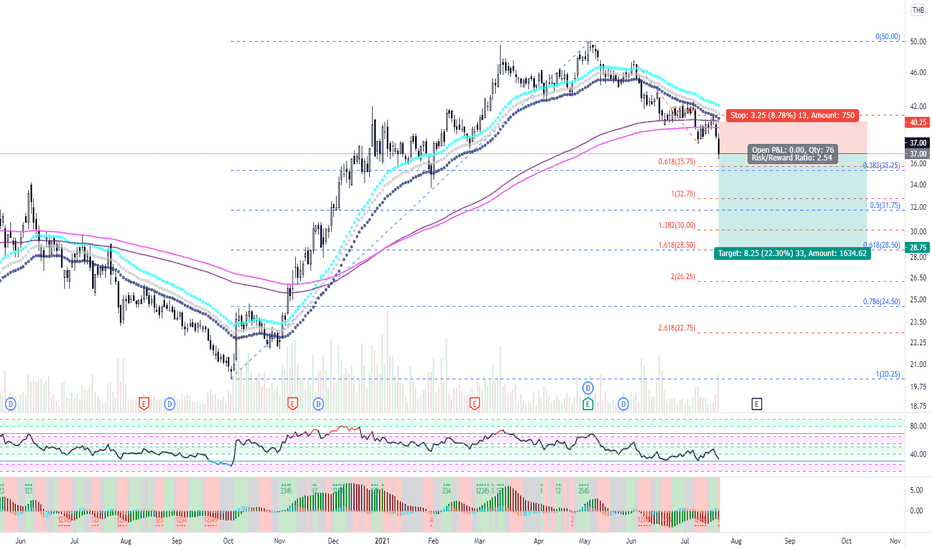
Indorama Ventures PCL ( IVL ) cooling off after big gainsMonstrous rally off of an inverted head and shoulders support. Banking a +- 70 % gain over a 3-4 month period.
Stock seems to be cooling off now, which might indicate some profit taking in order to protect those gains.
No position, with a neutral view. I'll be Watching for downside pressure and
Next report date
—
Report period
—
EPS estimate
—
Revenue estimate
—
−4.1 THB
−20.47 B THB
541.58 B THB
About INDORAMA VENTURES PCL
Sector
Industry
CEO
Aloke Lohia
Website
Headquarters
Bangkok
Founded
1994
ISIN
TH1027010R10
FIGI
BBG000Q41B15
Indorama Ventures Public Co. Ltd. is a holding company, which engages in the manufacture and distribution of Polyethylene Terephthalate (PET), Purified Terephthalic Acid (PTA), Paraxylene (PX), recycling, Purified Isophthalic Acid (PIA), Naphthalene Dicarboxylate (NDC), PET preforms and packaging, Integrated EG, Integrated purified EO, PO/MTBE, Integrated Surfactants comprising EOA, LAB and others, Fibers including Polyester, Rayon, Nylon, Polypropylene, composites and worsted wool fibers products. It operates through the following segments: Combined PET, Integrated Oxides and Derivatives, and Fibers. The Combined PET segment manufactures and distributes PET value chain, specialty chemicals, and PET preforms and packaging. The Integrated Oxides and Derivatives segment produces integrated EG, purified EO, PO/MBTE, and surfactants. The Fibers segment manufactures and distributes polyester, rayon, nylon, polypropylene, composites, and worsted wool fibers. The company was founded by Aloke Lohia on February 21, 2003 and is headquartered in Bangkok, Thailand.
Related stocks
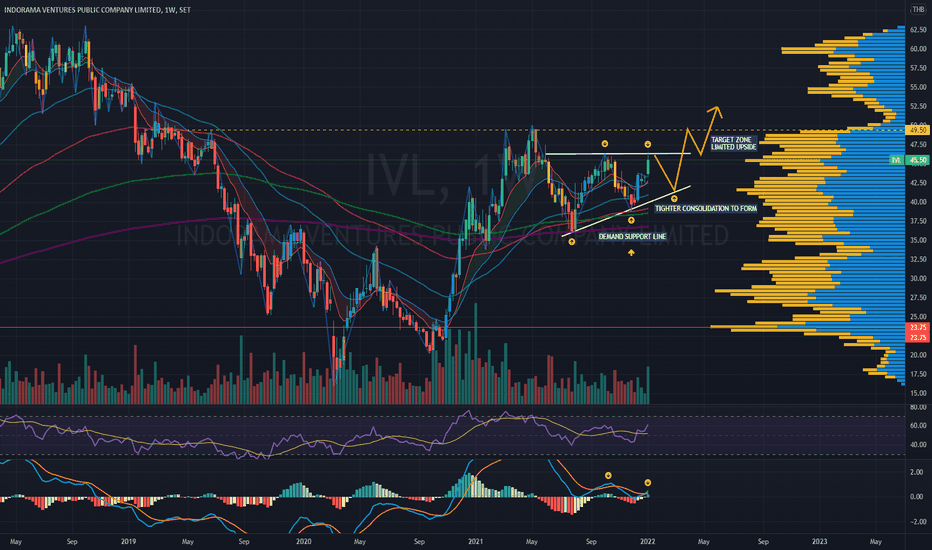
IVL | Ascending Triangle | Bull Trap - Limited UpsideIVL | Thailand SET Index | Petro Sector | Chart Pattern Trading
> Ascending Triangle continuation pattern - Bullish Trap with limited upside
> Price Action: Wait for tighter candlestick consolidation - Entry @ Demand Support Line Zone only
> RSI - bullish trap signal
> MACD - Bearish Divergence
DP
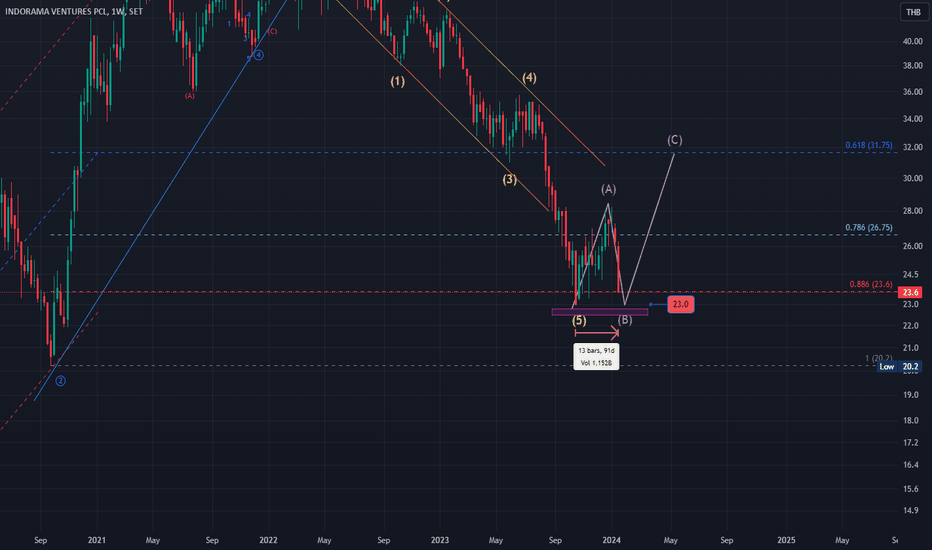
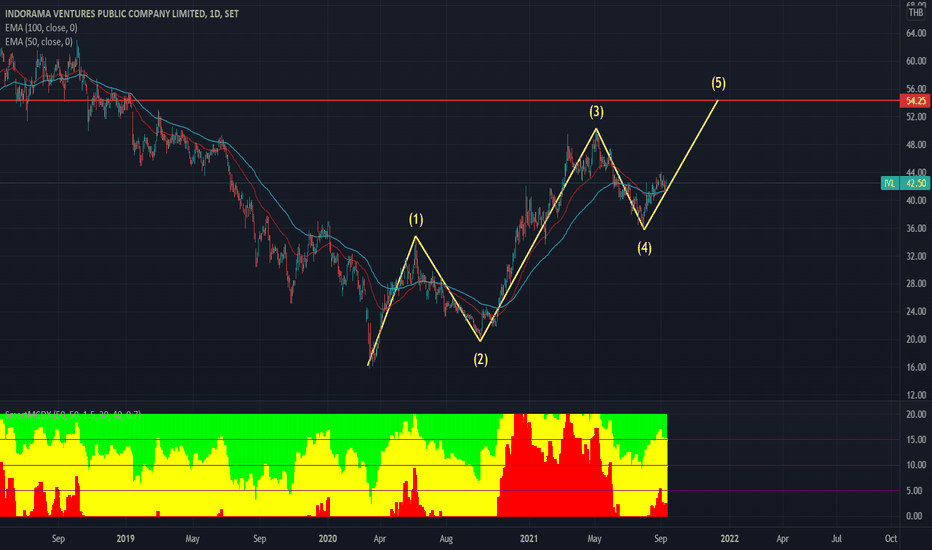
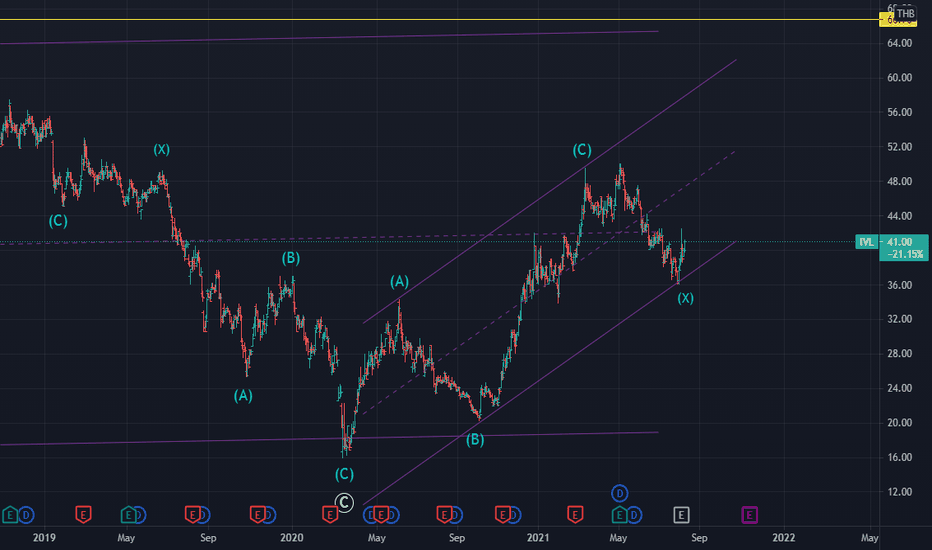
Elliott wave 1 Elliott wave 1 Flat graph by Nantich The traingle
Turtle and rabbit
One day a rabbit was boasting about how fast he could run. He was laughing at the turtle for being so slow. Much to the rabbit’s surprise, the turtle challenged him to a race. The rabbit thought this was a good joke and accepted the
See all ideas
Summarizing what the indicators are suggesting.
Neutral
SellBuy
Strong sellStrong buy
Strong sellSellNeutralBuyStrong buy
Neutral
SellBuy
Strong sellStrong buy
Strong sellSellNeutralBuyStrong buy
Neutral
SellBuy
Strong sellStrong buy
Strong sellSellNeutralBuyStrong buy
An aggregate view of professional's ratings.
Neutral
SellBuy
Strong sellStrong buy
Strong sellSellNeutralBuyStrong buy
Neutral
SellBuy
Strong sellStrong buy
Strong sellSellNeutralBuyStrong buy
Neutral
SellBuy
Strong sellStrong buy
Strong sellSellNeutralBuyStrong buy
Displays a symbol's price movements over previous years to identify recurring trends.
