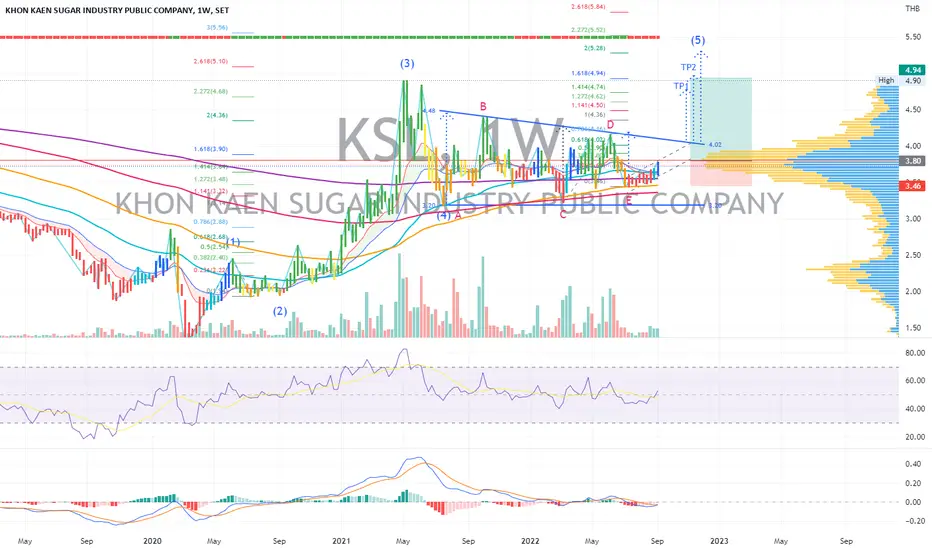
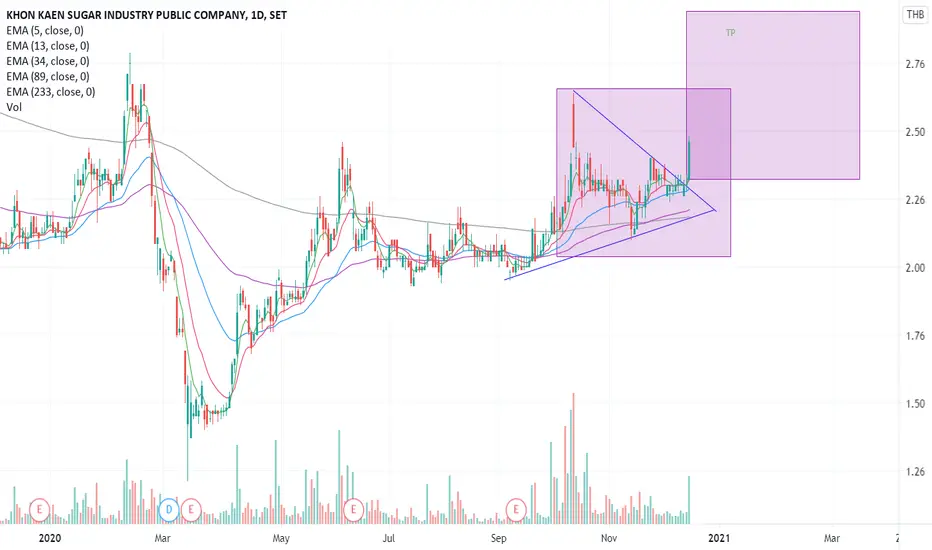
KSL | Wave Projection | Triangle ABCDE Wave SetupPrice action and chart pattern trading setup
> A possible uptrend scenario with ABCDE symmetrical triangle major wave 4 ending E - wave position, just above SMMA200/100/50 week making its way up to the triangle resistance wave D.
> Target: Wave projection target breakout triangle resistance from pos
0.08 THB
917.84 M THB
16.44 B THB
About KHON KAEN SUGAR INDUSTRY PCL
Sector
Industry
CEO
Chalush Chinthammit
Website
Headquarters
Bangkok
Founded
1945
ISIN
TH0828010R12
FIGI
BBG000Q47WL1
Khon Kaen Sugar Industry Public Co. Ltd. engages in the manufacture and distribution of sugar and molasses. It operates through the following segments: Manufacture and Distribution of Sugar and Molasses; Manufacture and Sale of Electricity; Real Estate Rental, and Others Business. The Manufacture and Distribution of Sugar and Molasses segment produces and distributes sugar and molasses to industrial enterprises, re-export manufacturing enterprises, and international sugar traders. The Manufacture and Sale of Electricity segment generates and sells electricity to electricity generating authority of Thailand, and the group companies. The Real Estate Rental segment represents office building for rent and holiday resort for training and seminar center. The company was founded by Chuan Chinthammit in 1945 and is headquartered in Bangkok, Thailand.
Related stocks
Summarizing what the indicators are suggesting.
Oscillators
Neutral
SellBuy
Strong sellStrong buy
Strong sellSellNeutralBuyStrong buy
Oscillators
Neutral
SellBuy
Strong sellStrong buy
Strong sellSellNeutralBuyStrong buy
Summary
Neutral
SellBuy
Strong sellStrong buy
Strong sellSellNeutralBuyStrong buy
Summary
Neutral
SellBuy
Strong sellStrong buy
Strong sellSellNeutralBuyStrong buy
Summary
Neutral
SellBuy
Strong sellStrong buy
Strong sellSellNeutralBuyStrong buy
Moving Averages
Neutral
SellBuy
Strong sellStrong buy
Strong sellSellNeutralBuyStrong buy
Moving Averages
Neutral
SellBuy
Strong sellStrong buy
Strong sellSellNeutralBuyStrong buy
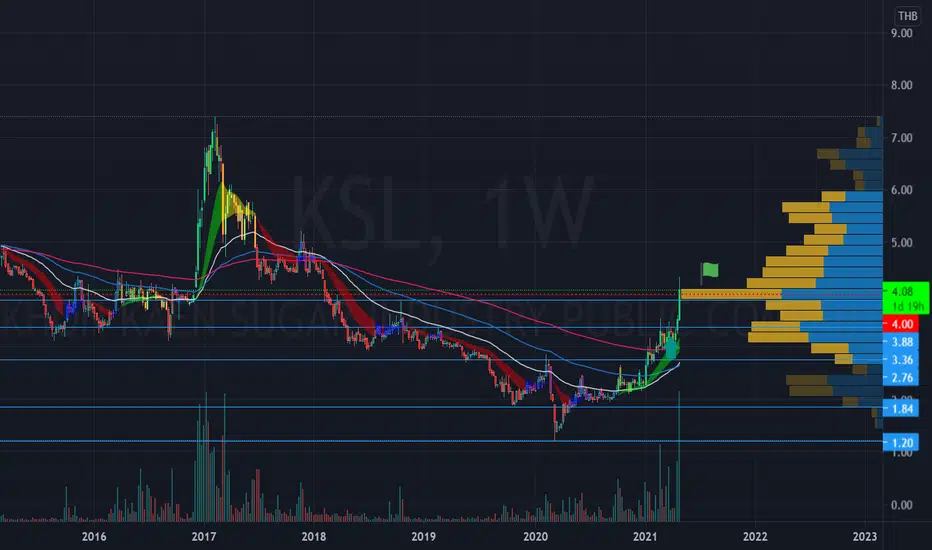
Displays a symbol's price movements over previous years to identify recurring trends.