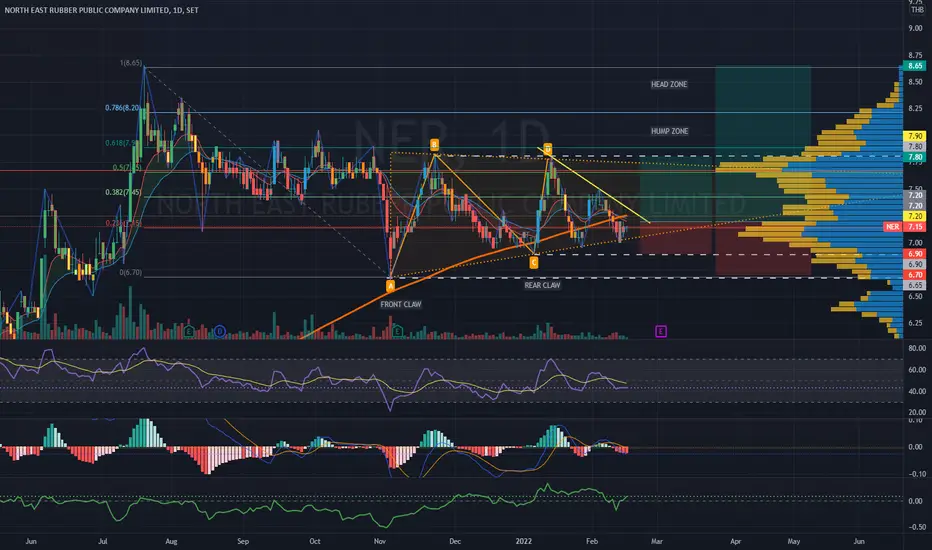
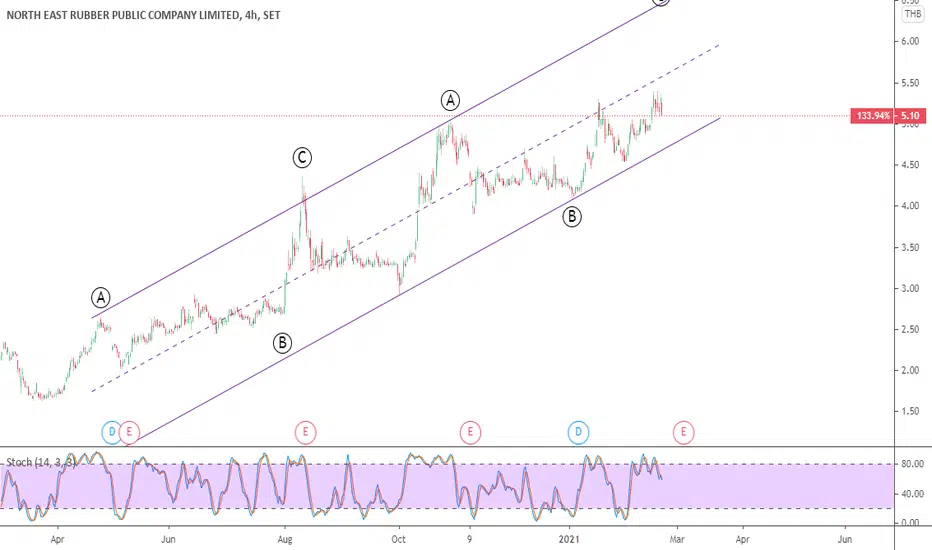
Corrective Wave and Chart Pattern Analysis - RSI TFW DivergenceCorrective Wave Structure a ABC Analysis pattern in TFW timeframe
Observations:
A bullish divergence is evident in the momentum near the support zone indicating weakening bearish momentum, the end of wave C, and a potential reversal to the upside.
Analysis:
- Wave A: completed descending channel r
0.98 THB
1.65 B THB
27.45 B THB
About NORTH EAST RUBBERS PCL
Sector
Industry
CEO
Chuvit Juengtanasomboon
Website
Headquarters
Buriram
Founded
2006
ISIN
TH8798010R19
FIGI
BBG00MCN9490
North East Rubber PCL engages in manufacturing and distribution of rubber products. It offers ribbed smoked sheet, standard Thai rubber, and mixture rubber under name NER. The firm also provides various kind of natural rubber products include STR10, STR20, RSS compound, STR10 compound and STR20 compound, which are used in all types of automobile tires, retreating materials, mats, and other rubber products. The company was founded by Chuvit Juengstanasomboon on June 12, 2006 and is headquartered in Buriram, Thailand.
Related stocks

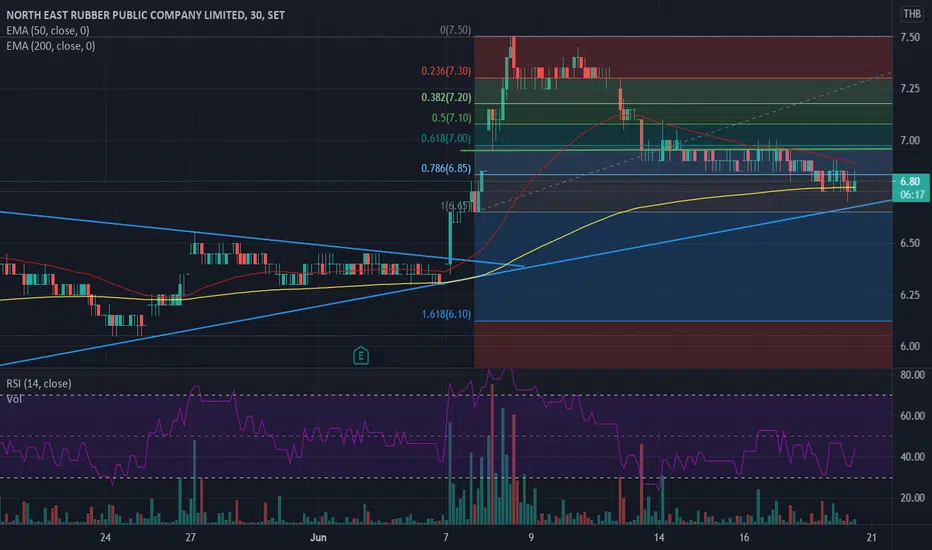
NER | Rising Triangle Dragon Pattern | Entry @ Breakout SetupPrice Action and chart pattern short-medium term trading
> Rising Triangle Dragon Pattern
> Entry @ breakout trend line SMA 200
Indicator:
> Bullish RSI crossing MA line above 50
> Rising MACD just below baseline
> CMF reversal crossed baseline 0.
Short term RR 2:1 Medium-term RR 3:1
Always res
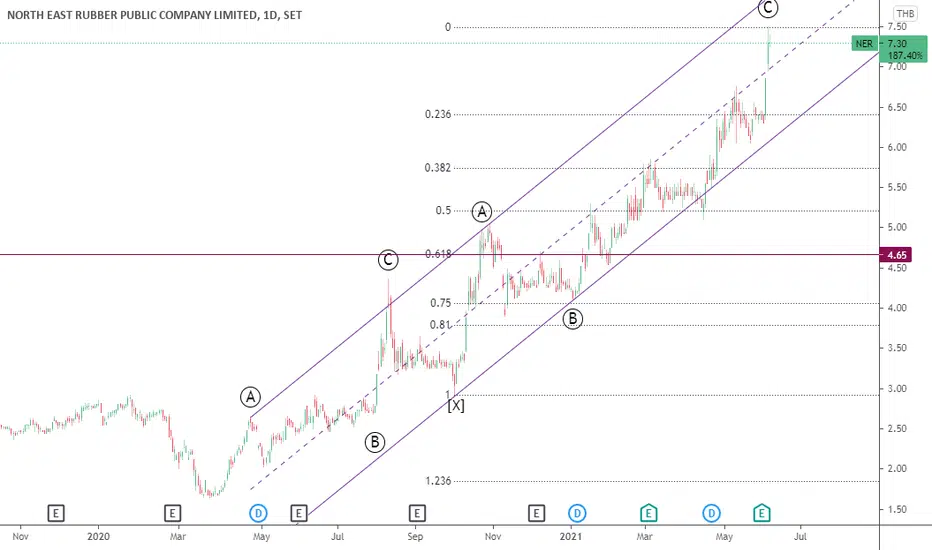
NER (Thailand) - Elliot Wave AnalysisExpected this to be the end of an uptrend ABCXABC. Expect price to retrace back to 4.65.
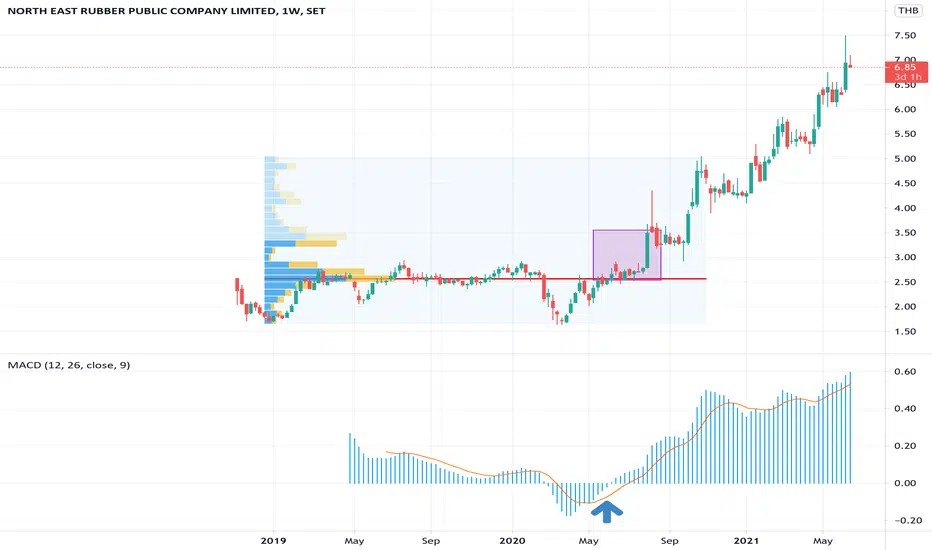
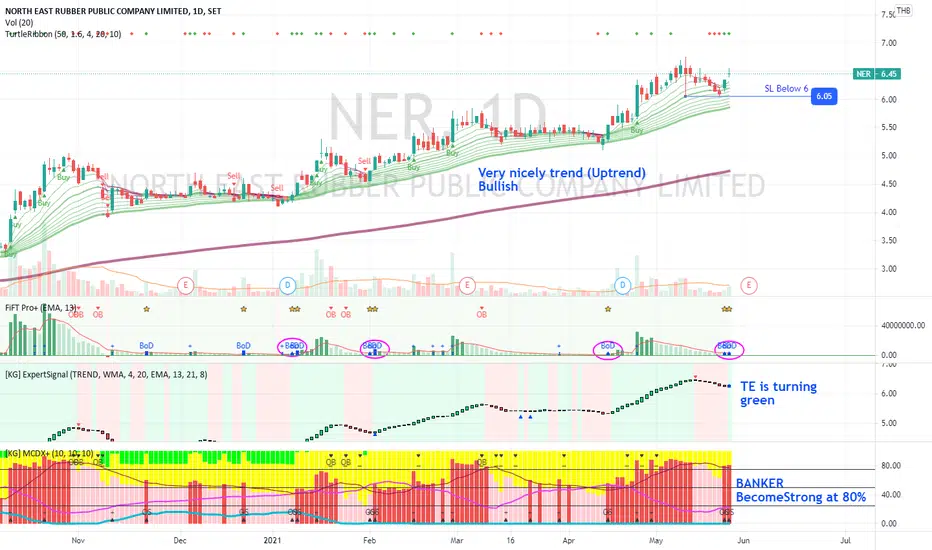
SET:NER Very nice trending Stock NER has a very nice trending chart.
Currently still BULLISH and UPTREND.
FIFT +ve (Strong Bull) with BOD signal
TE turning GREEN
MCDX strong with 80% Banker's volume...
Stop Loss is below 6 (Current price to SL is about 7% Risk).. Looks attractive.
Other nice trending SET stocks are :
SET:SC
NERWe are in the second Primary w of a non-standard pattern (abcxabc), where w does not seems to have completed. However; w 's pattern is still unclear There are three possible scenarios w could turn out to be:
1. a non-standard pattern (abcxabc)
2. an impulse wave - 1x wave is more likly
3. a trian
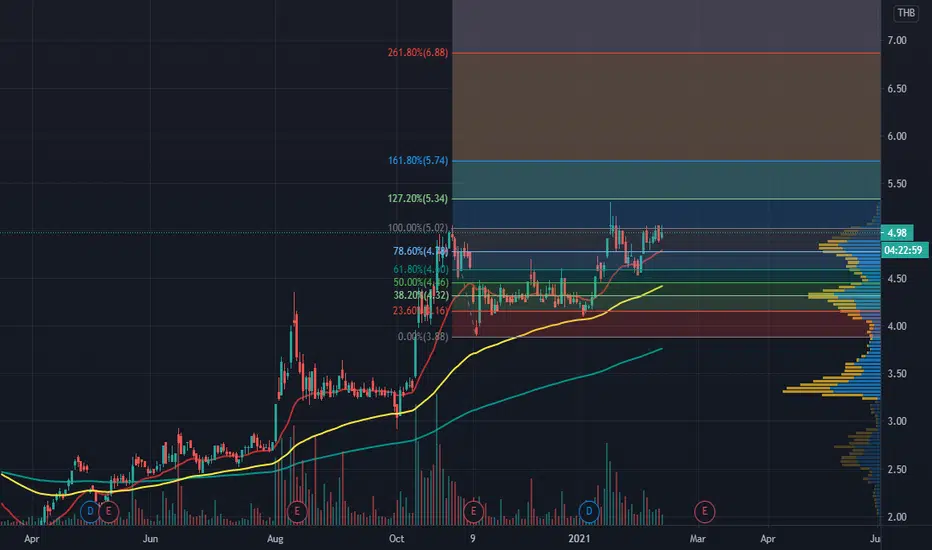
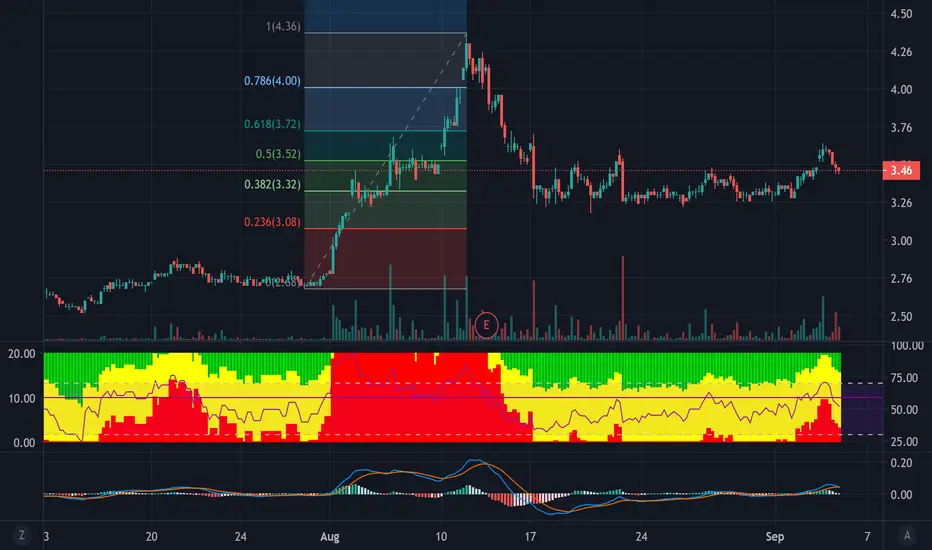
good projected, being sideway, waiting to go upGiant is awakening, has been sleeping for awhile after making a Hugh climb up. Now, colleting more power to re attempt this time higher. Still lining inside the pricing box. Attempted to reach 61.8% (3.70)
MCDX dropped, no action taken, must wait until red bar increases crossing a purple cumulated l

See all ideas
Summarizing what the indicators are suggesting.
Oscillators
Neutral
SellBuy
Strong sellStrong buy
Strong sellSellNeutralBuyStrong buy
Oscillators
Neutral
SellBuy
Strong sellStrong buy
Strong sellSellNeutralBuyStrong buy
Summary
Neutral
SellBuy
Strong sellStrong buy
Strong sellSellNeutralBuyStrong buy
Summary
Neutral
SellBuy
Strong sellStrong buy
Strong sellSellNeutralBuyStrong buy
Summary
Neutral
SellBuy
Strong sellStrong buy
Strong sellSellNeutralBuyStrong buy
Moving Averages
Neutral
SellBuy
Strong sellStrong buy
Strong sellSellNeutralBuyStrong buy
Moving Averages
Neutral
SellBuy
Strong sellStrong buy
Strong sellSellNeutralBuyStrong buy
Displays a symbol's price movements over previous years to identify recurring trends.