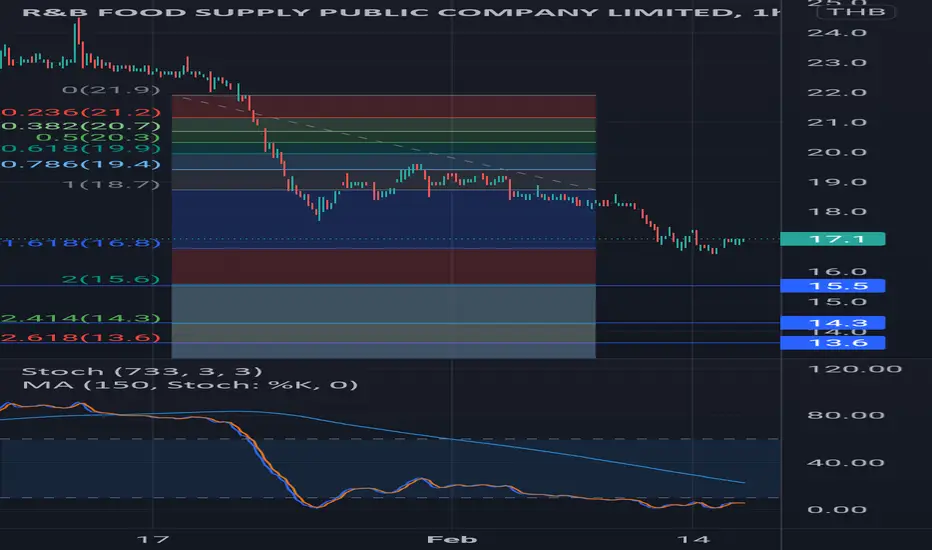
RBF | Wave Analysis | Target Projection - Ending DiagonalPrice action and chart pattern trading
> Falling wave channel pattern, possible downtrend 3-wave ending diagonal pattern
> Target doubled top zone previous wave 1 - 2 as price rejection is expected, followed by tight candlestick consolidation.
> Entry @ downtrend channel breakout from the consolidat
0.22 THB
512.76 M THB
4.39 B THB
About R&B FOOD SUPPLY PCL
Sector
Industry
Website
Headquarters
Bangkok
Founded
1989
ISIN
TH9451010R14
FIGI
BBG00QG4MRY5
R&B Food Supply Public Co., Ltd. engages in the manufacturing and trading of bread products, color, fragrances and chemicals, which are used in food, beverage, and consumer product industries. The company was founded by Somchai Ratanapoompinyo and Petchara Ratanapoompinyo in 1989 and is headquartered in Bangkok, Thailand.
Related stocks

RBF | Elliott Wave Projection - Corrective Wave BPrice action and chart pattern trading
> Elliott Wave projection of corrective Wave B - Entry @ downtrend line breakout of consolidation
> Target Wave B Zigzag at 0.5 - 0.618 retracement of Wave A
> Stoploss at the lowest point of Wave A impulse wave 5 position
> Risk reward ratio at 2:1 for short t
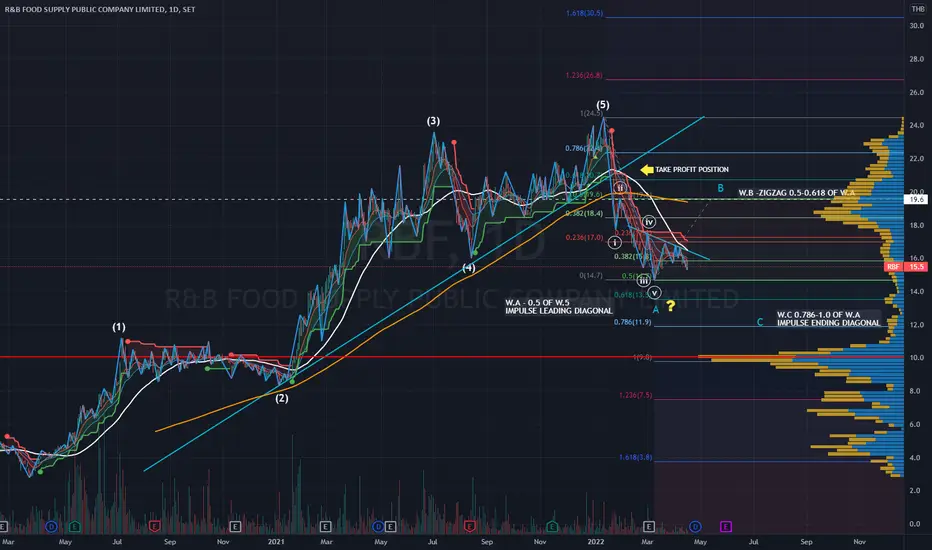
RBF | Pullback Buy Position | Elliot Wave 5th Impulse TargetRBF | Thailand SET Index | Food Sector | Price Action Trading
Price Action | Entry Zone Position @ Pullback
Chart Pattern | Ascending Triangle Breakout
Elliot Wave Mapping for estimated 5th Impulse Wave Target
Place your stop-loss about 5% below entry
Risk Ratio: 3:1 Minimum
Always respect your


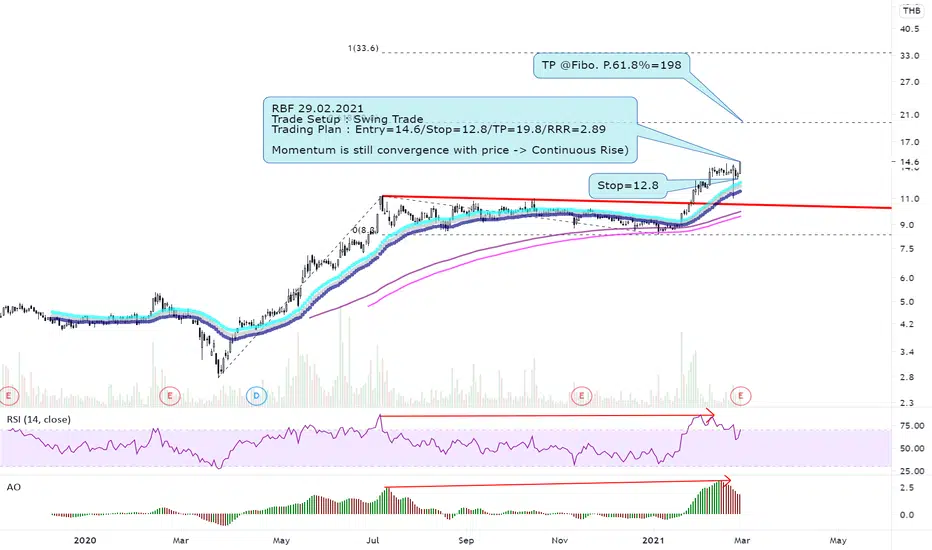
RBF with Swing Trade SetupRBF is still rising on the swing trade pattern. It's possible to hit the next TP (Fibo. P.61.8%) with convergence momentum. The initial stop can be applied for this plan.
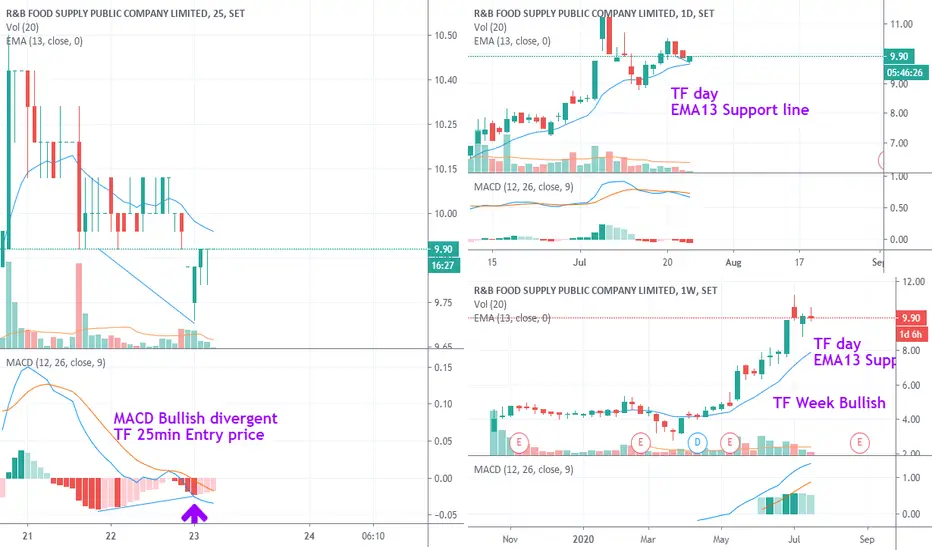
RBF Still BullishTriple Screens layout from Dr.Alexander Elder's book
TF 25 min for Entry point
TF day for candlestick pattern, stop loss, take profit
TF week for trend
TF 25 min entry point show MACD bullish divergent
TF day MACD histogram confirm blue signal system (in his book)
Have a nice day
See all ideas
Summarizing what the indicators are suggesting.
Oscillators
Neutral
SellBuy
Strong sellStrong buy
Strong sellSellNeutralBuyStrong buy
Oscillators
Neutral
SellBuy
Strong sellStrong buy
Strong sellSellNeutralBuyStrong buy
Summary
Neutral
SellBuy
Strong sellStrong buy
Strong sellSellNeutralBuyStrong buy
Summary
Neutral
SellBuy
Strong sellStrong buy
Strong sellSellNeutralBuyStrong buy
Summary
Neutral
SellBuy
Strong sellStrong buy
Strong sellSellNeutralBuyStrong buy
Moving Averages
Neutral
SellBuy
Strong sellStrong buy
Strong sellSellNeutralBuyStrong buy
Moving Averages
Neutral
SellBuy
Strong sellStrong buy
Strong sellSellNeutralBuyStrong buy
Displays a symbol's price movements over previous years to identify recurring trends.