TIDLOR: Trend and Trading1 Oct 2024
CP 18.30
-End EW 5th wave -> wait retracement back to around 61.8% (16.5)- 50% (15.7)
-Indicators (STOCH/RSI/MACD/SmartMCDX/ADX & DI/MFI) all show downward trend
Y24 TP21
MOS 20%@ 16.80
MOS 25%@ 15.75
MOS 30%@ 14.70
About TIDLOR HOLDINGS PCL
Provides vehicle loans
Related stocks

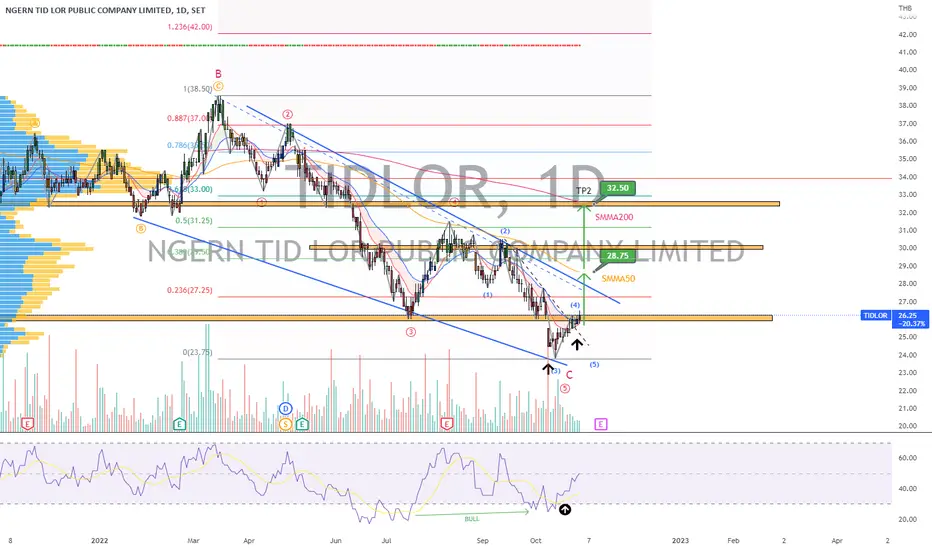
TIDLOR | Wave Analysis | Falling Wedge Breakout-Bull DivergencePrice action and chart pattern trading:
> A possible ABC correction - C-wave trend reversal in progress
> Falling wedge local trend breakout EMA20D resistance making an inverse head & shoulders pattern.
> TP1 @ SMMA50 as key dynamic resistance and TP2 @SMMA200 with +20%++ upside
> Entry @ Neckline b
TIDLOR : SET INDEX It's felt like ages since i last log in trading view...
that i lost the button to open chart, n what's chart+ anyways ?
.
I will try to log in here more often :))
TIDLOR : SET INDEXRetesting the support at 39.00 if holds then moving up to next resistance at 48.00
Trade safe and fun
don't forget to place the SL at ur acceptable risk

TIDLOR : SET INDEXEverything is on the chart.
no financial advice
Trade safe and fun
Feel free to comment/share ur ideas

TIDLOR | Triangle Breakout | Entry-Pullback Shooting Star candleTIDLOR |Thailand SET Index | Financial Sector | Price Action Trading
Chart Pattern: Pennant Triangle Breakout
>Price Action: Entry Zone @ Pullback - shooting star candle
>Stop-loss Zone just 3-5% below the VOLUME PROFILE - POINT OF CONTROL LINE
>EMA10 and EMA20 crossing up EMA50 main dynamic resist


See all ideas
Summarizing what the indicators are suggesting.
Oscillators
Neutral
SellBuy
Strong sellStrong buy
Strong sellSellNeutralBuyStrong buy
Oscillators
Neutral
SellBuy
Strong sellStrong buy
Strong sellSellNeutralBuyStrong buy
Summary
Neutral
SellBuy
Strong sellStrong buy
Strong sellSellNeutralBuyStrong buy
Summary
Neutral
SellBuy
Strong sellStrong buy
Strong sellSellNeutralBuyStrong buy
Summary
Neutral
SellBuy
Strong sellStrong buy
Strong sellSellNeutralBuyStrong buy
Moving Averages
Neutral
SellBuy
Strong sellStrong buy
Strong sellSellNeutralBuyStrong buy
Moving Averages
Neutral
SellBuy
Strong sellStrong buy
Strong sellSellNeutralBuyStrong buy
Displays a symbol's price movements over previous years to identify recurring trends.