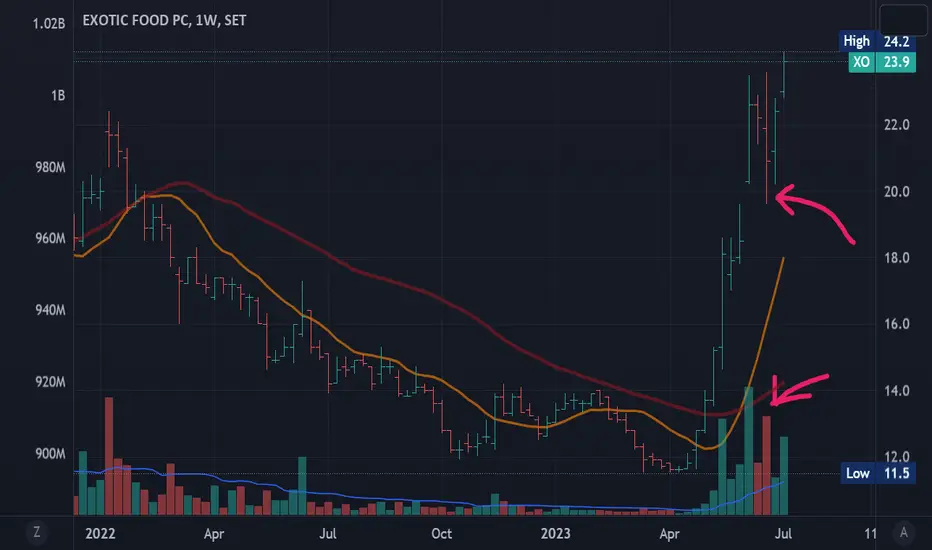
A High tight flag?XO has impressively gone up double in just a couple of months, responding the good news that the company has successfully penetrated the US market for the first time.
The chart seems to be forming a High tight flag pattern. The price although did a break on 3rd of July, until today it has gone side
1.5 THB
790.76 M THB
2.48 B THB
About EXOTIC FOOD PC
Sector
Industry
CEO
Jittiporn Jantarach
Website
Headquarters
Bangkok
Founded
1999
ISIN
TH5778010R14
FIGI
BBG006YXD9D8
Exotic Food Public Co. Ltd. engages in the manufacture and distribution of seasoning sauce products. Its products include dipping and cooking sauce, salad dressing and oil, cooking paste, herbs and spice, cooking essentials, and noodles. The company was founded on January 7, 1999 and is headquartered in Chonburi, Thailand.
Related stocks
XO | Corrective ZZ - Downtrend Target Wave Projection SMA200WPrice action and chart pattern trading
> update wave analysis target for downtrend at SMA200W - extension 0.786 - 1.0 of wave A
> Long Entry- patiently await for upcoming downtrend line breakout wave ii and iv for reversal confirmation
Always trade with affordable risk and respect your stoploss
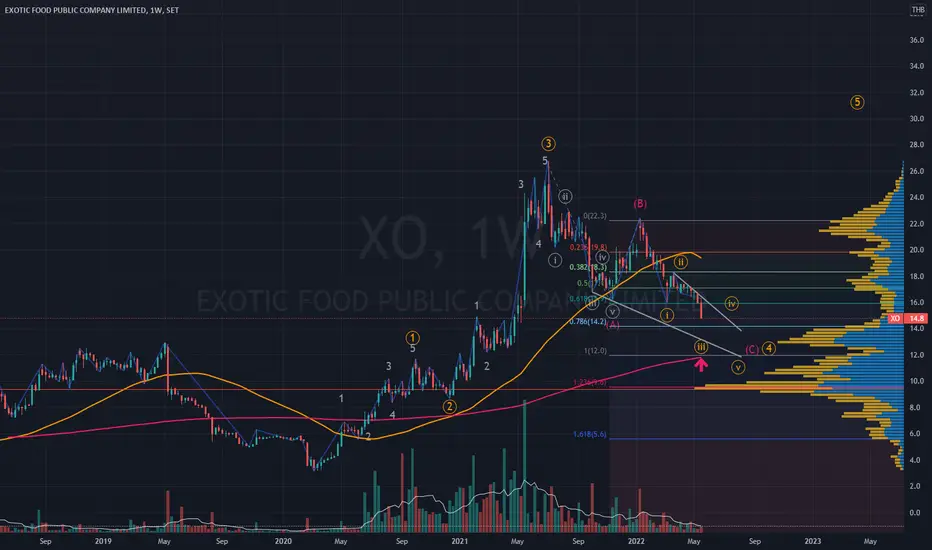
XO | Tea...or Coffee? Cup & Handle Target projectionXO | Thailand SET Index | Price Action & Chart Pattern Trading
> A traditional Cup & Handle pattern target for uptrend
> The Handle retracement could be around 0.5 Fibonacci the cup shape
> Elliott Wave Projection update
Good Luck

XO | Trend Breakout | Marubozu White Candlestick | Target Est.XO | Thailand SET Index | Food Sector | Target for uptrend Elliot Wave & Fibonacci Extension estimated
ENTRY Position
Price Action Trading: Trend Breakout with Marubozu White candlestick
Chart Pattern: Descending Triangle breakout
Indicator:
> MFI Money flow in
> RSI bullish signal
> MACD gold


See all ideas
Summarizing what the indicators are suggesting.
Oscillators
Neutral
SellBuy
Strong sellStrong buy
Strong sellSellNeutralBuyStrong buy
Oscillators
Neutral
SellBuy
Strong sellStrong buy
Strong sellSellNeutralBuyStrong buy
Summary
Neutral
SellBuy
Strong sellStrong buy
Strong sellSellNeutralBuyStrong buy
Summary
Neutral
SellBuy
Strong sellStrong buy
Strong sellSellNeutralBuyStrong buy
Summary
Neutral
SellBuy
Strong sellStrong buy
Strong sellSellNeutralBuyStrong buy
Moving Averages
Neutral
SellBuy
Strong sellStrong buy
Strong sellSellNeutralBuyStrong buy
Moving Averages
Neutral
SellBuy
Strong sellStrong buy
Strong sellSellNeutralBuyStrong buy
Displays a symbol's price movements over previous years to identify recurring trends.