GLDSystem T Performances: Annual Compound Profit 40%, Win Rate 55%, Risk/Reward Ratio 1:2, 20 Years of Backtesting Data, Over 100 Markets.
* Click Like and Follow to Support My Work!
---
Hi Traders,
I'd like to introduce the System T, a computerized trading system that analyzed and backtested the 20 years history data of over 100 markets.
This post is my sharing of how I think about systematic trading and the signals generated by the System T.
(This is my opinion only, NOT the financial advice.)
I think that for the system to open a trade and manage risk, it only needs a buy signal & a stop-loss signal clearly on the chart.
Once the system finds a good trend, it will ride it as long as possible. The stop-loss will be adjusted accordingly to the new price movement.
(Remember to follow this trade idea and follow my profile to get updates about the stop-loss adjustment and sell signal based on the latest price and market conditions daily.)
System T performances above will give you an idea of how it performs in the last 20 years.
Notice that this result was achieved only if I strictly followed the rule: "Only and Always Buy & Sell based on the System Signals".
Don't sell when there is no sell signal as we all want to follow the good trends til the end like everything in life does. \(^-^)/
Also, my system is extremely diversified through over 100 markets so that it only risks less than -1% of the total capital per trade.
Thank you and good luck!
---
DISCLAIMER:
I am NOT a financial advisor, and nothing I say is meant to be a recommendation to buy or sell any financial instrument.
My views are general in nature and I am not giving financial advice. You should not take my opinion as financial advice. This is my opinion only.
Do your own due diligence, and take 100% responsibility for your financial decisions.
Trading and investing are risky! Don't invest money you can't afford to lose, because many traders and investors lose money. There are no guarantees or certainties in trading.
- Content is for education purposes only, not investment advice.
- Trading involves a high degree of risk.
- We’re not investment or trading advisers.
- Nothing we say is a recommendation to buy or sell anything.
- There are no guarantees or certainties in trading.
- Many traders lose money. Don’t trade with money you can’t afford to lose.
O87 trade ideas

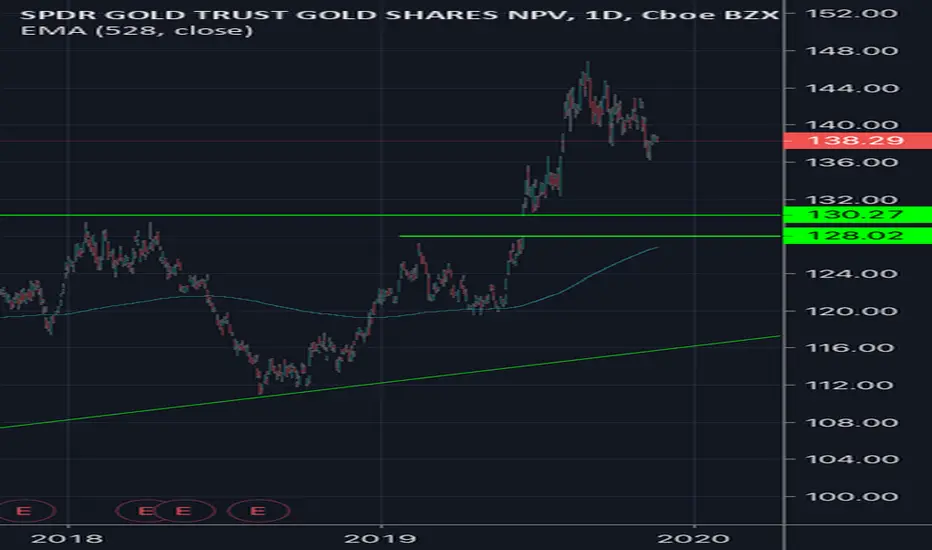
GLD - still a little room to run!Not looking for too much more in this rally but I do see GLD making it ti resistance. Maybe another day or two as the overall market picks up downside momentum. Just doesn't feel like the turn to me but keeping fingers crossed that achange of character is coming about.


GLD - HoldingToday GLD held the 2014 breakdown point and it made a higher low than two weeks ago. Still in the downtrend channel until proven otherwise but feel a change in character coming. Miners in a similar downtrend pattern but made a higher low. Feels like some coiling is happening. Being patient.

GOLD SHORT (not long term)Everyone expected Gold to GET a nice incline after the FED lowered rates. That of course did not happen so fair weather investors are jumping ship. Once the correction is made GOLD will rise again, tis the season, check historical charts. I am going GLD Short for the week. Next week I will re look at the Stock.

the last stand-100 as the USD flexs before decades of downfall... the monthly fractal obelisk structure has started shaping up a couple months ago on all markets and will rally hard. as all final stands do. What you are about to find out tho...is IF you balanced your dollar properly the entire time, since its creation...you'd have a much more controlled and less painful ride back to balanced data..
the amount of imbalance across the global financial markets has never been this high...bitcoin doing its thing has just set things to a laughable hollywood type of scenario which ends with a big bang.

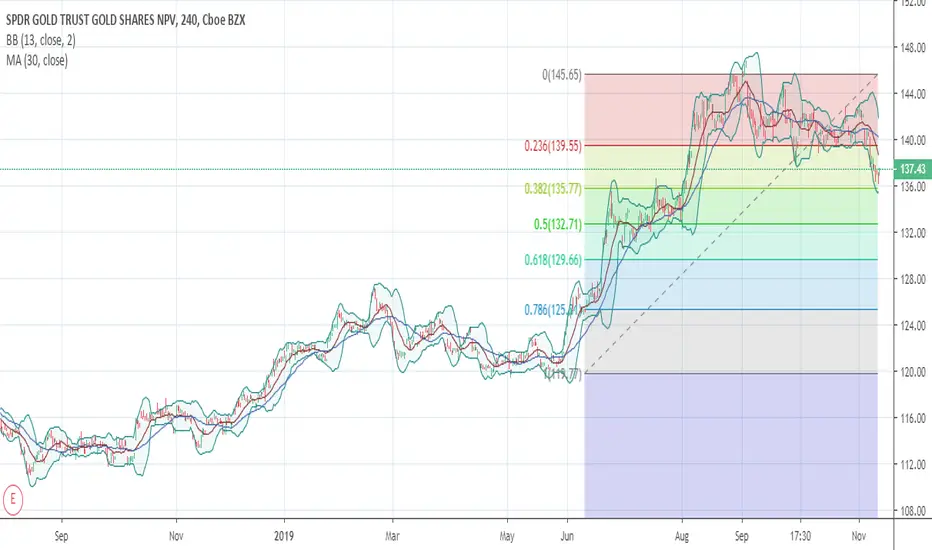
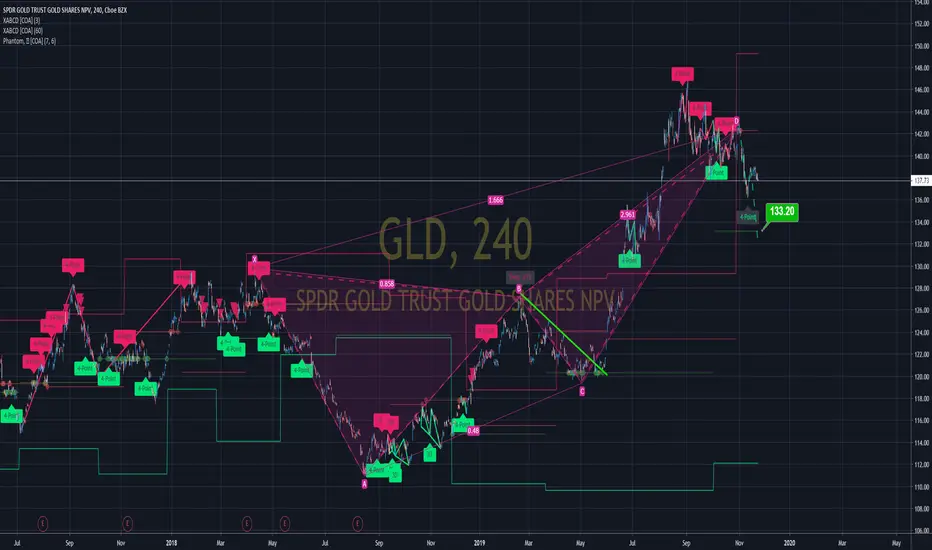
GLD | GOLD likely pullback to 133There's a Bearish XABCD formation highlighted on the chart,
Along with an ABCD ending around $132
Expecting a pullback to $133 where Phantom Midline should act as primary support.
Indicators used. by @coinobsalgos
XABCD Scanner
Phantom Script
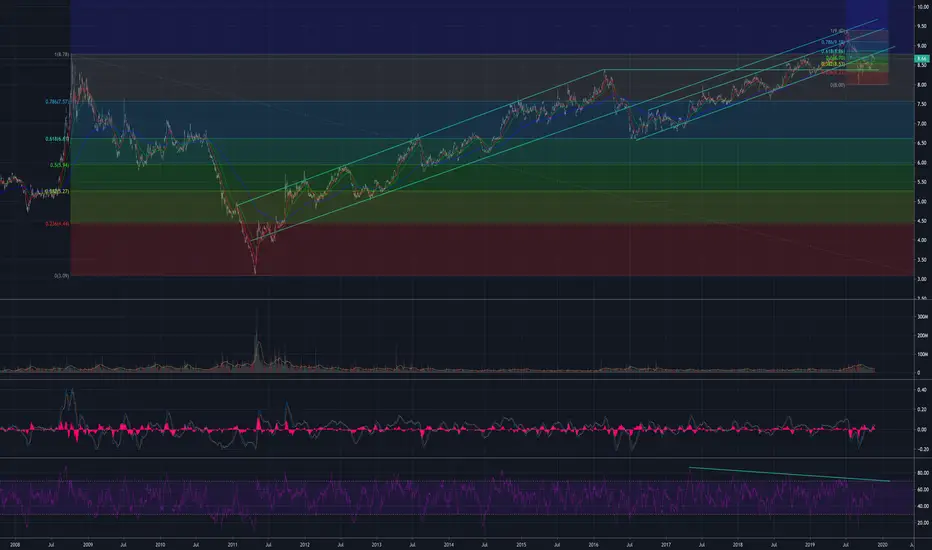
GLD/SLV Ratio - time for a correction?This chart depicts the GLD/SLV ratio since the start of the almost 11 year bull market. As you can see the ratio reached a high at about the time the market starting crashing back in 2008 of 8.8, and hit a low of 31 when gold topped out in 2011 (those boundaries defined by the FIB chart). It has steadily climbed within two very defined channels to new highs as gold and silver have been out of favor for most of the 11 year raging bull. Gold and silver did have a brief shining moment in 2016 while the market digested its 5 1/2 year gains before the next leg of the bull market (see drop in ratio at start of 2016). During the last leg the ratio reached a historical 100 year peak at 9.4 (a 94 gold to silver ratio). During gold and silver's shining moment that began in June this year you can see the 94 peak collapsed (right at the support channel of the first channel) through the second channel and gave way to a ratio of 8.0 as silver outpaced gold's gains on a percentage basis. The ratio has worked its way back to 8.6 as gold and silver have consolidated their big moves that started in June. As you can see it has stalled right at the underside of the second channel as well and should continue to fail as gold and silver start to rise again. A break of 8.35 (which represents the 2015 top before the 2016 low of 6.5), which is marked by the horizontal line and the red .236 level on the inset FIB chart marking the 9.4 top and 8.0 bottom, and the flood gates should open again. If history is correct, and this chart follows a similar pattern to that of 2008-2011 (even at a slower pace), this is the time to buy silver (and gold ) and protect your equity investments that appear to be due for a breather.
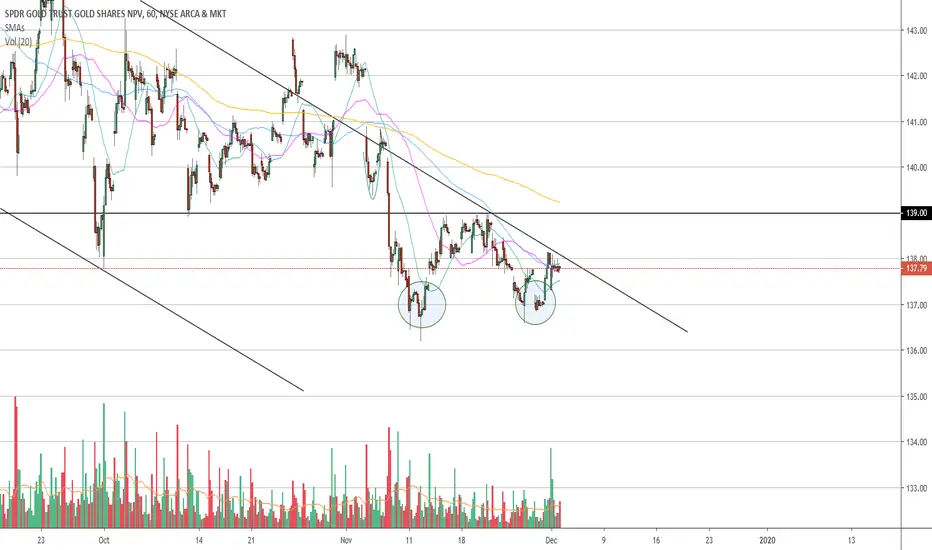
GOLD (B+ Setup)Looking at Longing GLD, 1HR
1: Shift candle up above 21 EMA
2: Confirmation of RSI above 50 level
3: cross over towards upside
B+ Setup as its not in full trend, EMA 200 and 800 above acting as resistance

ONE MILLION DOLLARSHey ******* its 2019, one millions dollars isn't a lot of money :D
i love gooooooooooooold

Gold buy set upEvery wealthy person & government on the planet owns gold as apart of their asset portfolio. That’s all the explanation you’ll ever need for buying gold after breakouts on daily & weekly levels.
GLDSystem T Performances: Annual Compound Profit 40%, Win Rate 55%, Risk/Reward Ratio 1:2, 20 Years of Backtesting Data, Over 100 Markets.
* Click Like and Follow to Support My Work!
---
Hi Traders,
I'd like to introduce the System T, a computerized trading system that analyzed and backtested the 20 years history data of over 100 markets.
This post is my sharing of how I think about systematic trading and the signals generated by the System T.
(This is my opinion only, NOT the financial advice.)
I think that for the system to open a trade and manage risk, it only needs a buy signal & a stop-loss signal clearly on the chart.
Once the system finds a good trend, it will ride it as long as possible. The stop-loss will be adjusted accordingly to the new price movement.
(Remember to follow this trade idea and follow my profile to get updates about the stop-loss adjustment and sell signal based on the latest price and market conditions daily.)
System T performances above will give you an idea of how it performs in the last 20 years.
Notice that this result was achieved only if I strictly followed the rule: "Only and Always Buy & Sell based on the System Signals".
Don't sell when there is no sell signal as we all want to follow the good trends til the end like everything in life does. \(^-^)/
Also, my system is extremely diversified through over 100 markets so that it only risks less than -1% of the total capital per trade.
Thank you and good luck!
---
DISCLAIMER:
I am NOT a financial advisor, and nothing I say is meant to be a recommendation to buy or sell any financial instrument.
My views are general in nature and I am not giving financial advice. You should not take my opinion as financial advice. This is my opinion only.
Do your own due diligence, and take 100% responsibility for your financial decisions.
Trading and investing are risky! Don't invest money you can't afford to lose, because many traders and investors lose money. There are no guarantees or certainties in trading.
- Content is for education purposes only, not investment advice.
- Trading involves a high degree of risk.
- We’re not investment or trading advisers.
- Nothing we say is a recommendation to buy or sell anything.
- There are no guarantees or certainties in trading.
- Many traders lose money. Don’t trade with money you can’t afford to lose.


2019 low-highAggressive entry here but we should be alright. The best entry here would be to wait for the time cycles

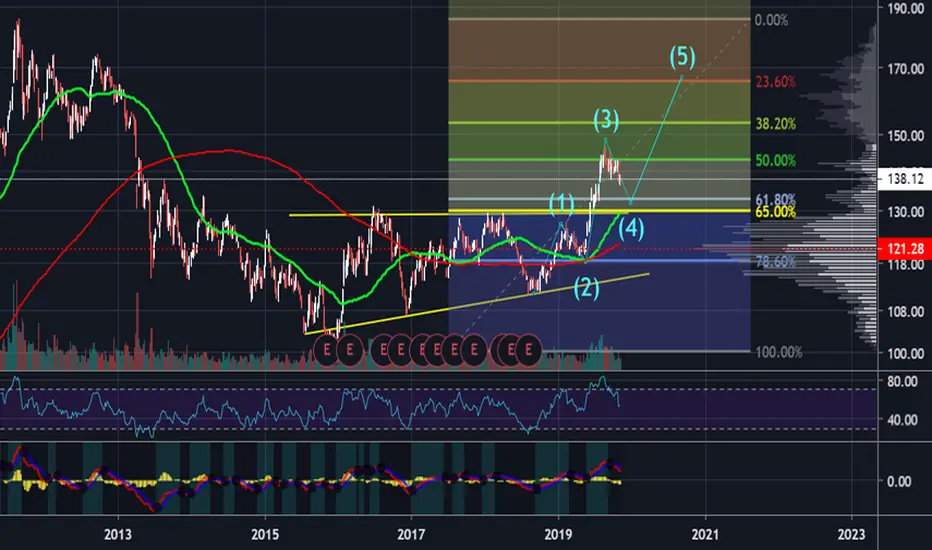
Gold outlook - weekly chart with fib + elliot wavesThis assumes a moderate recession triggered by brexit and impeachment occurs