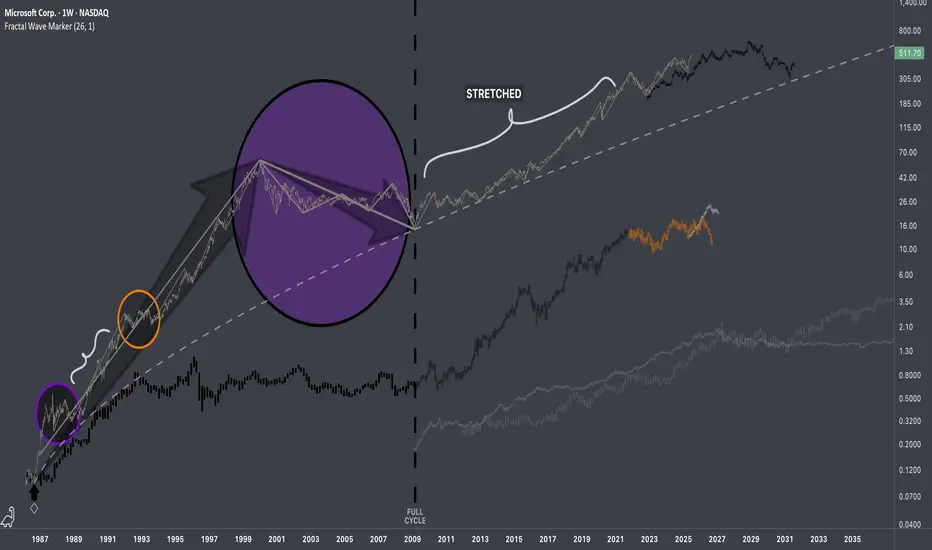
$MSFT: Fractal Hierarchy IResearch Notes
Fluctuations reappearing at broader scale.
If both are manifestations of the same pattern, then the next segments can be applied accordingly.
The remaining part can be deformed (depending on future volatility which can accelerate completion of composite sub-cycles)
Document
18.10 CAD
119.43 B CAD
332.15 B CAD
About Microsoft Corp.
Sector
Industry
CEO
Satya Nadella
Website
Headquarters
Redmond
Founded
1975
FIGI
BBG012TB8CX7
Microsoft Corp engages in the development and support of software, services, devices, and solutions. It operates through the following business segments: Productivity and Business Processes; Intelligent Cloud; and More Personal Computing. The Productivity and Business Processes segment comprises products and services in the portfolio of productivity, communication, and information services of the company spanning a variety of devices and platform. The Intelligent Cloud segment refers to the public, private, and hybrid serve products and cloud services of the company which can power modern business. The More Personal Computing segment encompasses products and services geared towards the interests of end users, developers, and IT professionals across all devices. The firm also offers operating systems; cross-device productivity applications; server applications; business solution applications; desktop and server management tools; software development tools; video games; personal computers, tablets; gaming and entertainment consoles; other intelligent devices; and related accessories. The company was founded by Paul Gardner Allen and William Henry Gates III in 1975 and is headquartered in Redmond, WA.
Related stocks
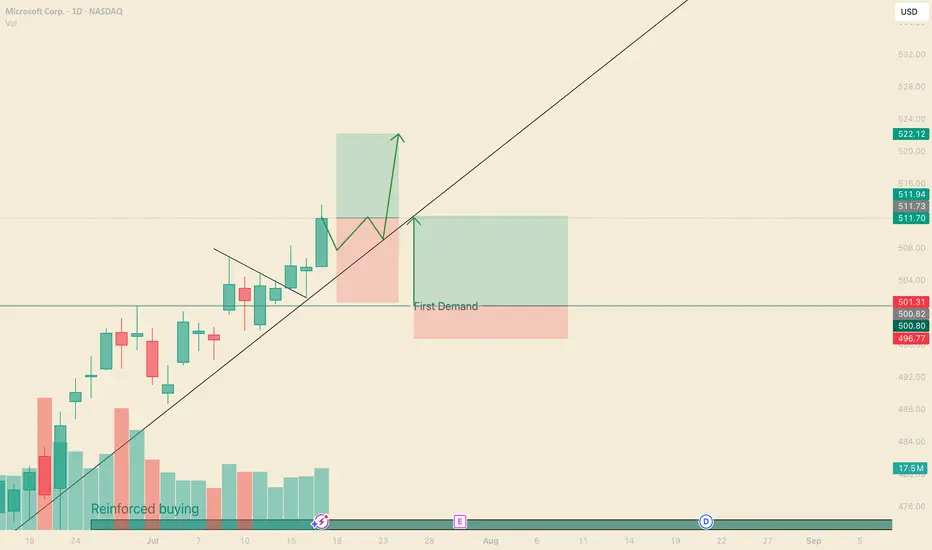
Microsoft Sees Declining Trading Volume Despite All Time HighsSince December of 2021, MSFT traded within a Rising Wedge structure that has gradually resulted in lower and lower highs in volume, at the same time IV on the Options Chain has begun to price down the strikes above $515 while Shorter Term Downside IV has begun to price up all the way out to $240.00.
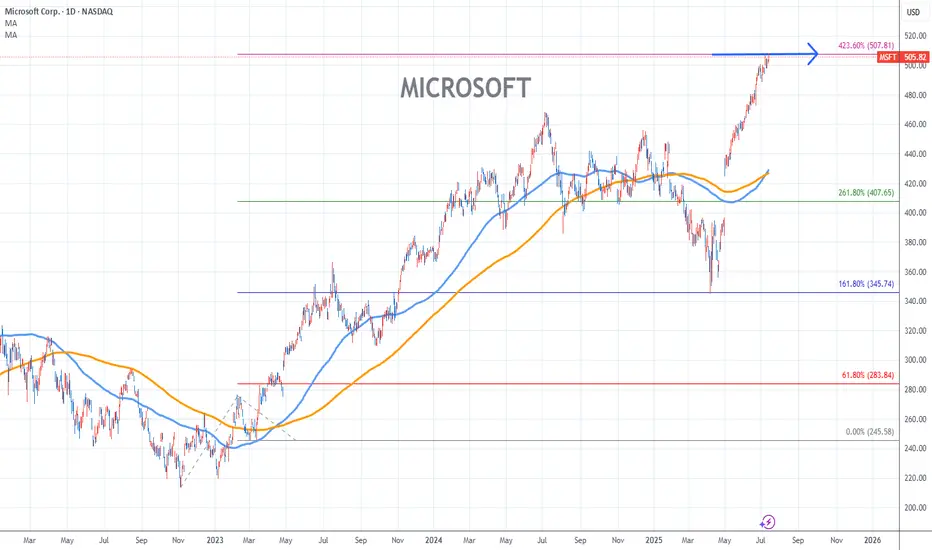
MICROSOFT Stock Chart Fibonacci Analysis 071525Trading idea - Hit the top > 507/423.60%
Chart time frame:D
A) 15 min(1W-3M)
B) 1 hr(3M-6M)
C) 4 hr(6M-1year)
D) 1 day(1-3years)
Stock progress:E
A) Keep rising over 61.80% resistance
B) 61.80% resistance
C) 61.80% support
D) Hit the bottom
E) Hit the top
Stocks rise as they rise from support a
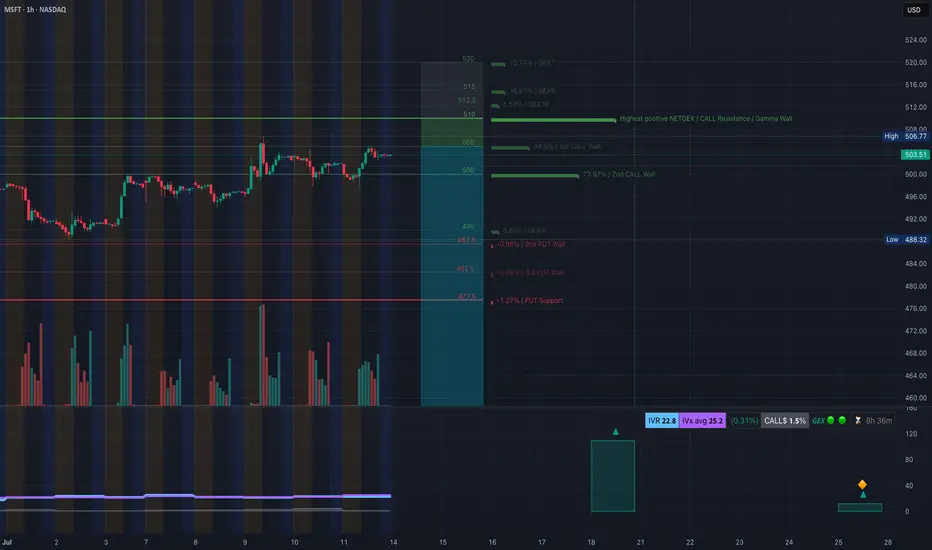
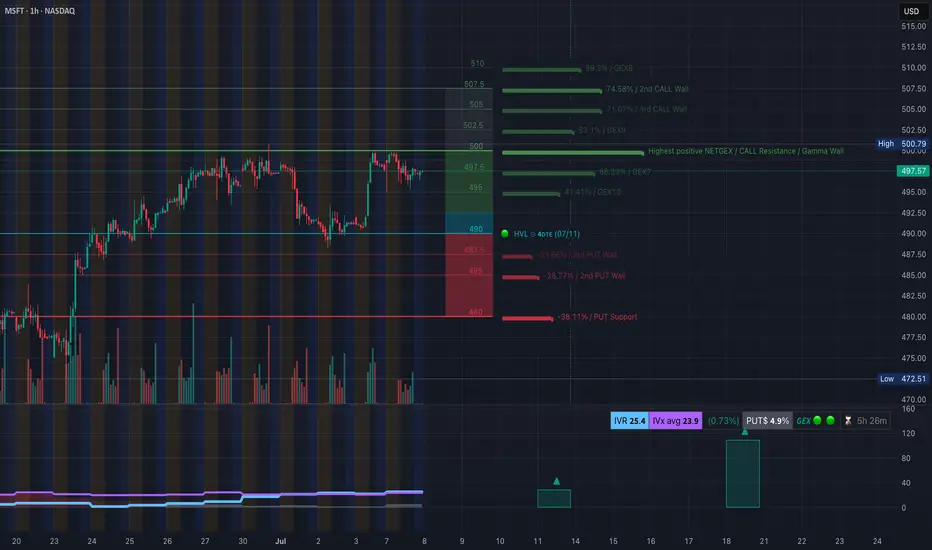
MSFT at Gamma Wall Crossroads–Will 506 Break This Time? July 14🧠 GEX and Options Sentiment (TanukiTrade GEX)
* GEX Zone Summary:
* 📈 Call Wall 1 (503.5–506.7) → major Gamma Resistance.
* 🧱 Gamma Wall (506.77) = Highest positive NETGEX — key sell zone for market makers.
* 🟢 GEX Flow: Moderate call dominance (1.95%) — not yet extreme bullish.
* 🟣
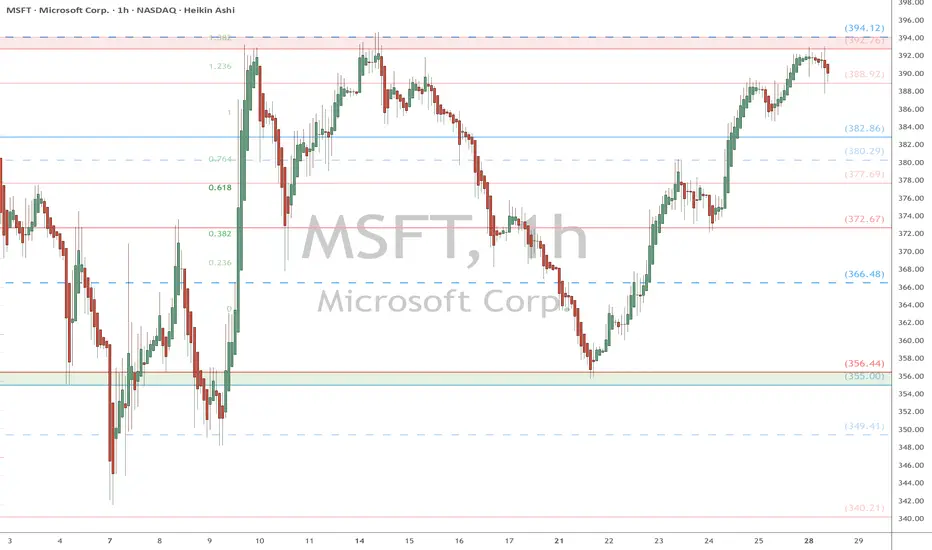
MSFT watch $392.76-394.12: Key Resistance to Tariff RecoveryMSFT testing a well proven Resistance zone $392.76-394.12
This zone rejected twice already, now may be ready to break?
Fib reactions have been precise, so look for Break-n-Retest
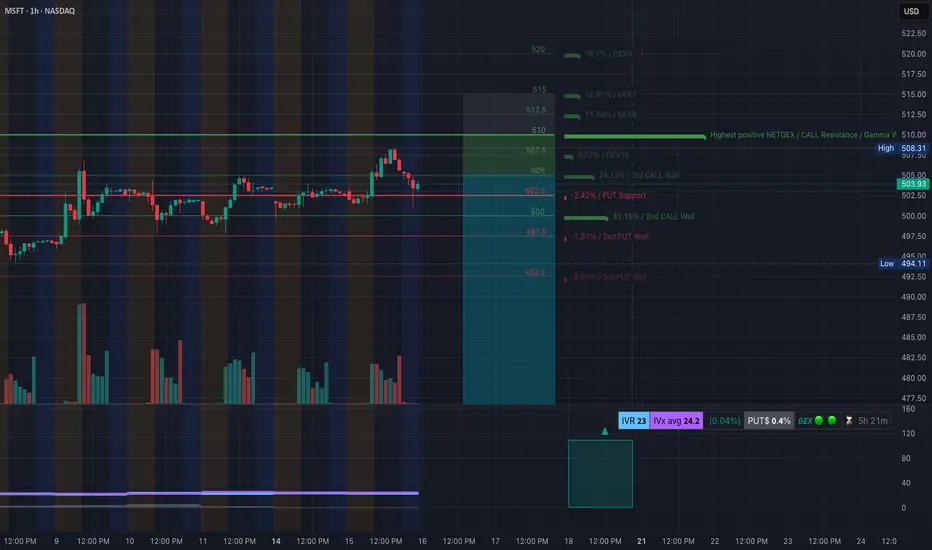
MSFT Setting Up for a Breakdown or Bounce - July 16MSFT Setting Up for a Breakdown or Bounce – Key Option Levels in Play 💥
🔹 Options GEX Analysis (Tanuki GEX View):
* Gamma Resistance (Call Wall):
→ $510 is the highest GEX level, acting as a ceiling.
→ $507.5 is the 3rd Call Wall and minor resistance.
* PUT Walls and Gamma Support:
→ $502.5 = HVL (
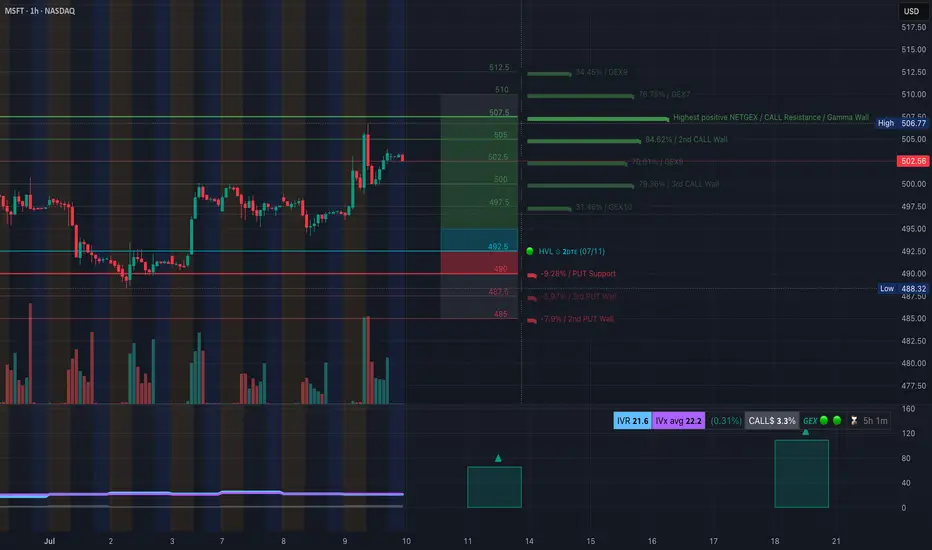
MSFT Charging Toward Resistance for July 10MSFT Charging Toward Resistance — What the Gamma Map Reveals for This Week’s Trading
🔍 GEX Analysis – Options Sentiment Outlook
MSFT’s current positioning reveals a relatively neutral options sentiment with slight bullish bias:
* GEX at $507.12 marks the highest positive gamma exposure and major re
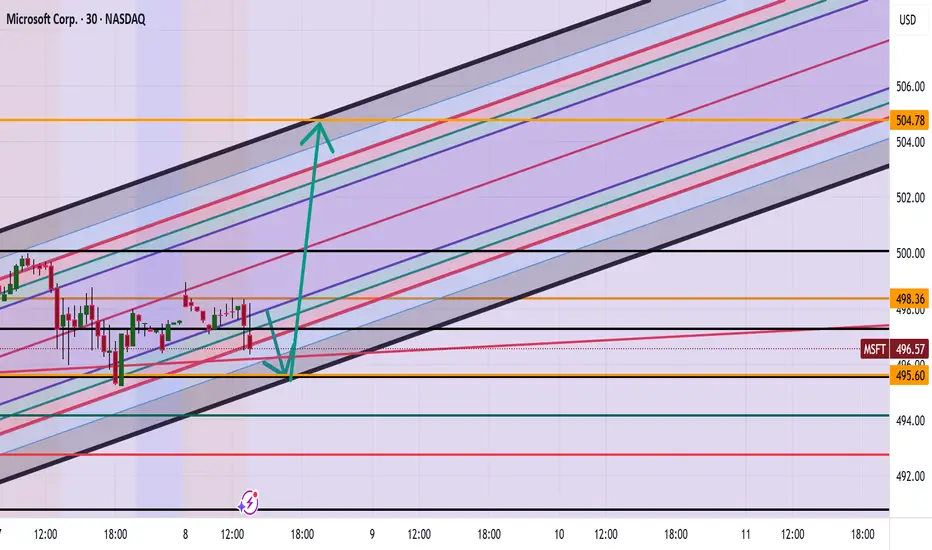
MSFT Correction then to 504?Morning everyone
Currently we are seeing a possible correction to the 495 zone with a possible break to the upside to 504 is what we are currently seeing.
Trade Smarter Live Better
Kris/Mindbloome Exchange
MSFT at Decision Point: Options GEX & Smart Money Clues🧠 Options GEX Analysis – Bullish Bias Above 497.5
* Gamma Wall / Resistance at 500–502.5
There is clear call resistance at 500.79, aligning with heavy GEX levels at 502.5 and 507.5, with the 2nd Call Wall peaking at 74.58%. This sets a magnetic zone IF MSFT pushes above 498.
* Below 490 = Risky Terr
Don't Short MSFT. 2 long scenarios. Hi, I’m The Cafe Trader.
Today we’re diving into the heart of this very bullish run on MSFT. One of the key lessons I’ve learned:
Never get in the way of a strong bull trend — especially just after a breakout.
⸻
🔍 Price Action Overview:
MSFT has been respecting a strong trendline since its init
See all ideas
Summarizing what the indicators are suggesting.
Oscillators
Neutral
SellBuy
Strong sellStrong buy
Strong sellSellNeutralBuyStrong buy
Oscillators
Neutral
SellBuy
Strong sellStrong buy
Strong sellSellNeutralBuyStrong buy
Summary
Neutral
SellBuy
Strong sellStrong buy
Strong sellSellNeutralBuyStrong buy
Summary
Neutral
SellBuy
Strong sellStrong buy
Strong sellSellNeutralBuyStrong buy
Summary
Neutral
SellBuy
Strong sellStrong buy
Strong sellSellNeutralBuyStrong buy
Moving Averages
Neutral
SellBuy
Strong sellStrong buy
Strong sellSellNeutralBuyStrong buy
Moving Averages
Neutral
SellBuy
Strong sellStrong buy
Strong sellSellNeutralBuyStrong buy
Displays a symbol's price movements over previous years to identify recurring trends.
ATVI5026499
Activision Blizzard, Inc. 2.5% 15-SEP-2050Yield to maturity
8.44%
Maturity date
Sep 15, 2050
ATVI4499883
Activision Blizzard, Inc. 4.5% 15-JUN-2047Yield to maturity
7.80%
Maturity date
Jun 15, 2047
ATVI5026498
Activision Blizzard, Inc. 1.35% 15-SEP-2030Yield to maturity
6.17%
Maturity date
Sep 15, 2030
See all MSFT bonds
Curated watchlists where MSFT is featured.