Market analysis from FOREX.com
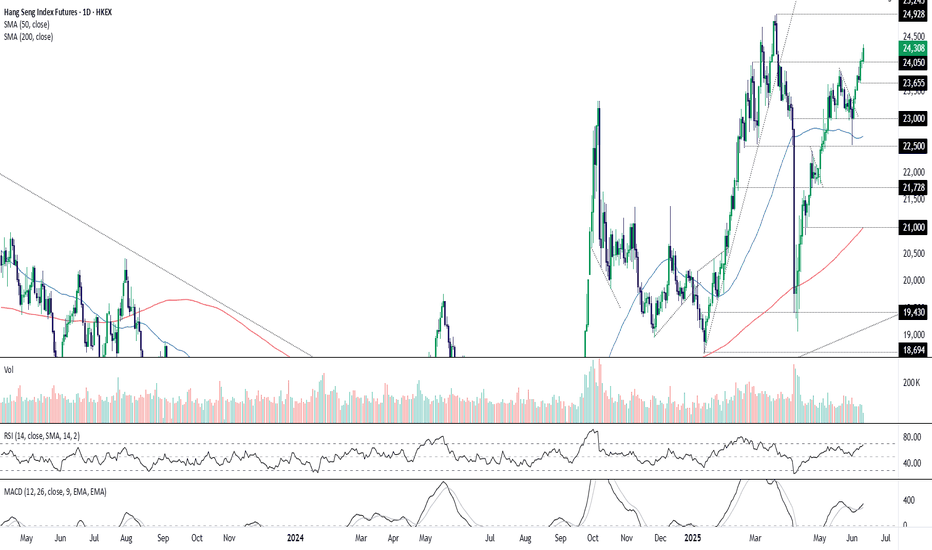
Hang Seng futures have broken above resistance at 24,050 following the latest batch of positive trade headlines, leaving the index on track for a potential retest of the March highs. Those eying longs could buy dips towards 24050 with a stop beneath the level for protection. Both RSI (14) and MACD are trending higher without flashing overbought signals, favouring...
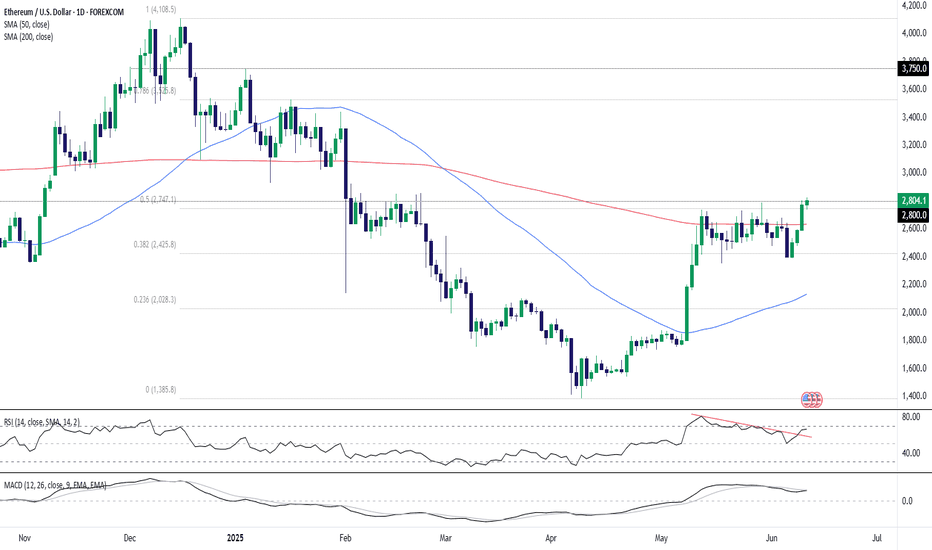
ETH/USD has pushed above $2800, a key level it has done significant work either side of going back to 2022. Having broken above the important 200-day moving average earlier this week, and with indicators like RSI (14) and MACD pointing to growing topside momentum, a close above $2800 may encourage other bulls to join in the run higher. If the price can hold...
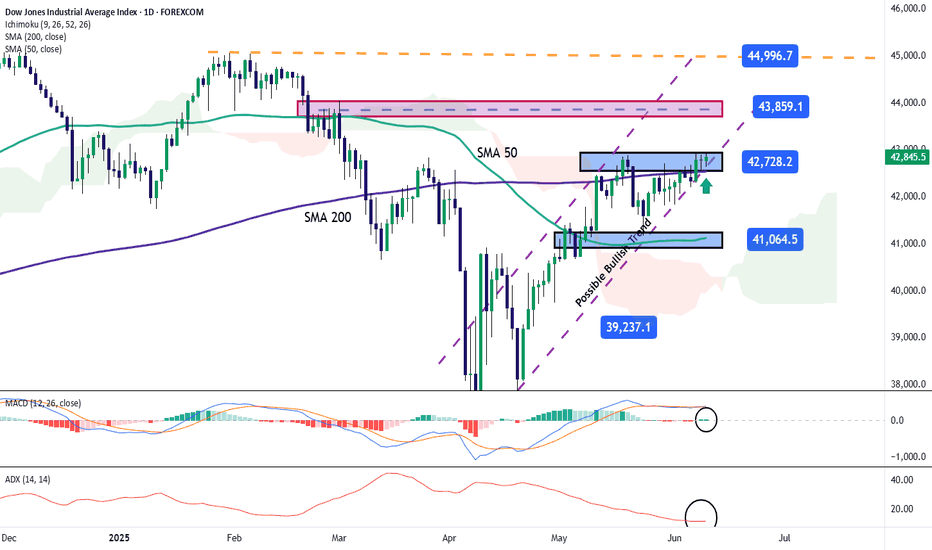
The Dow Jones has gained more than 1% over the last three trading sessions and is now attempting to consistently reach price levels not seen since March of this year. The bullish bias has remained steady as investor confidence has recovered, driven by ongoing economic negotiations between the United States and China. The potential easing of trade tensions has...
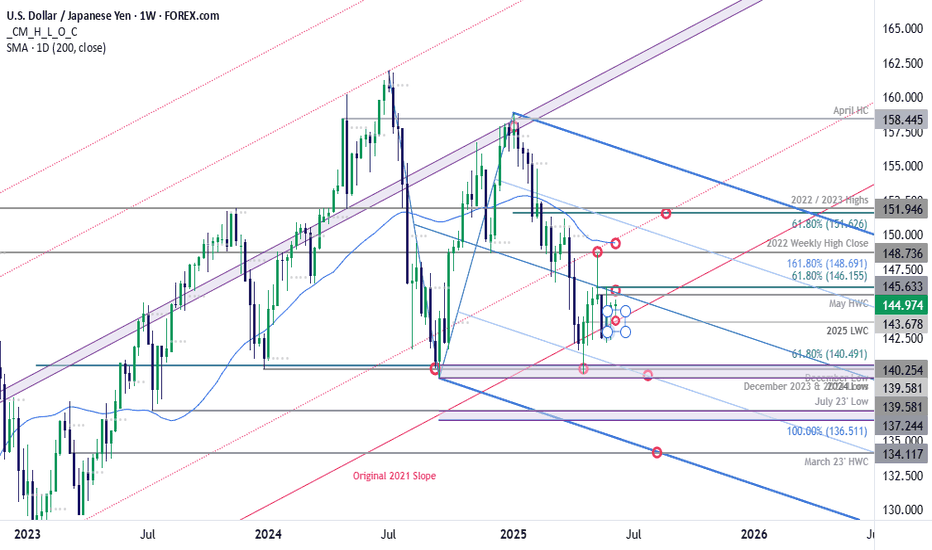
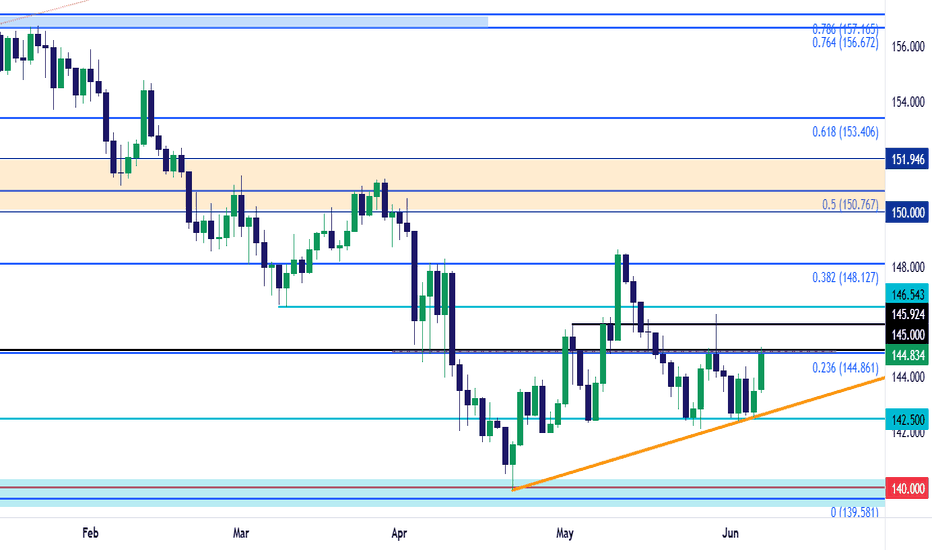
USD/JPY plunged 4.4% into the close of May- The bears have been unable to break the 2021 original slope line, and the immediate focus is on a breakout of near-term range above support. Initial weekly resistance is now eyed with the May high-week close (HWC) / 61.8% retracement of the May decline at 145.63-146.15- a breach / weekly close above this level would be...
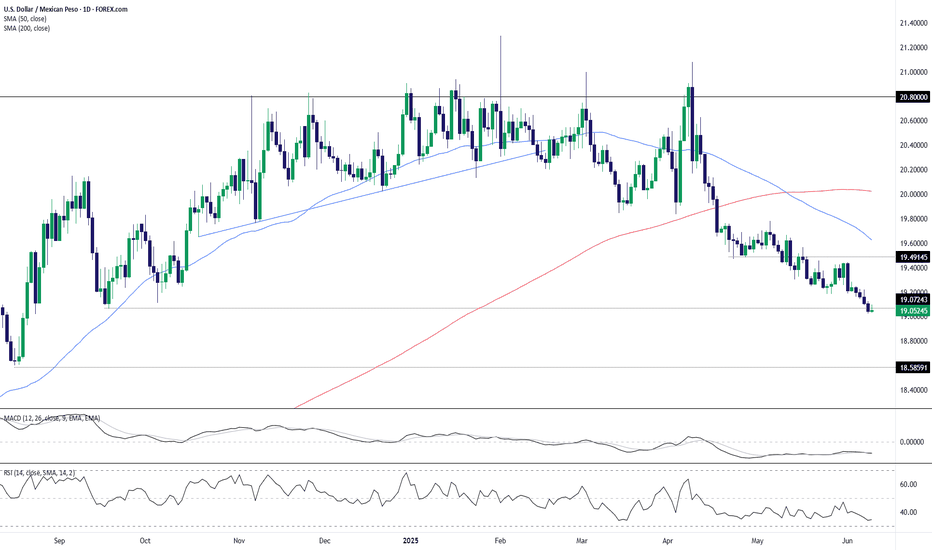
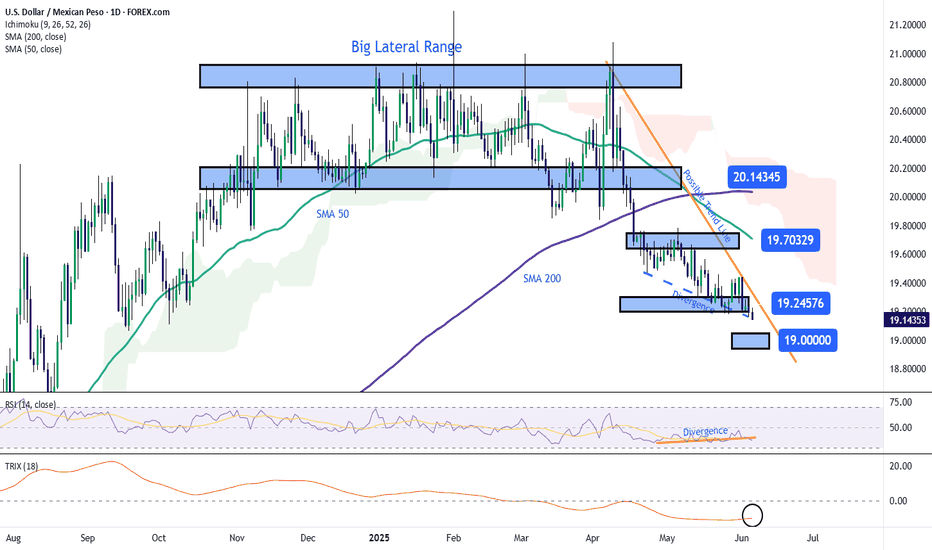
USD/MXN continues to grind lower, maintaining a persistent downtrend that has remained intact since mid-April. The pair is currently hovering near a short-term support area just above 19.00, with little sign of bullish reversal as of now. 🔍 Technical Breakdown Bearish Structure: Price remains below both the 50-day (19.63) and 200-day (20.02) SMAs, with both...
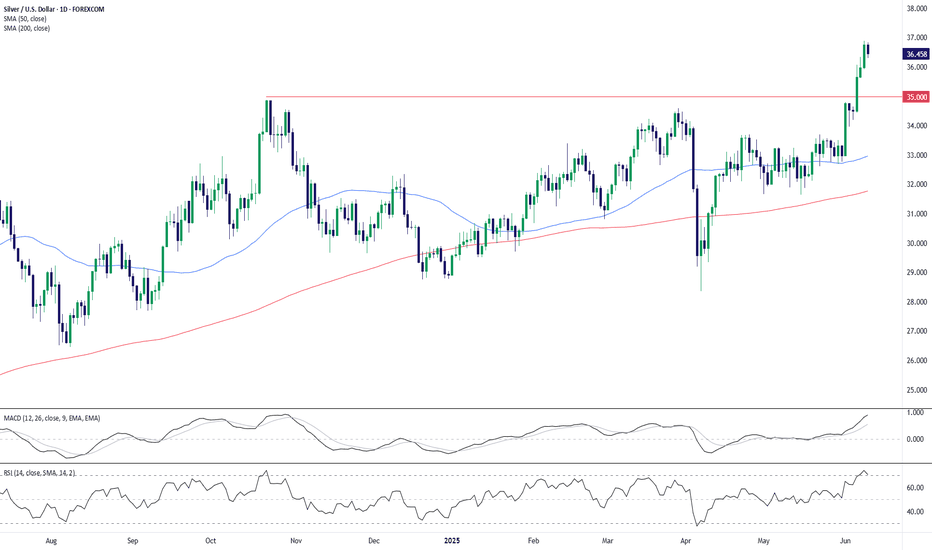
Silver (XAG/USD) has punched through a major horizontal resistance level around the psychological $35.00 mark, marking a significant technical breakout with bullish continuation potential. 🔍 Technical Highlights Breakout Above Multi-Month Resistance: Price has cleanly broken above the key $35.00 zone, which had capped upside since late 2023. The breakout follows...
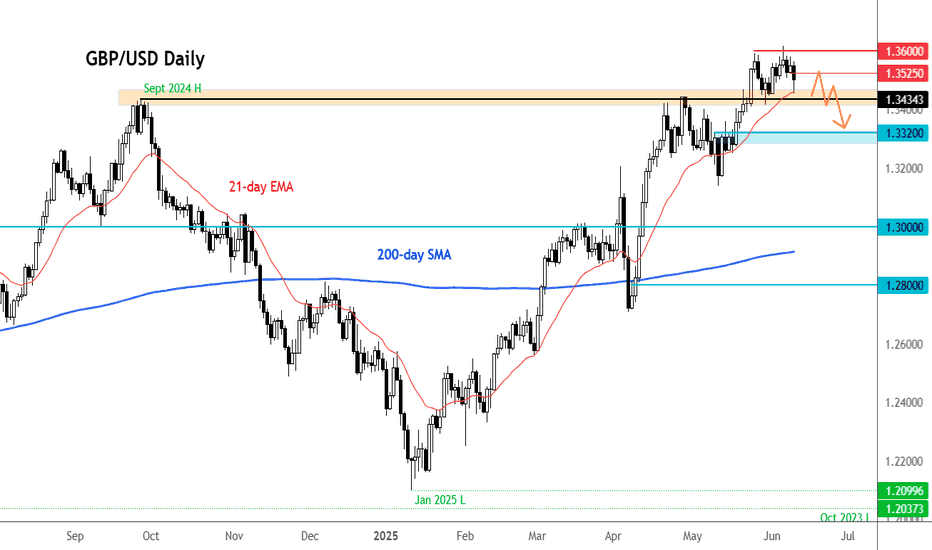
After an initial tumble to just shy of 1.3450 in response to this morning’s disappointing UK jobs and wages print, the pound staged a spirited recovery, climbing back to a high of 1.3536. However, that rebound appears to be fading, with sterling once again drifting lower as the US dollar finds its footing across the board. The underwhelming labour market data has...
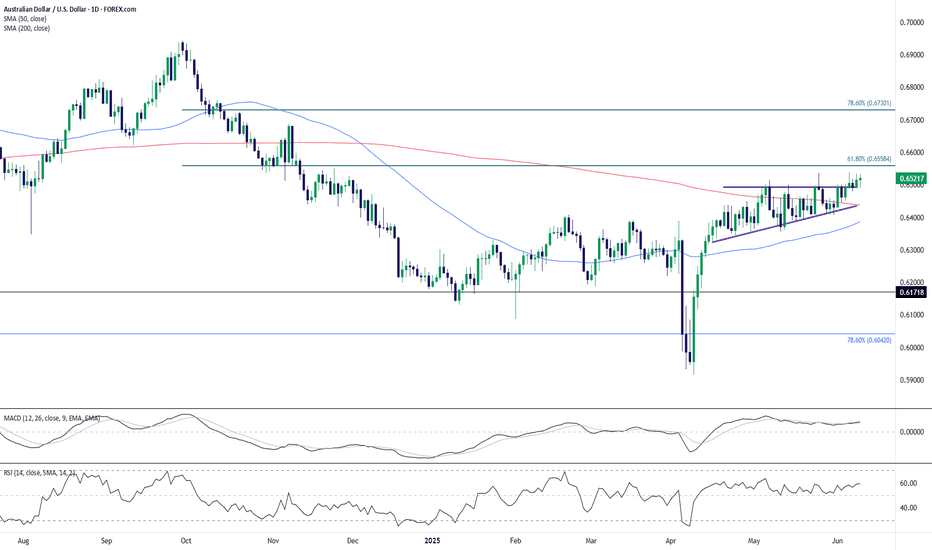
The AUD/USD daily chart has just confirmed a breakout from a sustained consolidation zone that had kept price action capped for nearly two months. The breakout clears the psychological and technical resistance near the 0.6500 level and puts bulls back in control. 🔍 Key Technical Highlights: Ascending Triangle Breakout: Price had been coiling into an ascending...
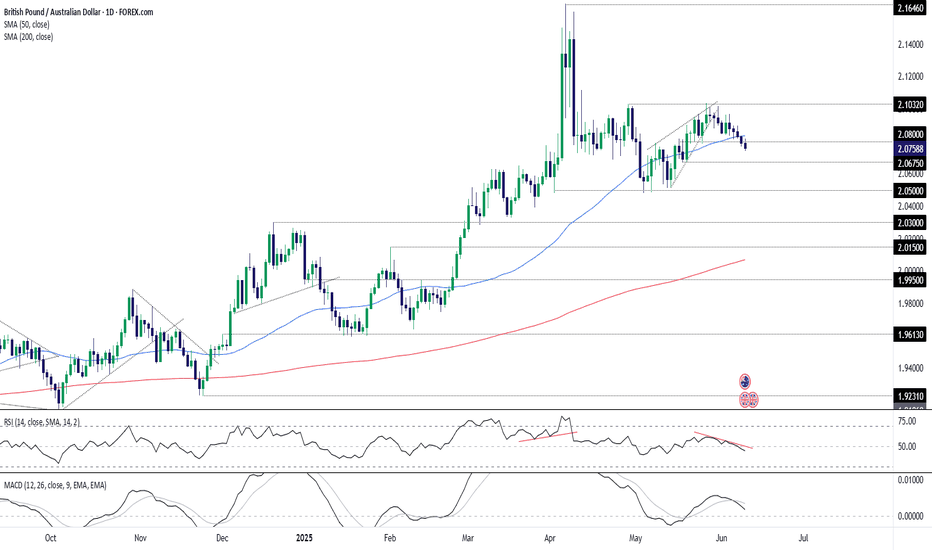
Trading beneath the 50-day moving average and support at 2.0800, and with momentum signals shifting from neutral to bearish, directional risks for GBP/AUD appear to be tilting lower. Those considering shorts could look to initiate positions beneath 2.0800, with a stop placed above it or the 50-day moving average for protection. Bids may emerge around 2.0675, but...
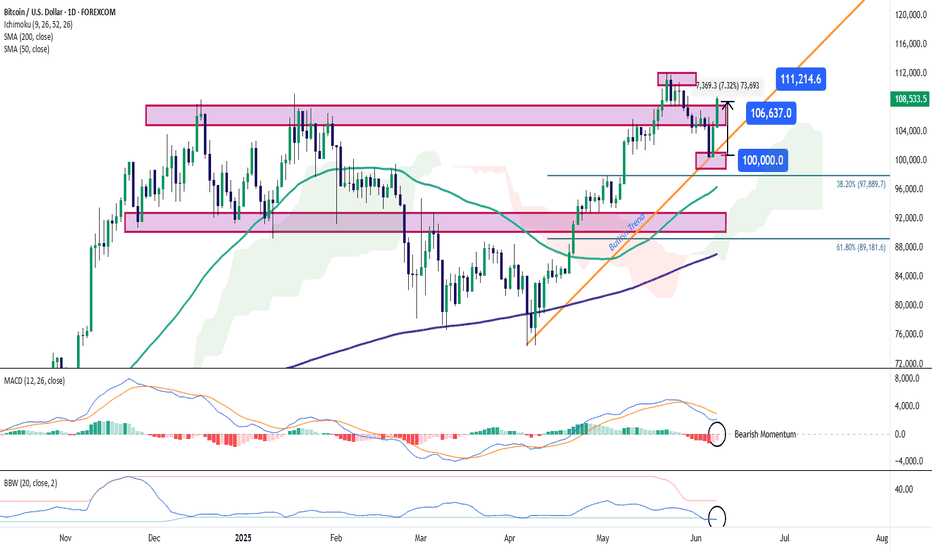
Bitcoin has seen a strong bullish surge in recent trading sessions, climbing more than 7% and now trading back above $108,000 per BTC. The buying bias has been consistently fueled by the announcement from Metaplanet, which plans to raise over $5 billion to acquire Bitcoin — a move that has temporarily restored short-term confidence in the market. As euphoria...
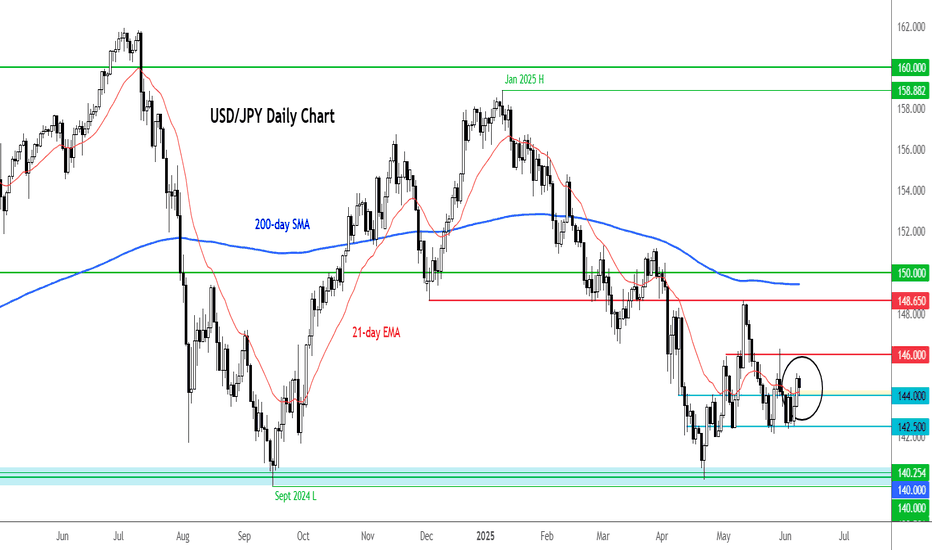
The USD/JPY direction has turned somewhat bullish in recent days as improving risk appetite and optimism over US-China trade talks lifted the dollar and pressurized the safe-haven yen. The pair held firm above key support at 142.50, with sentiment-driven flows favoring the greenback. This week’s focus shifts to key US data releases—CPI on Wednesday and UoM...
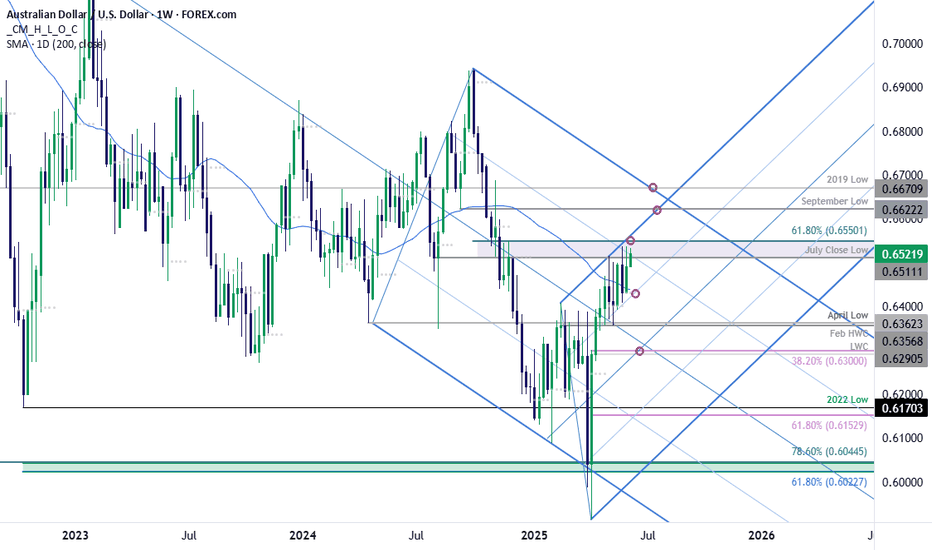
Aussie is trading into a critical resistance range into the start of the week at 6511/50- a region defined by the July close low and the 61.8% retracement of the 2024 decline. Note that the 75% parallel converges on this threshold this week – looking for possible inflection here with the near-term rally vulnerable while below. A topside breach exposes a...
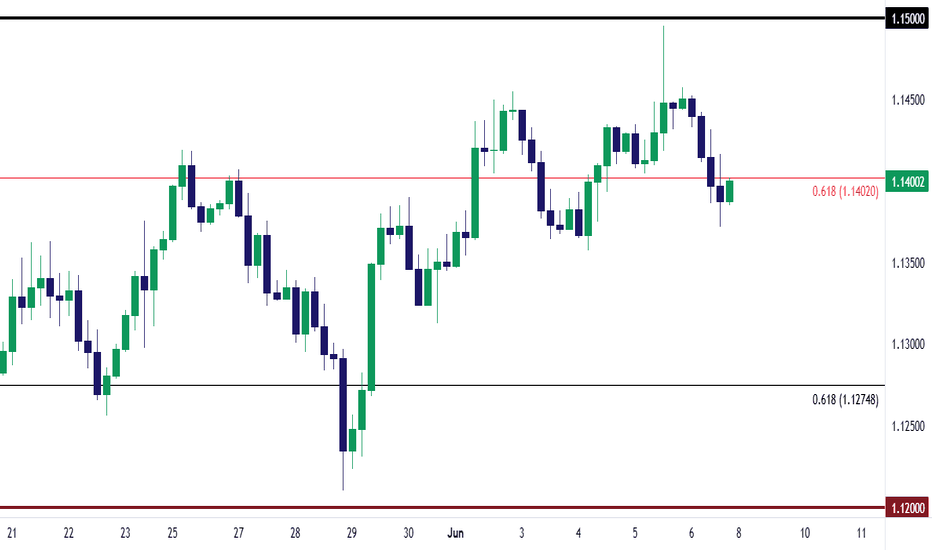
For EUR/USD it's what didn't happen this week... Despite a seemingly open door for bulls to run a breakout, helped along by a Christine Lagarde that sounded less dovish than usual at Friday's rate cut, the pair put in a hard charge towards the 1.1500 handle but interestingly fell just about 5 pips short of the big figure. That's the same price that helped to...
USD/JPY continues to exert force on the USD and the past week was no different. Despite an open door for sellers, a higher-low showed with a hold of the same 142.50 support level that was in-play a week prior. That price traded early on Tuesday (Monday night in the states) and then on Thursday (Wed night in the U.S.) buyers came in to hold the low just above that...
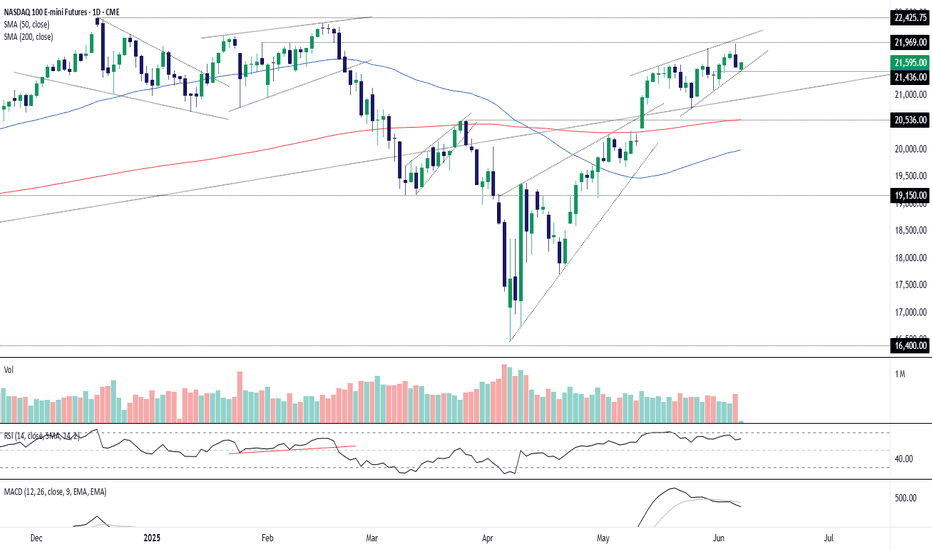
Thursday’s Tesla-driven sell-off in Nasdaq 100 futures may flip into a Friday squeeze ahead of nonfarm payrolls, with Politico reporting that Elon Musk and Donald Trump have a scheduled phone call later today to broker a peace deal. Given their sparring on Thursday was a key factor behind the Nasdaq nosedive, the headlines could help reverse the move into the...
Over the last four trading sessions, the USD/MXN pair has dropped more than 1.5% in favor of the Mexican peso as the U.S. dollar continues to weaken in the short term. The index that measures the strength of the U.S. dollar (DXY) remains consistently below the 100-point level, highlighting the broad weakness of the currency. This has, in part, allowed the current...
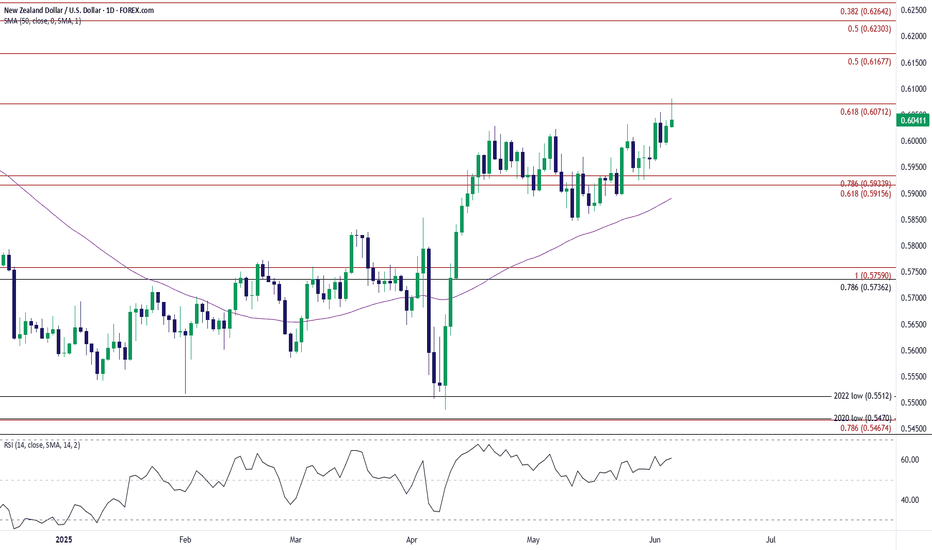
NZD/USD breaks out of the range bound price action from earlier this week to register a fresh yearly high (0.6080). Still need a close above 0.6070 (61.8% Fibonacci extension) to open up 0.6170 (50% Fibonacci extension), with the next area of interest coming in around 0.6230 (50% Fibonacci extension) to 0.6260 (38.2% Fibonacci extension). At the same time, lack...
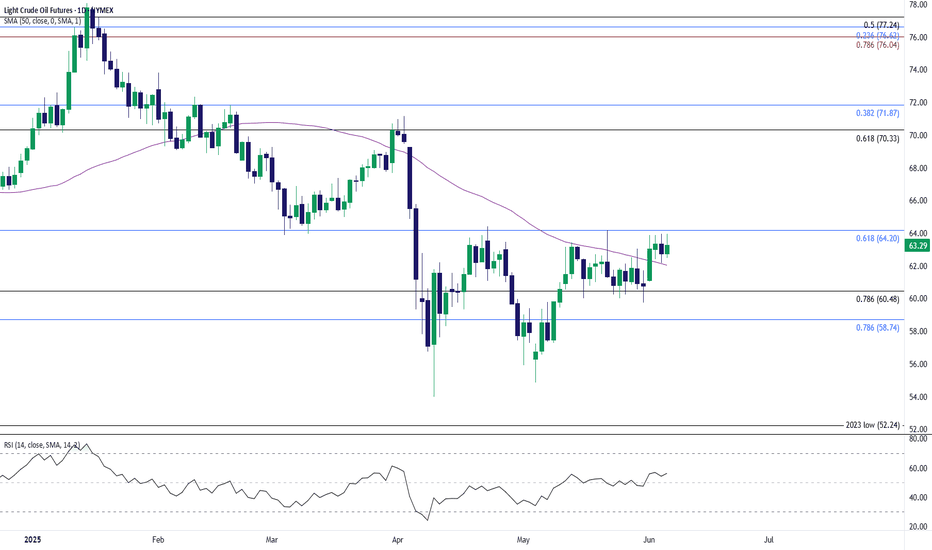
The price of oil is on the cusp of testing the May high ($64.19) after closing above the 50-Day SMA ($62.04) for the first time since April, with a break/close above $64.20 (61.8% Fibonacci retracement) bringing the April high ($71.16) on the radar. Need a move/close above the $70.30 (61.8% Fibonacci retracement) to $71.90 (38.2% Fibonacci retracement) zone to...
