Market analysis from FOREX.com
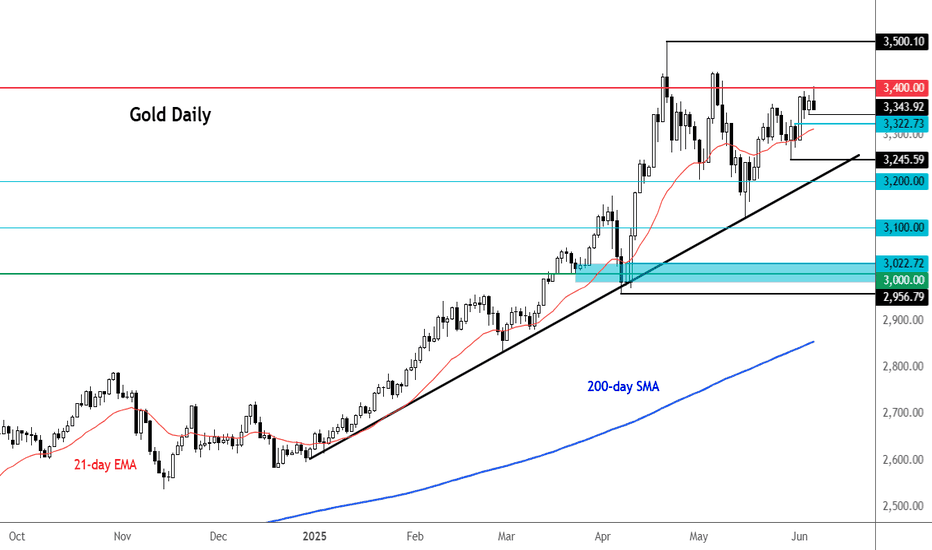
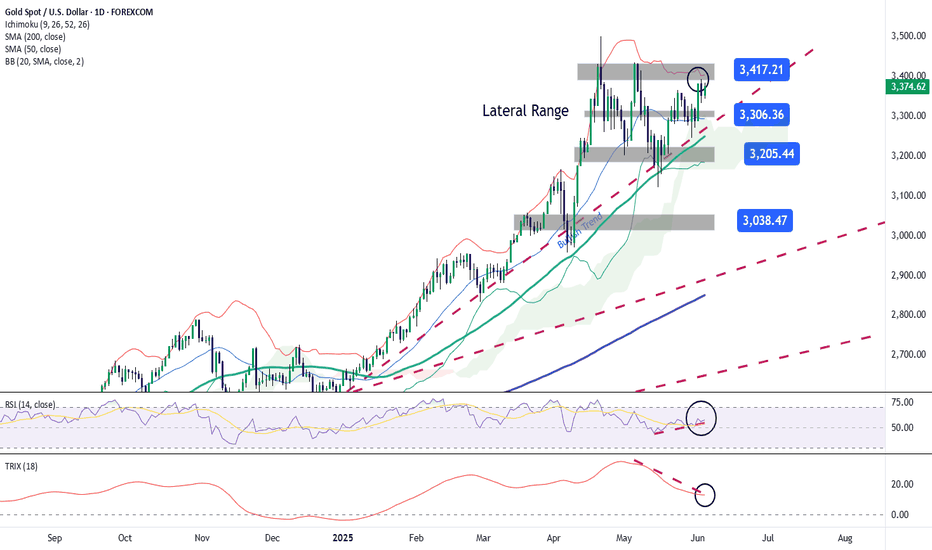
Gold has turned lower on the day, slipping after it failed to hold above the key $3400 resistance level. Despite a major breakout in silver, gold couldn't ride the wave, turning negative as risk sentiment improved on news of a "very positive" Trump-Xi call and renewed US-China trade talks. The move also came alongside firmer commodity currencies and a rebound in...
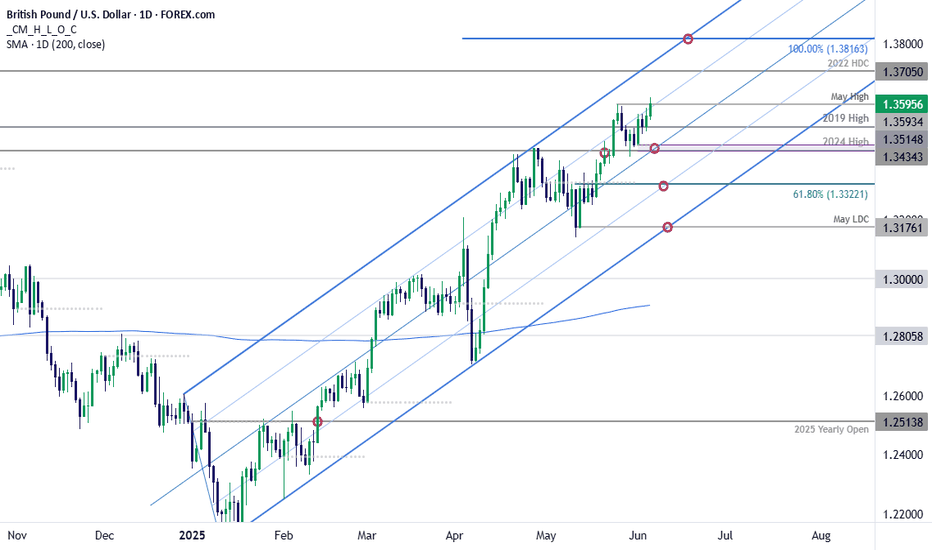
A rebound off former resistance is now testing the highs with the weekly / monthly opening-range taking shape just below. GBP/USD is attempting to breach the yearly 75% parallel in early US trade on Thursday. The immediate focus is on today’s close with respect to this threshold. Initial support rests with the weekly open / 2024 high at 1.3434. Note that the...
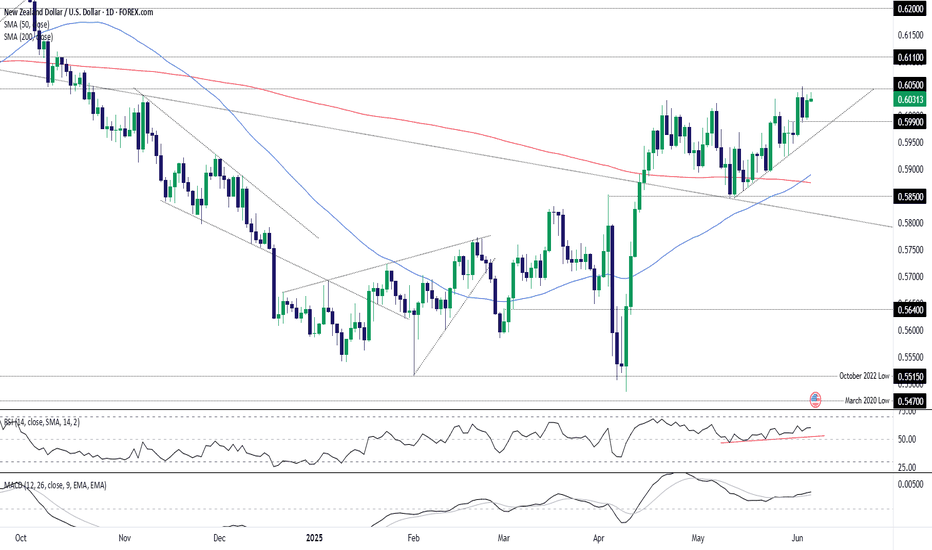
NZD/USD is holding an established uptrend with bullish momentum building, supported by strengthening RSI and MACD signals. The pair is testing key resistance at .6050—a level that’s capped price repeatedly over the years. A break and close above would confirm a bullish setup, allowing for longs to be established above the level with a stop just beneath. Initial...
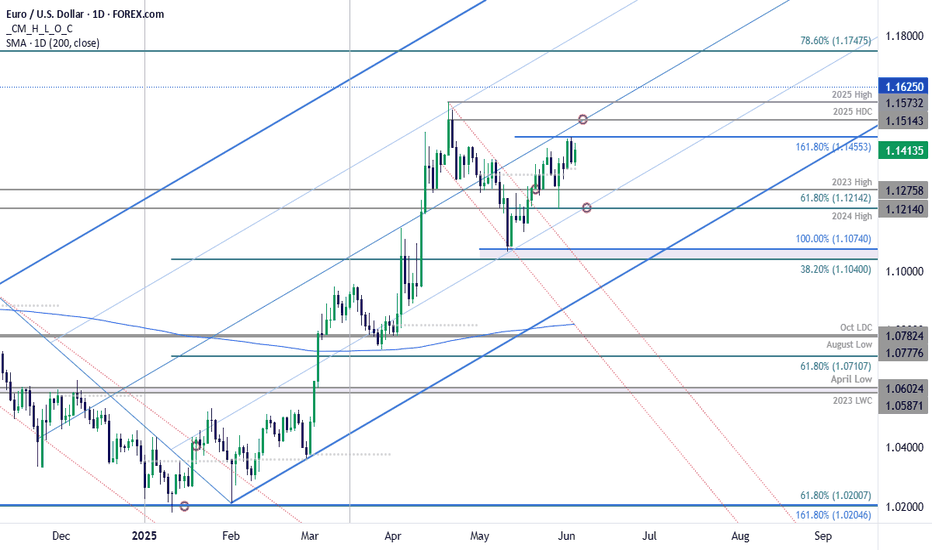
Euro broke above the April downtrend last month with price surging more than 3.5% off the May low. The advance failed at technical resistance into the start of June at the 1.618% extension of the May advance near 1.1455. The focus is on a reaction off this mark with a breakout of the weekly opening-range to offer some guidance in the days ahead. The weekly-range...
The Australian Dollar broke back above the 200-day moving average this week with AUD/USD testing resistance at the 65-handle today. Its decision time for the Aussie as the bulls threaten to breakout of a multi-month range in price. Aussie is testing resistance today at the 2025 high-close / 61.8% extension of the Friday rally at 6495-6504 with key resistance seen...
Over the last three trading sessions, gold has gained just over 3%, and is once again approaching the $3,400 zone, where historical highs are currently holding. For now, the bullish bias behind the precious metal has remained intact, as market uncertainty continues to rise steadily due to developments related to the trade war and the ongoing conflict in...
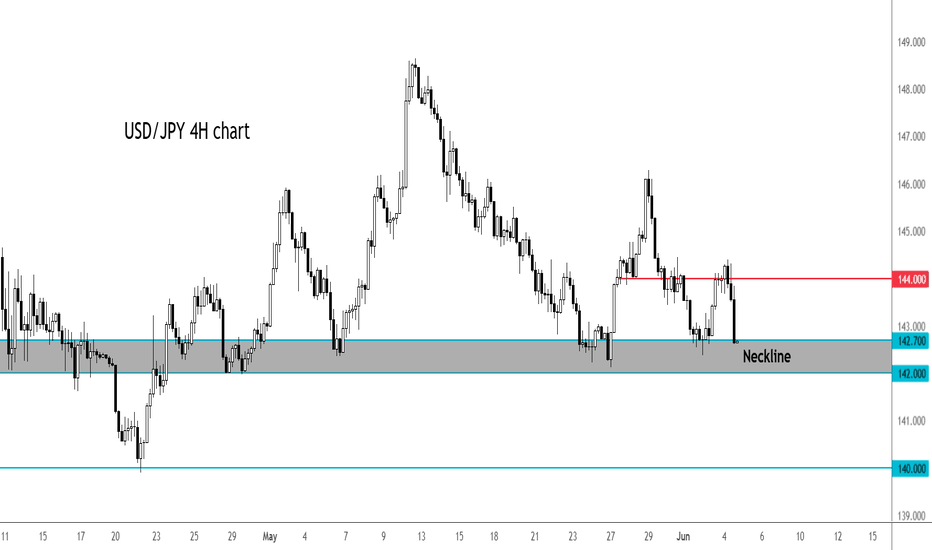
Today's soft US data releases weighed on US yields, which helped to further narrow the US-Japan spreads on the long dated bond yields. In turn, the USD/JPY gave up its entire gains from the day before when it was boosted by the JOLTS data. Next move could be defendant on the nonfarm payrolls report on Friday. From a technical point of view, this is text book...
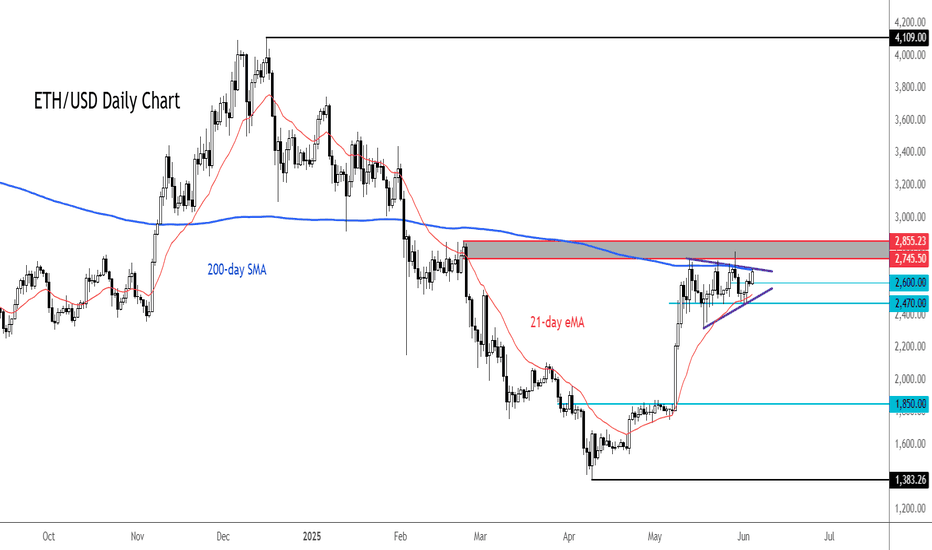
The ETH/USD has been coiling inside a bullish continuation pattern for several weeks now and a breakout could be on the cards soon. The consolidation suggests ETH is gearing up for a potential breakout soon, as it chips away at resistance coming from the 200-day moving average near $2700. Further resistance is seen between $2745 to $2855, as shaded in grey on...
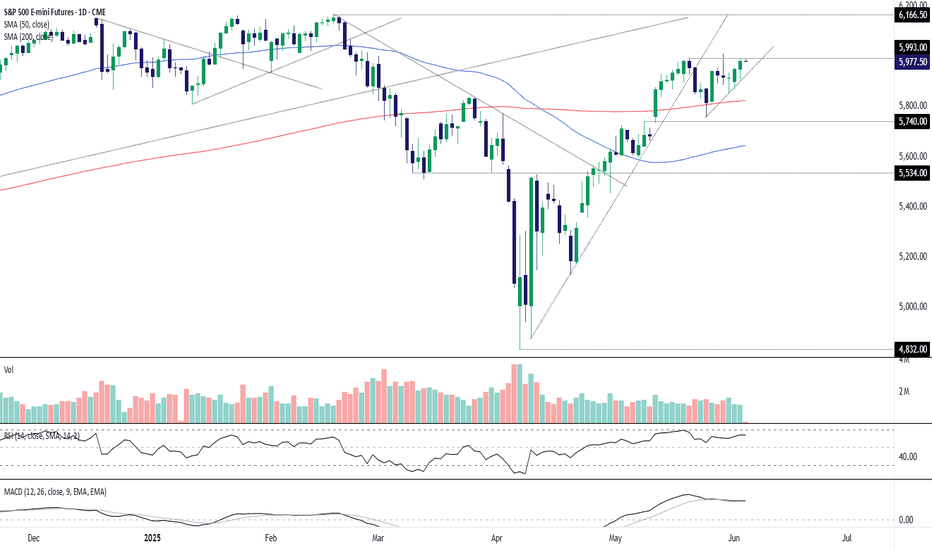
If at first you don’t succeed, try, try again. I suspect that’s what S&P 500 bulls are contemplating when it comes to clearing the psychologically important 6000 level in futures—although this time may meet with more success than when last tested in late May. Coiling within an ascending triangle pattern, and with bullish momentum starting to flick higher again,...
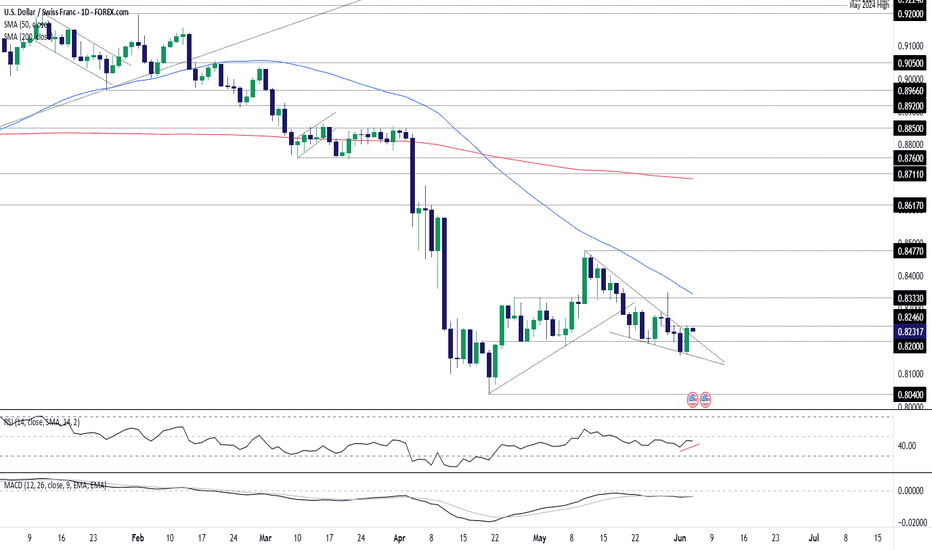
Risk of a countertrend squeeze in USD/CHF is building after it printed a bullish engulfing candle on Tuesday, breaking out of the falling wedge it had been trading in over recent weeks. While the price signal alone is bullish, to get excited about the prospect of a meaningful squeeze higher, USD/CHF needs to clear minor resistance overhead at .8246. If it can get...
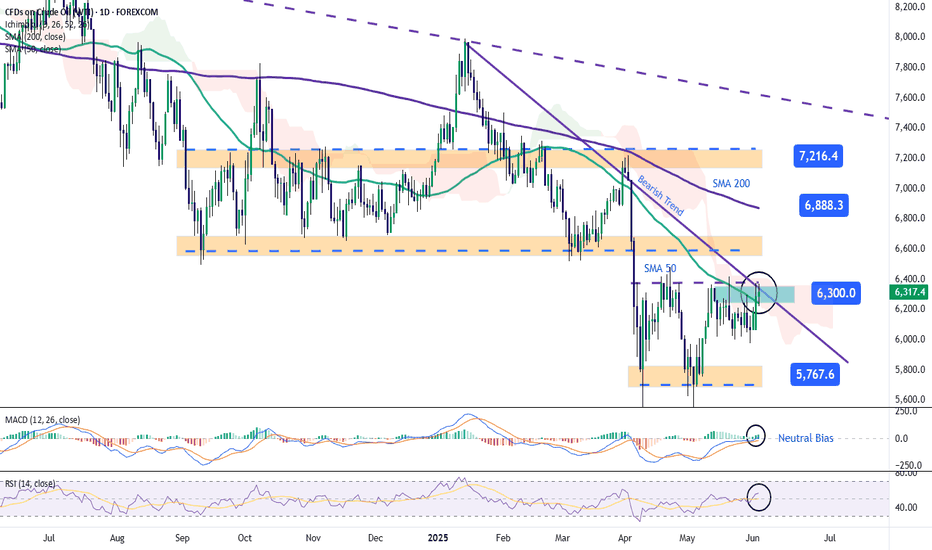
Over the past two trading sessions, WTI crude oil has gained more than 5%, as confidence has temporarily returned to the market following the latest OPEC+ announcements. The organization recently announced a new production increase of 411,000 barrels per day starting in July, but the volume was lower than anticipated, which has been interpreted as a positive...
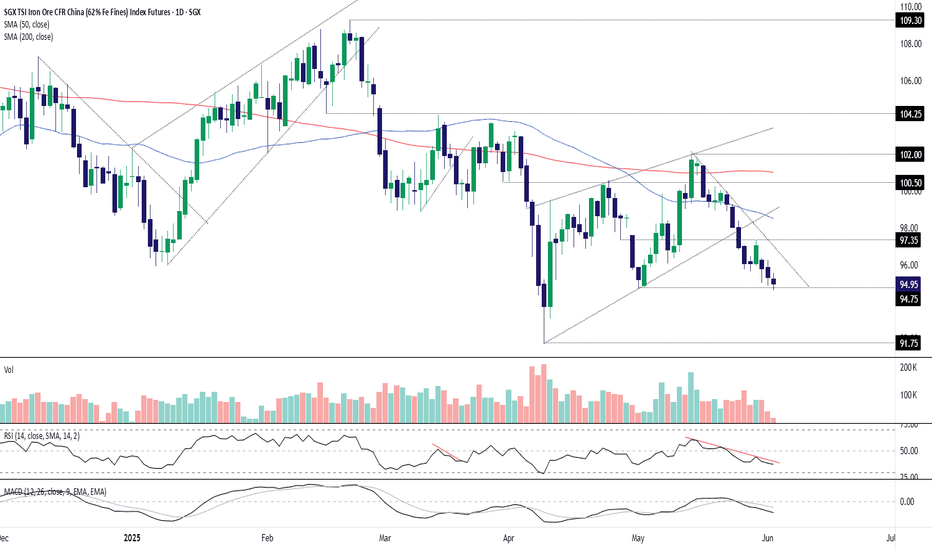
SGX iron ore looks heavy, threatening to extend the bearish break that began a week ago. The test and rejection at horizontal resistance at $97.35 last Thursday only adds to the bearish picture from momentum indicators like RSI (14) and MACD, reinforcing the bias to sell pops and downside breaks. The price now finds itself at an interesting spot on the charts,...
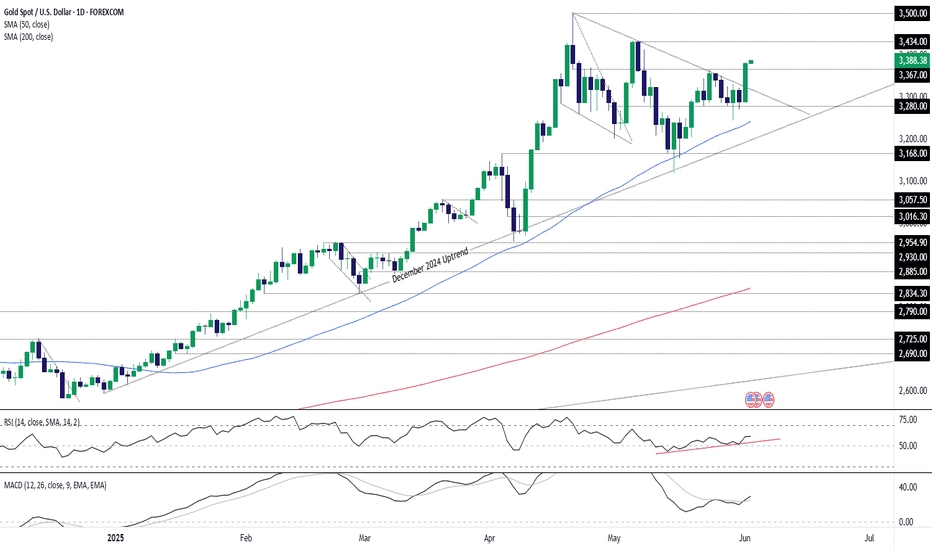
Having broken triangle resistance stemming from the record highs and cleared horizontal resistance at $3367, things are once again looking bullish for bullion. Add in renewed upward momentum in RSI (14) and a bullish MACD crossover, and the preference remains to buy dips and topside breaks. $3367 now looms as a key level to build bullish setups around, offering a...
One of the cleaner setups into the start of the week / month- Sterling opens the session with a test of confluent resistance into the yearly high-day close (HDC) at 1.3564- looking for a reaction there today with a breach / close above needed to fuel the next leg of the advance towards 1.3671-1.3705. Initial support rests with the 2019 high at 1.3515 backed...
Gold is poised to mark the largest single-day advance in nearly a month with XAU/USD stretching back into resistance at 3355/80- a region defined by the 61.8% retracement of the April decline and the record high-day reversal close. Looking for a reaction off this mark with a close above the median-line needed to fuel a run towards the record high-close at 3431 and...
The S&P 500, which ended Friday's session flat, has turned flat in today's session as well, after bouncing back from its earlier lows on reports that the US and Chinese leaders will meet to discuss trade after the two sides accused each other of violating their recent trade deal. June could be a more challenging month for stocks if trade uncertainty persists,...
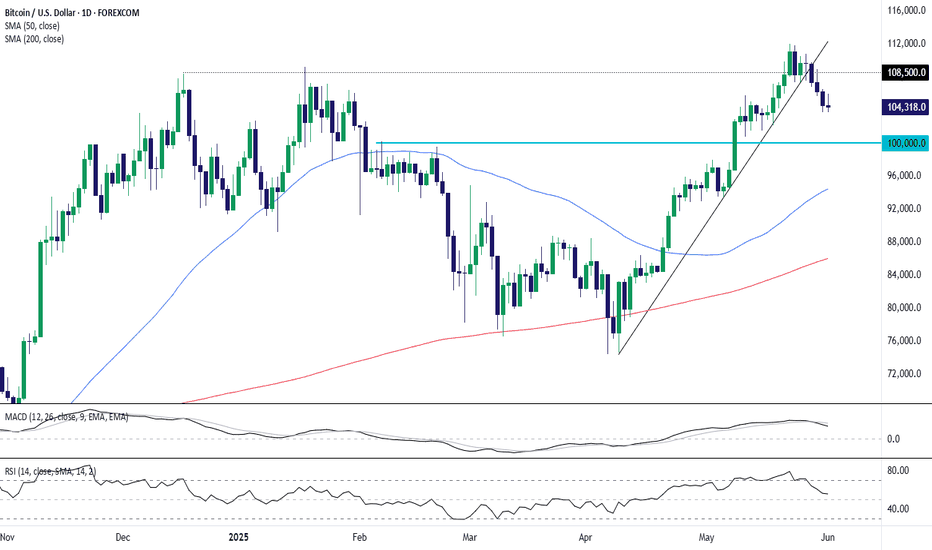
Bitcoin's rally stalled at the $108,500 resistance level, with prices now pulling back and breaking below the steep uptrend line. The MACD is crossing lower and RSI is falling toward neutral, indicating momentum may be shifting. With the 50-day moving average near $94,400 and horizontal support around $100,000, traders may look for signs of stabilization in that...
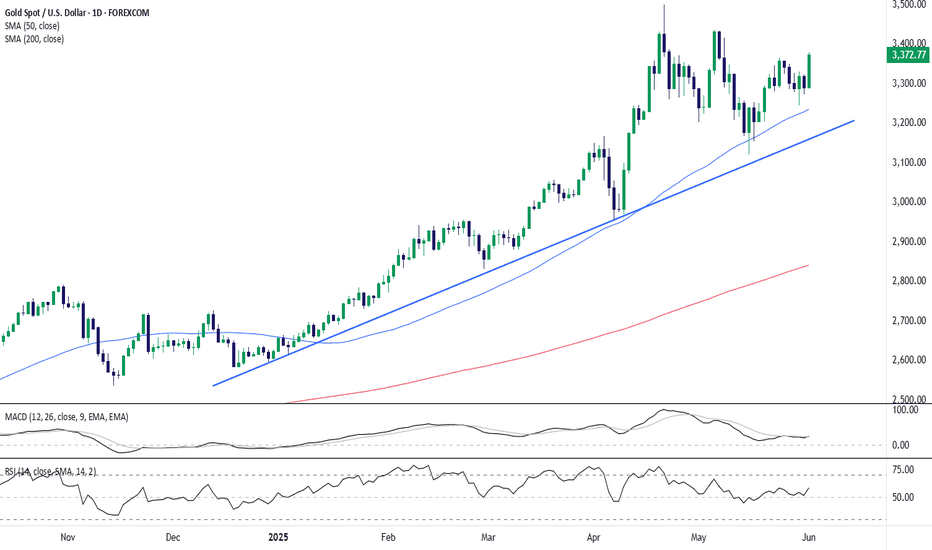
Gold is reasserting its uptrend following a strong bounce off confluence support around the 50-day moving average and trendline: Uptrend Intact: Price continues to respect the rising trendline and 50-day SMA (~$3,235), which acted as a springboard for the latest push. Momentum Shift: The MACD has turned higher again after cooling off through April-May, while RSI...
