Market analysis from FOREX.com
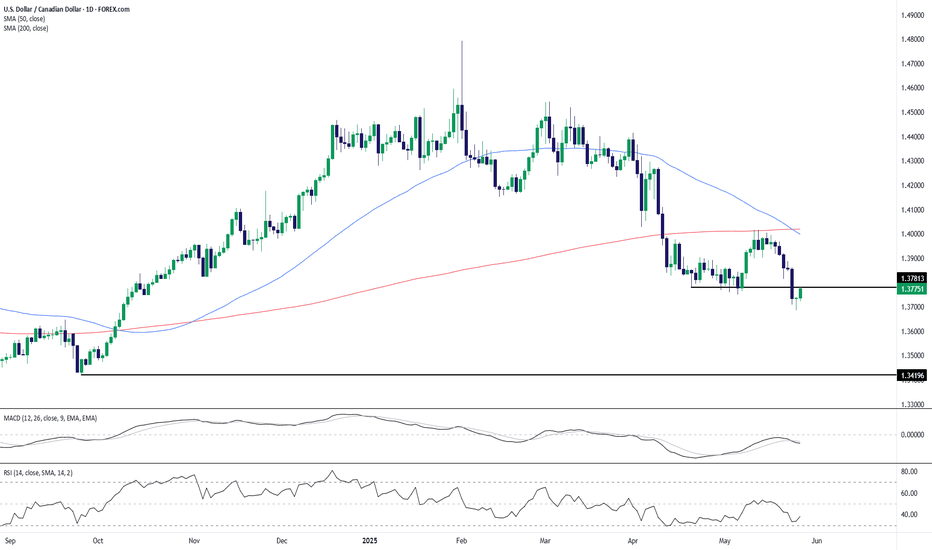
USD/CAD is clinging to key horizontal support around 1.3780 after a recent sharp decline: Support Retest: Price briefly dipped below the 1.3780 area before buyers stepped in, forming a potential short-term base. Downtrend Intact: Price remains well below both the 50- and 200-day SMAs, which are beginning to fan out—an increasingly bearish configuration. ...
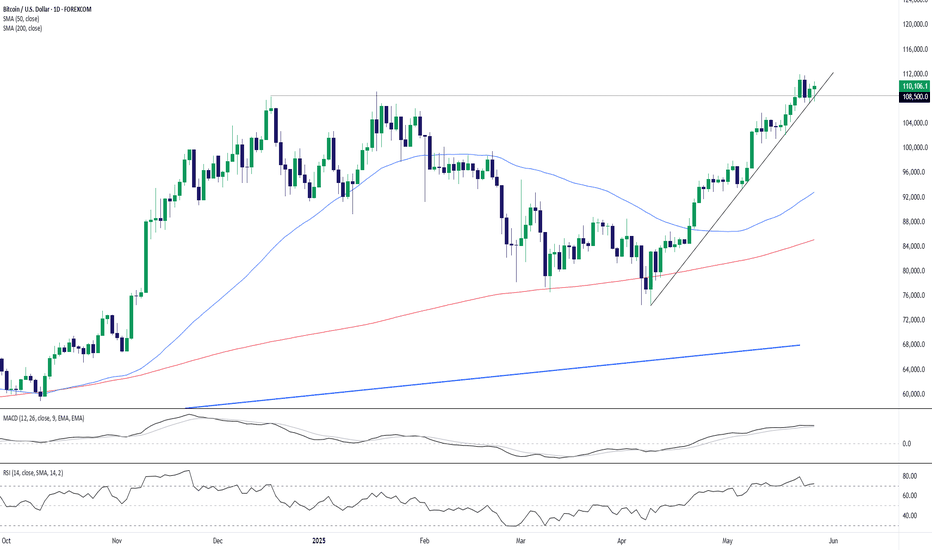
Bitcoin (BTC/USD) has officially broken above the psychologically and technically significant 108,500 zone, confirming bullish continuation: Trendline Support Holds: The rising trendline from March remains intact and continues to guide the advance. Breakout Confirmation: Price is now comfortably above previous resistance at 108,500, turning it into new...
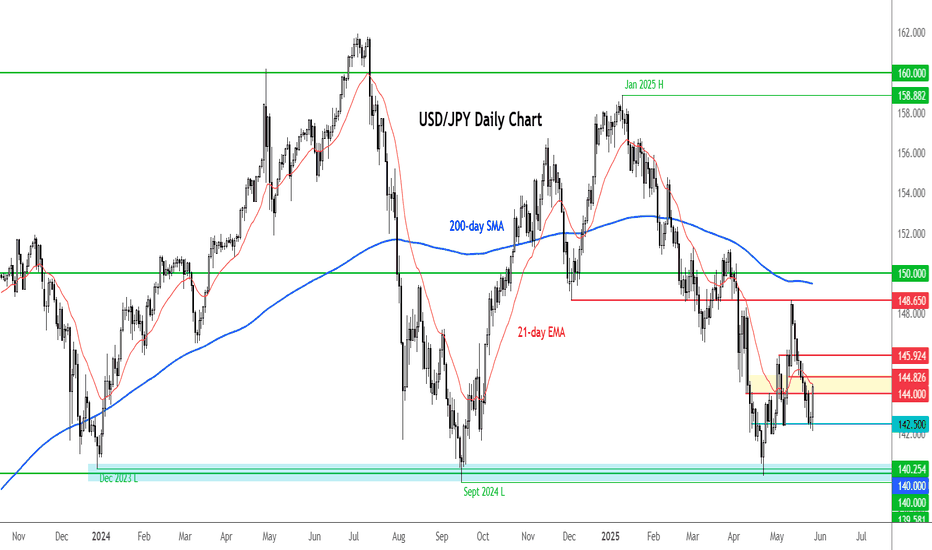
The USD/JPY has rallied decisively today, aided by the shift in Japanese bond sentiment. The pair has broken several short-term levels and moving averages. At the time of writing, it was trading bang in the middle of the 144.00 -144.80 resistance area, formerly support. We also have the 21-day exponential moving average residing here. As things stand, the next...
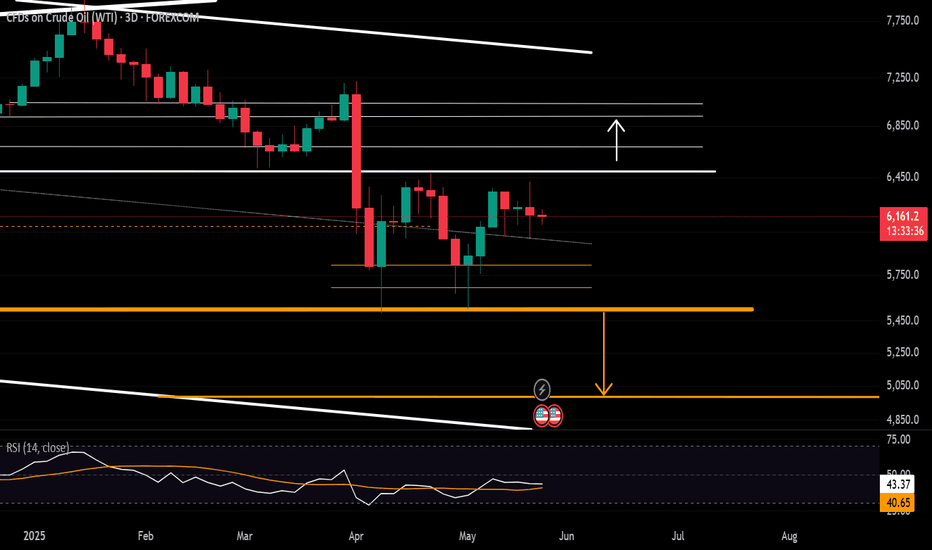
Crude oil remains locked in a resilient sideways range, with strong support between $55 and $58, and a key resistance zone between $63 and $65. Momentum indicators are mixed: • Daily RSI remains neutral, allowing for both bullish and bearish scenarios. • Weekly RSI shows a clean bounce from 2020 extremes, suggesting underlying bullish potential. Scenarios to...
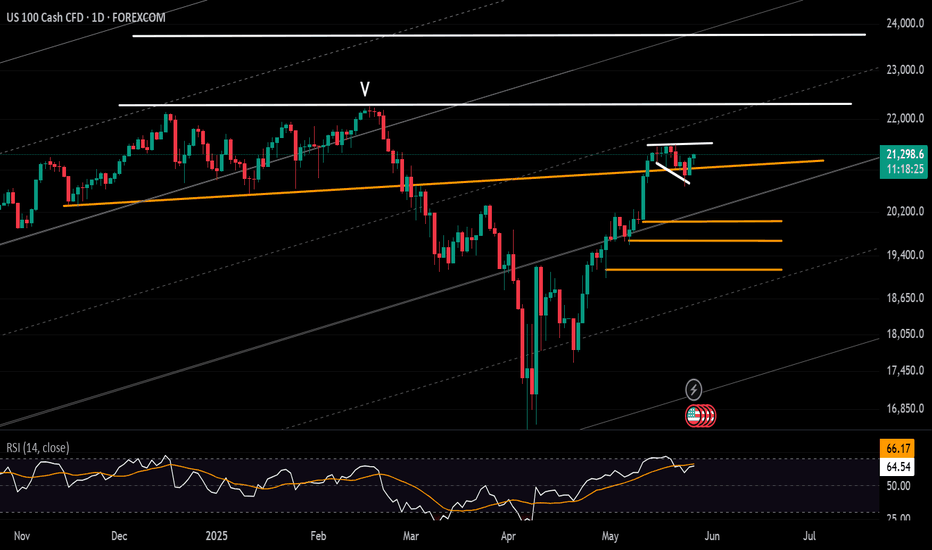
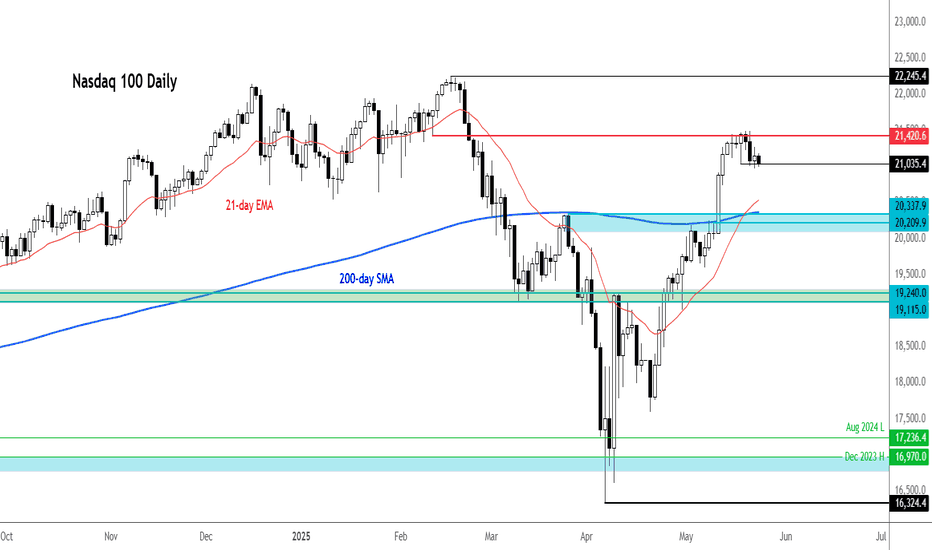
Despite Risk-Off Headlines, Nasdaq Remains Resilient AI remains embedded in long-term national strategies across 2030 and beyond, which is keeping tech resilient even amid trade uncertainty and weaker economic data. Markets are now eyeing NVIDIA’s earnings on Wednesday. Expectations are high, but the announcement could raise volatility risks, particularly...
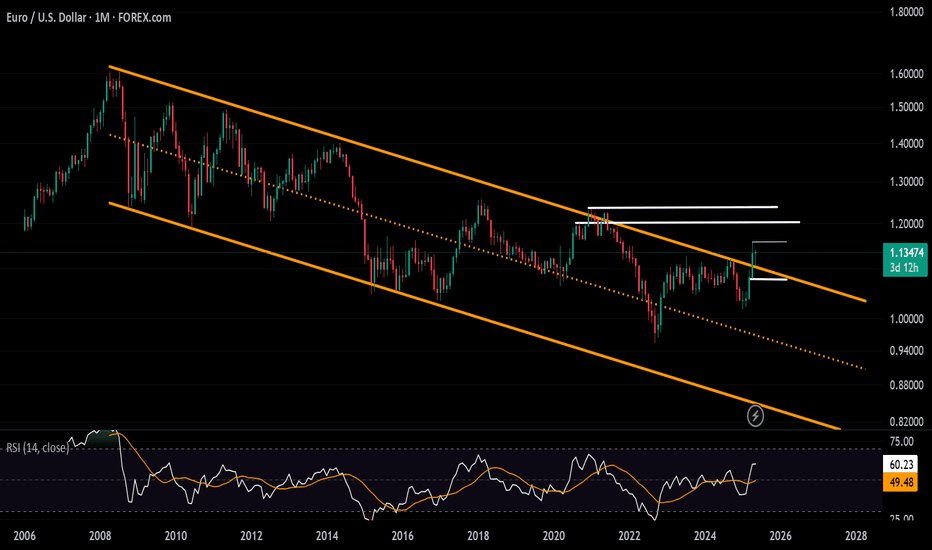
The U.S. dollar, pressured by debt concerns, has declined toward critical 2025 lows near the 98 level. Meanwhile, the euro has stabilized near 1.1380, now trading above the upper boundary of a 16-year descending channel originating from the 2008 peak and extending through 2024. This breakout positions EUR/USD for a potential long-term bullish move—provided the...
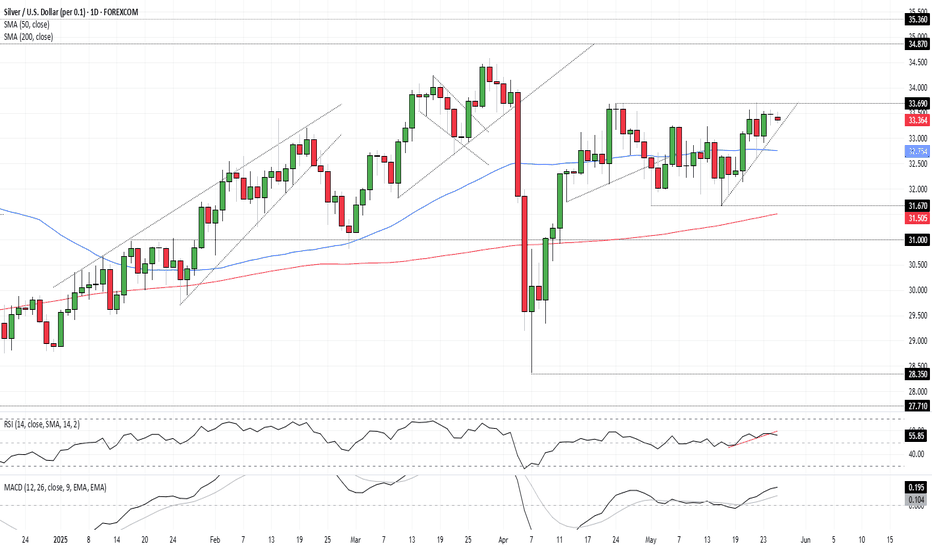
How many more failures above $33.50 will silver bulls need to see before they step aside and let the market correct? Nine times since mid-April we’ve seen the level breached, only for price to reverse lower—providing a decent short setup if and when the bulls give up. Positions could be established around the level with a stop above $33.69 for protection,...
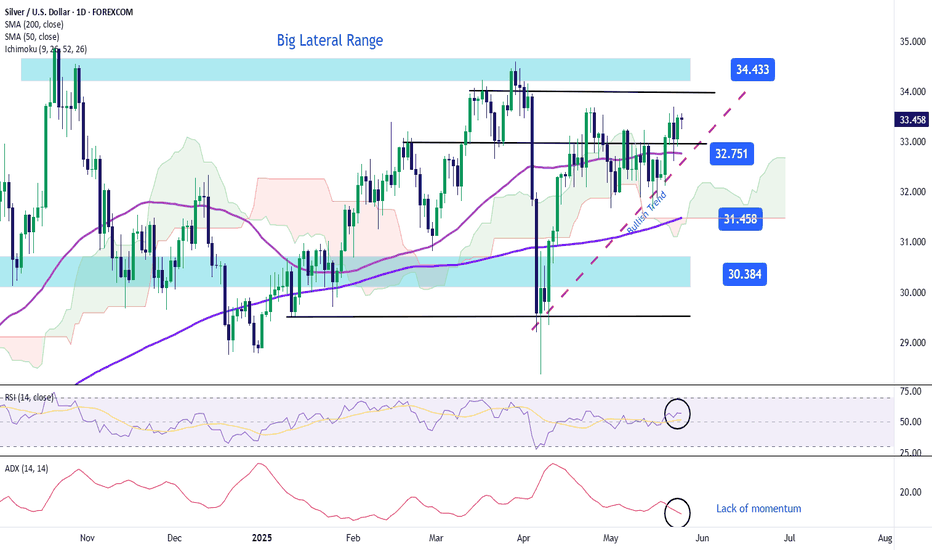
Over the past five trading sessions, silver has managed to sustain a significant short-term bullish move, posting a steady gain of just over 4%. The current bullish bias has remained relatively consistent, as global risk perception stays elevated, mainly due to the ongoing back-and-forth of the trade war. In his recent comments, President Trump announced that he...
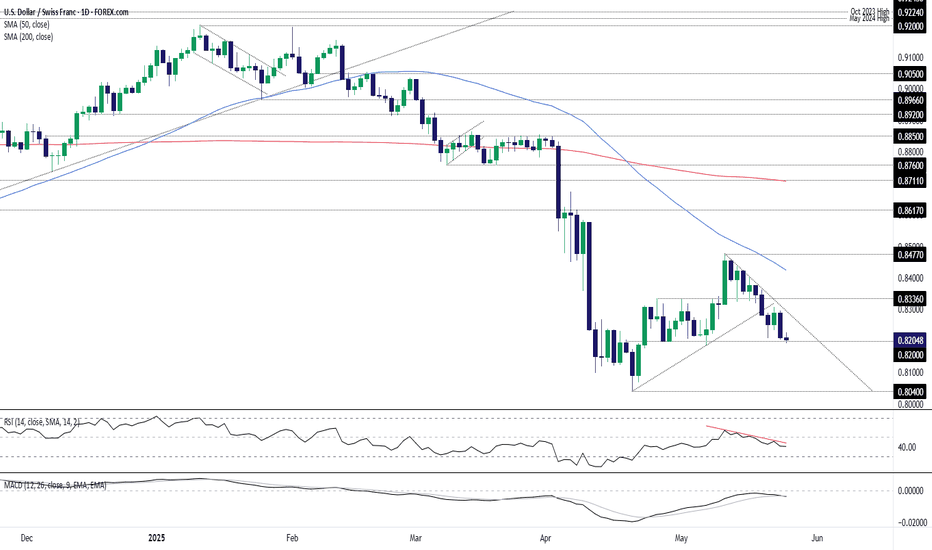
USD/CHF is teetering on .8200 horizontal support, with a break of the level opening the door for a move towards the April low at .8040. With price and momentum indicators both trending lower, and Friday’s bearish engulfing candle warning of further dollar weakness, the ducks appear to be lining up for downside near term. If the price breaks .8200 and holds...
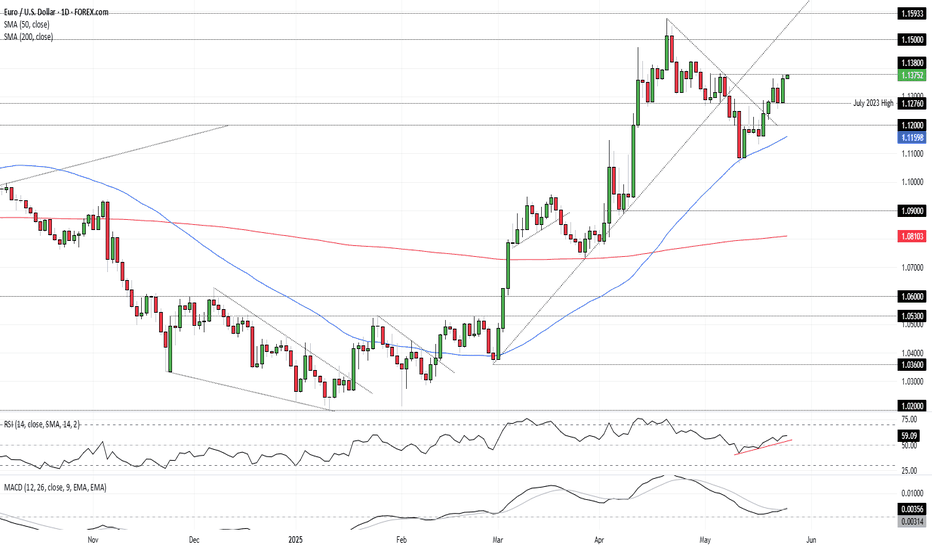
The case for EUR/USD upside was looking good even before Donald Trump’s latest tariff backflip on EU imports, with Friday’s engulfing candle joining momentum indicators like RSI (14) and MACD in generating bullish signals. With the price banging on the door of minor resistance at 1.1380, a bullish setup has been generated. If the price can clear 1.1380 and hold...
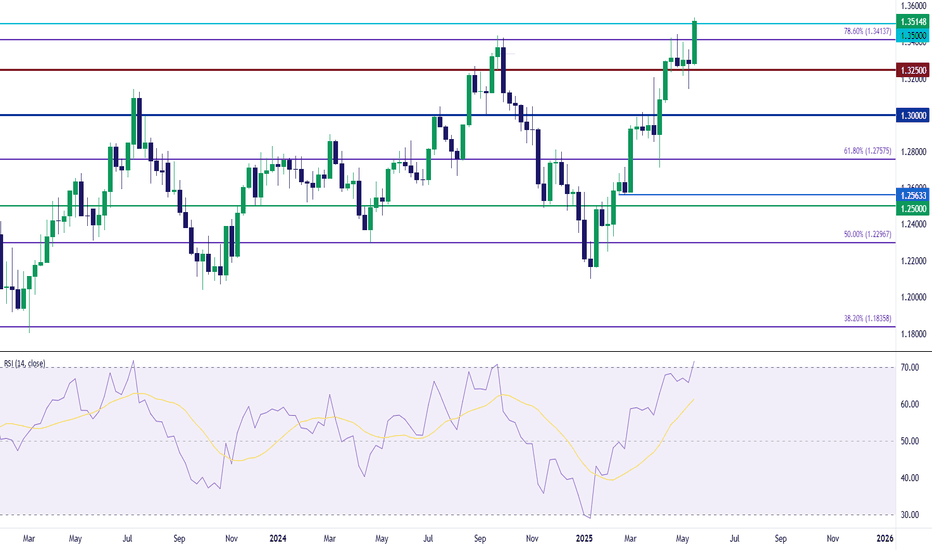
GBP/USD has just done something that hasn't happened in three years, trading above the 1.3500 level. The last time this happened in the pair was before the Federal Reserve began the rate hike campaign in 2022, and over the past four months its been a strong reversal of more than 1,400 pips as USD bears have taken back over. At this point weekly RSI is showing in...
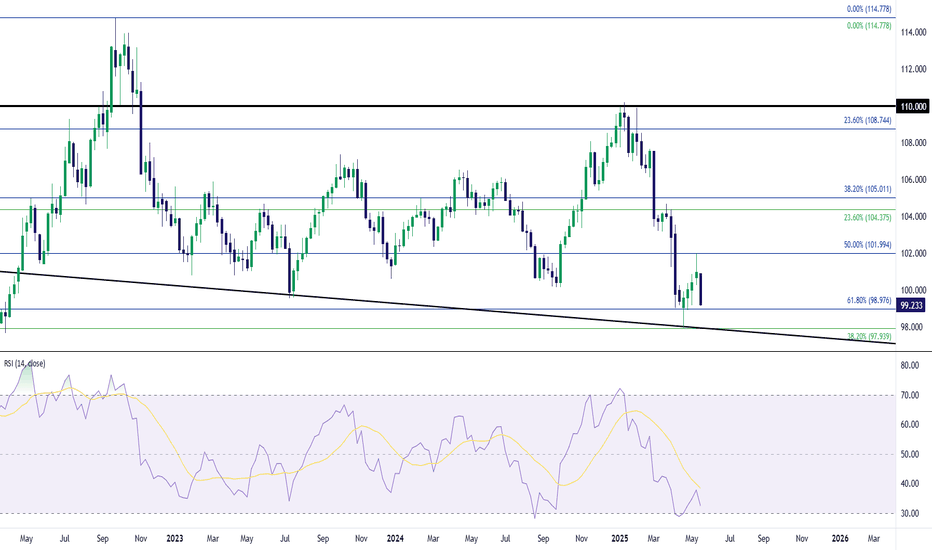
Timing moves can be difficult on both long and short-term basis. But when price goes oversold on the weekly chart, it can be really difficult to chase the move lower, such as we saw in DXY back in late-April. The currency hit a major spot of confluent support on Easter Monday and at that point RSI on the weekly was in oversold territory for only the second time...
It was a painful week for both USD and USD/JPY bulls as both markets retreated massively following four-week spurts of strength. In both, a Monday breakout in the prior week was soundly rebuffed, but it still seems as though USD/JPY is driving USD markets and the prospect of greater carry unwind can keep that as a force to be reckoned with. There could be...
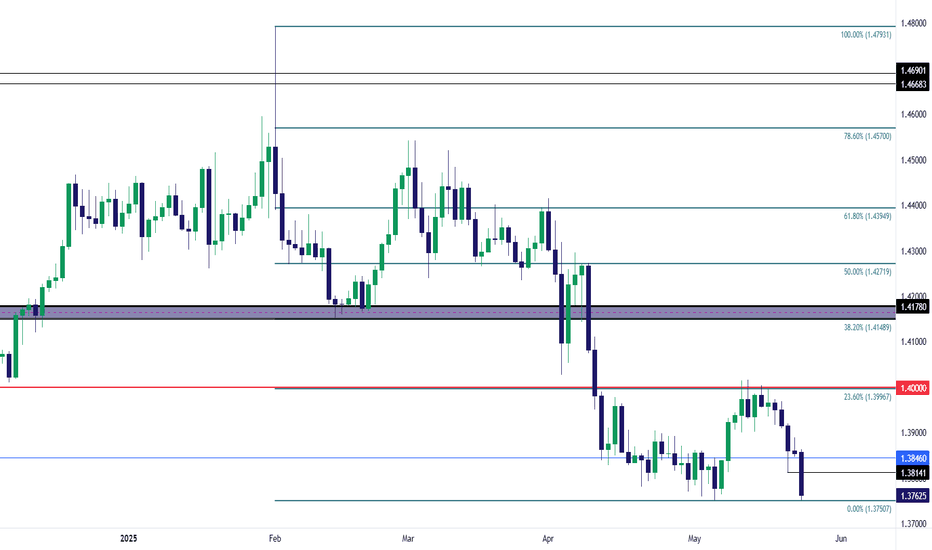
USD-weakness was back in a big way this week and even as other pairs had yielded to the USD-breakout into last Monday, with fresh lows in EUR/USD and fresh highs in USD/JPY - USD/CAD retained its bearish structure with a hold of resistance right at the 1.4000 level. Price is now 250ish pips lower as sellers have went back to work and there's potential for...
US index futures and Apple shares tumbled in premarket as Trump warned the company of 25% tariffs if manufacturing of iPhones is not moved to the United States. This is what Trump posted on social media: "I have long ago informed Tim Cook of Apple that I expect their iPhone’s that will be sold in the United States of America will be manufactured and built in...
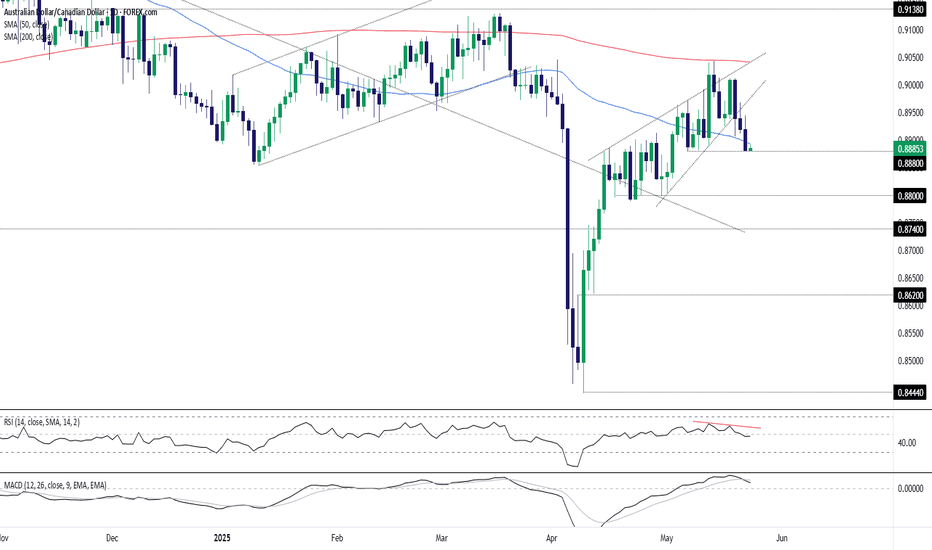
The ducks look to be lining up for AUD/CAD downside. It was comprehensively rejected at the 200DMA a fortnight ago, followed by wedge break on Tuesday before sliding below the 50DMA on Thursday. It now sits perched on .8880, a level it attracted buying from earlier this month. With RSI (14) sub-50 and MACD crossing over from above, momentum signals are shifting...
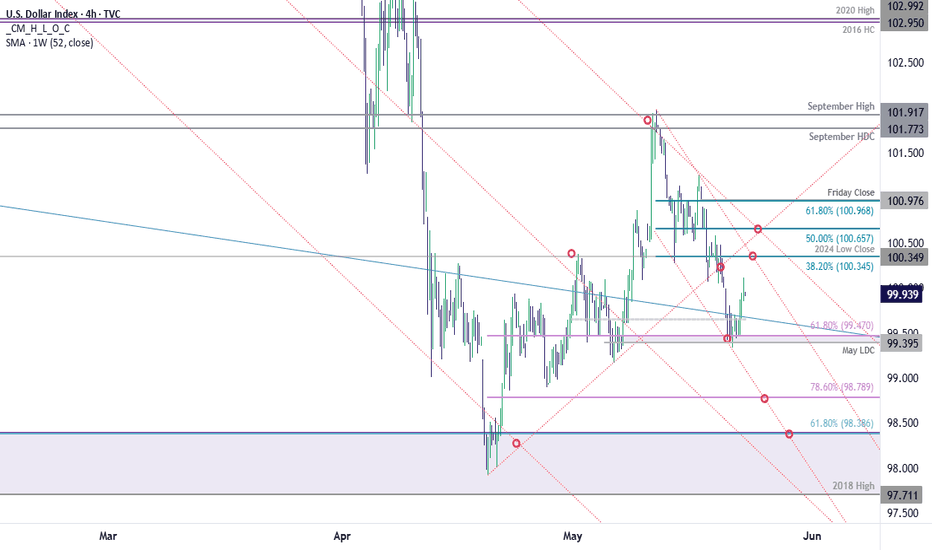
The US Dollar Index rallied more than 4% off confluent support with the recovery failing at the yearly downtrend this month. The decline is responding to initial support late in the week with the near-term recovery may be vulnerable as we head into the close of the month. A look at DXY price actions shows the index rebounding off support today at 99.40/47- a...
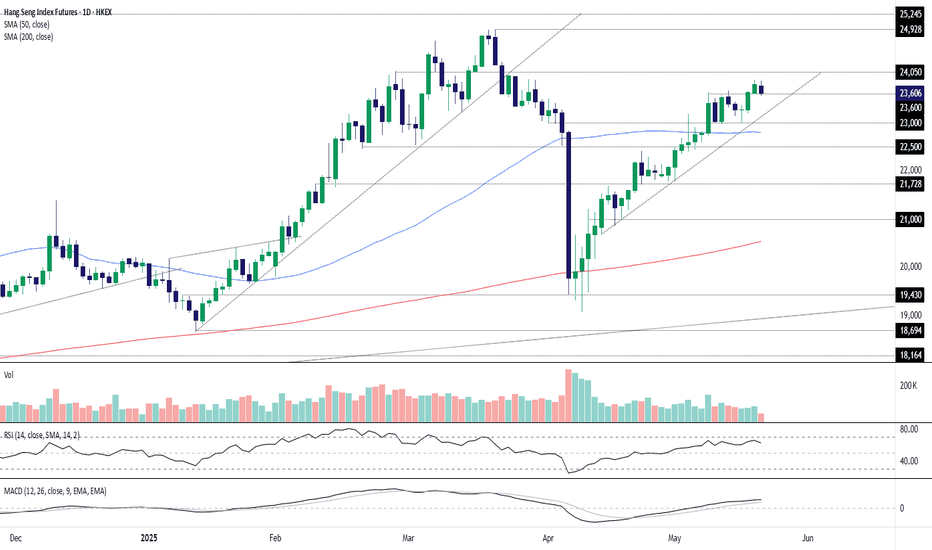
If Hang Seng futures continue to bounce from 23,600, it sets up a decent long opportunity with the price trending higher and momentum indicators and moving averages still favouring dip buying. The price is currently taking a peek beneath the level. If it can rebound—as seen earlier in the session—longs could be considered above 23,600 with a stop beneath the...
