Market analysis from FOREX.com
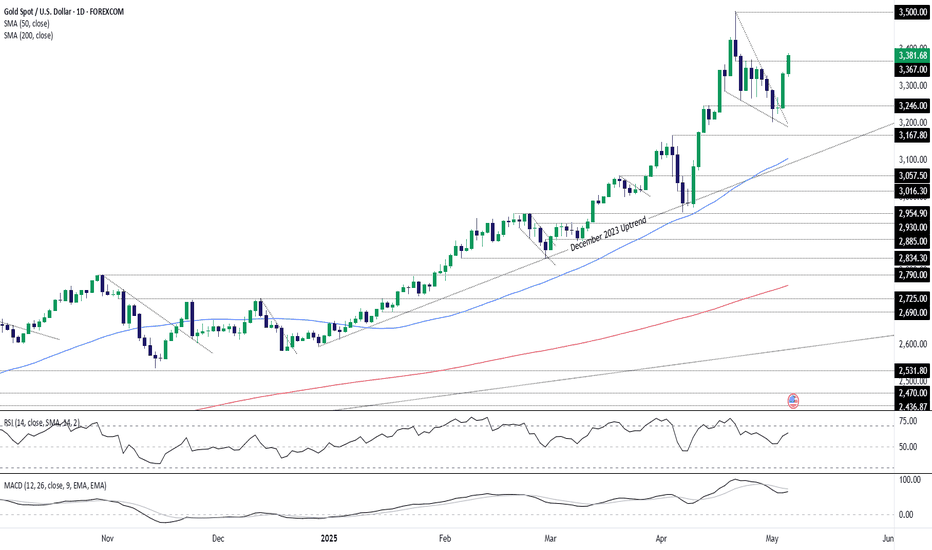
Gold delivered a powerful signal pointing to a resumption of the bullish trend, completing a morning star pattern that saw it break out of the falling wedge it had been trading over the past fortnight. It would have been nice to catch the initial move, but all is not lost after the price broke above $3367 on Tuesday. The price has run hard, so I’m reluctant to...
Euro is off more than 2% from the yearly high with EUR/USD carving the weekly opening-range just above multi-month uptrend support. From a trading standpoint, rallies would need to be limited to Friday’s high IF price is heading lower on this stretch with a break below the lower parallel exposing eh 2024 high at 1.1214 and 1.1160- both levels of interest for...
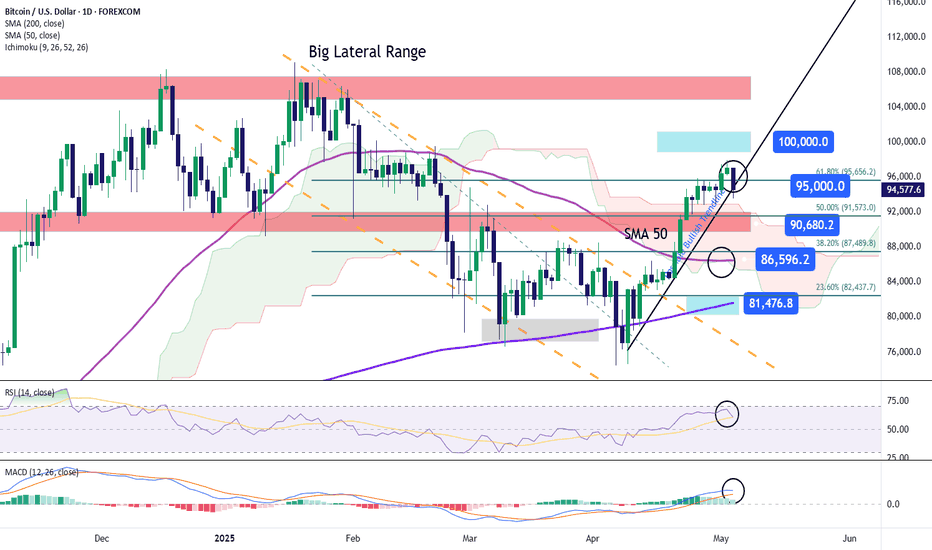
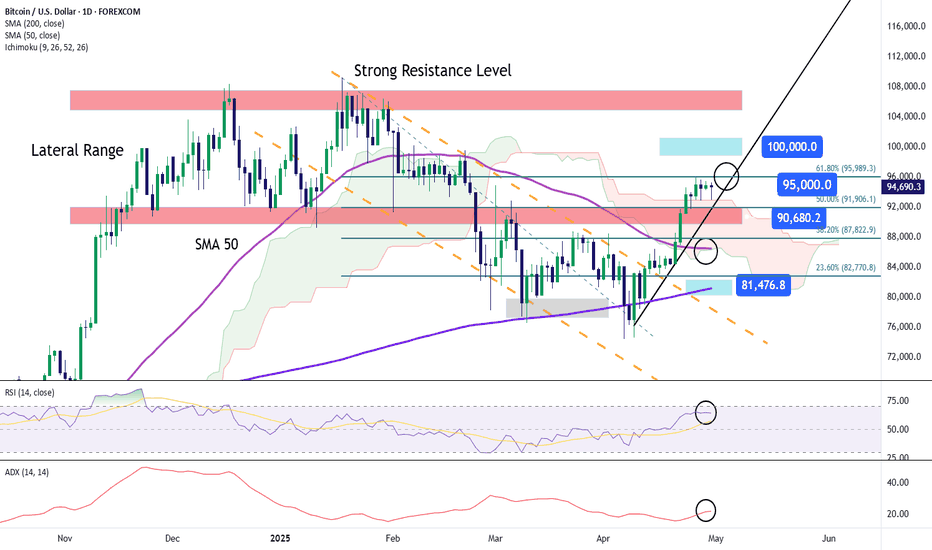
In today’s session, BTC has once again posted a decline of over 2%, as the previous bullish bias struggles to break through the $95,000 resistance level. The neutrality forming on the chart around this zone reflects the uncertainty in market sentiment, which is also evident in the Crypto Fear and Greed Index, currently oscillating in the neutral range at 45...
In contrast to EURUSD, the GBPUSD chart reflects a double top or flat rather than a head-and-shoulders pattern. However, unlike DXY and EURUSD, GBPUSD hasn’t broken below its neckline, maintaining a bullish bias as RSI continues to show positive momentum. • Upside Scenario : If the pair breaks above the 1.3345 high, the next targets are 1.3380, 1.3400, 1.3440,...
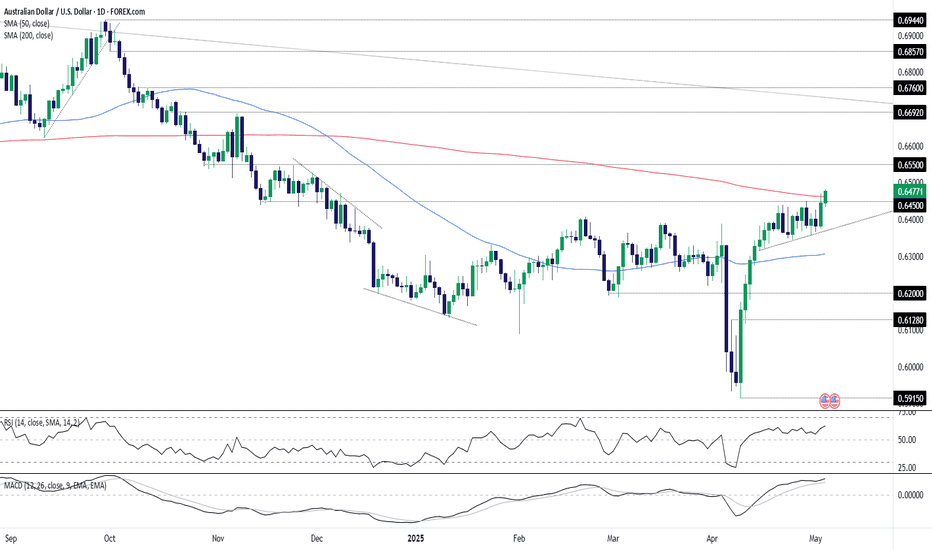
AUD/USD closed last week at the highest level of 2025 and has extended the move today, pushing above the key 200-day moving average. The rally coincides with further strength in the offshore-traded Chinese yuan, which also finished last week at 2025 highs against the U.S. dollar. While the price action is undeniably bullish—mirrored by strengthening momentum...
The net result of the Bank of Japan rate decision has been Yen-weakness, with USD/JPY initially showing an explosive move with a breakout beyond 145.00. That move couldn't hold, however, with an assist from the underside of a bullish trendline helping to cap the weekly highs, leading to a push back-below the 145.00 handle. For next week there's remaining bullish...
The FOMC rate decision next week will likely have some pull on the matter but for now, the US Dollar is working on its second consecutive green week for the first time since the high in January. Resistance has so far held at last year's swing low of 100.22 but bulls put in some push over the past week and it seems unlikely that the Fed will suddenly go dovish...
Gold is working on its second consecutive red week which would be the first such occurrence in 2025. Interestingly, gold had only posted two red weeks in the prior 16, until the $3500 level came into play. That high in gold syncs with a long-term spot of support in the US Dollar, and going into next week's FOMC meeting the two scenarios appear linked as a dovish...
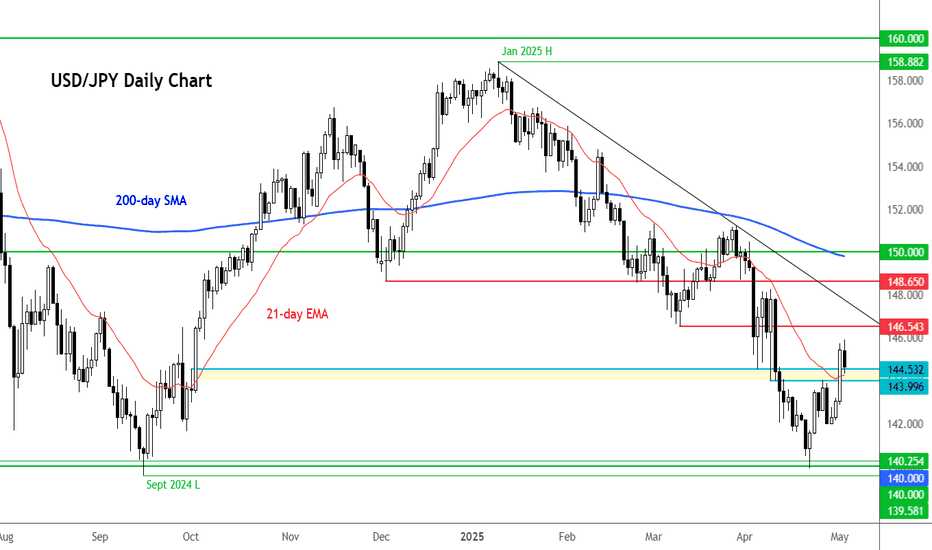
The US dollar traded mixed shortly after the NFP was released, as risk-on sentiment remained the prevailing trend. As index futures rose further, commodity dollars extended their gains against the greenback, while the USD/JPY attempted to find support around the key 144.00 - 144.50 area. This zone was resistance in the past so let's see if the UJ will be able to...
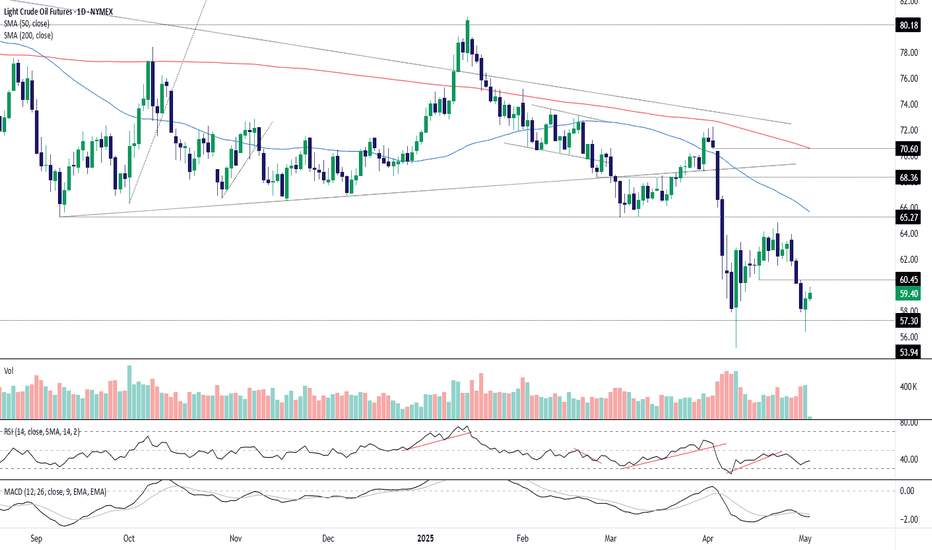
If other cyclical asset classes are rallying like a global recession can be avoided, then why shouldn’t crude oil? Yes, there are reports OPEC+ may increase output again, and we know Donald Trump wants lower prices, but those factors should already be priced in. The true swing factor is demand—and if it’s not about to fall in a heap, why should crude? We’ve now...
Gold has broken key short-term support between 3260-3284 (shaded in grey on the chart). This is a bearish development in the short term outlook from a technical point of view. But with the long-term trend being bullish, traders should take this with a pinch of salt. Key support levels are now approaching. $3200 is an obvious level to keep an eye on. Below that old...
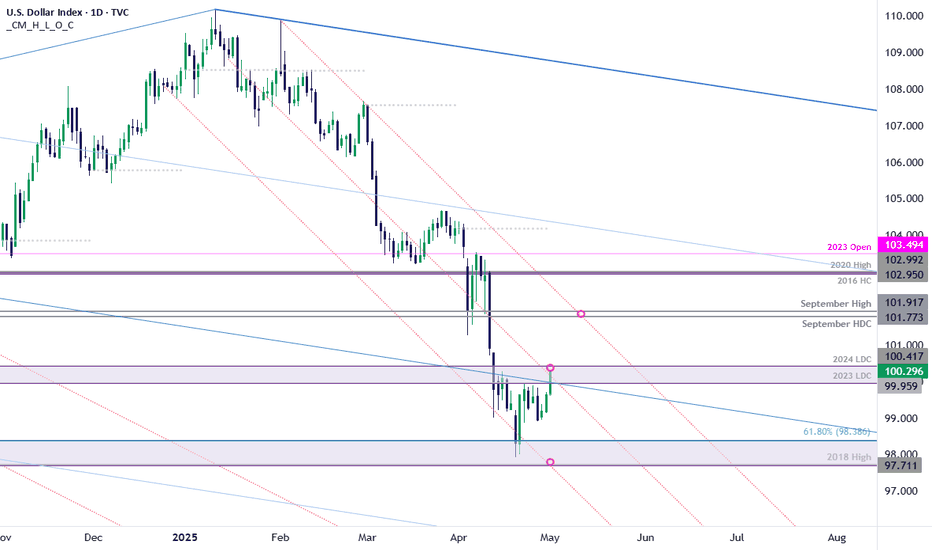
The US Dollar is testing resistance today at the 2023 / 2024 low day closes (LDC) at 99.95-100.42- looking for possible infection off this mark in the days ahead. A closer look at USD price action shows the index trading into the resistance at the median-line in early U.S. trade. A topside breach above this threshold is needed to validate a breakout of the weekly...
The U.S. Dollar plunged more nearly 12% off the yearly high against the Japanese Yen with USD/JPY rebounding off support at last week near the 2024 low. Initial resistance now in view at the 100% extension of the recent advance at 146.11 and is backed by the 38.2% retracement at 147.14- both levels of interest for possible topside exhaustion / price inflection IF...
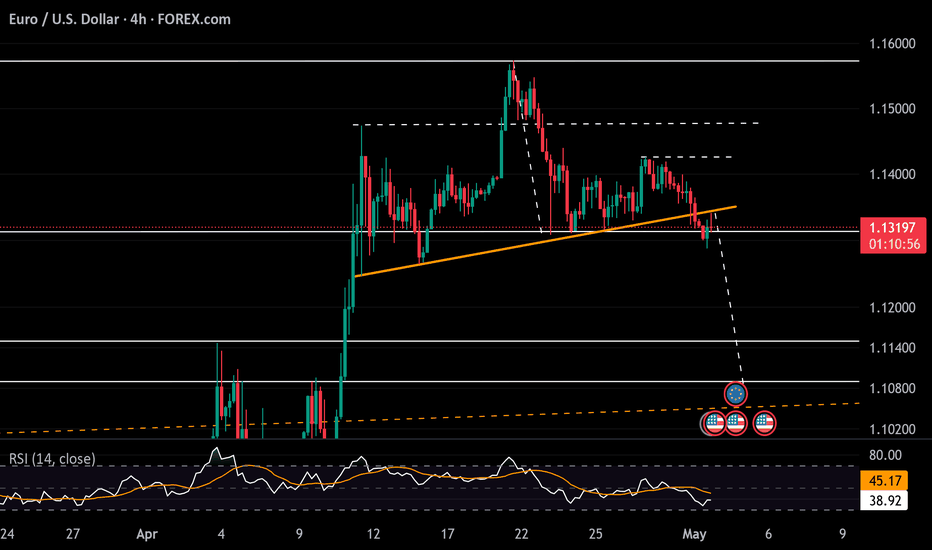
Mirroring the DXY, the EURUSD appears to be holding below the neckline of a head and shoulders pattern formed from the 1.1570 highs. However, it still requires confirmation with a sustained move below 1.1270 to extend the forecast toward 1.1140 and 1.1040. On the upside, if the 1.1270 support holds, EURUSD may reverse course, confirming a failed pattern and...
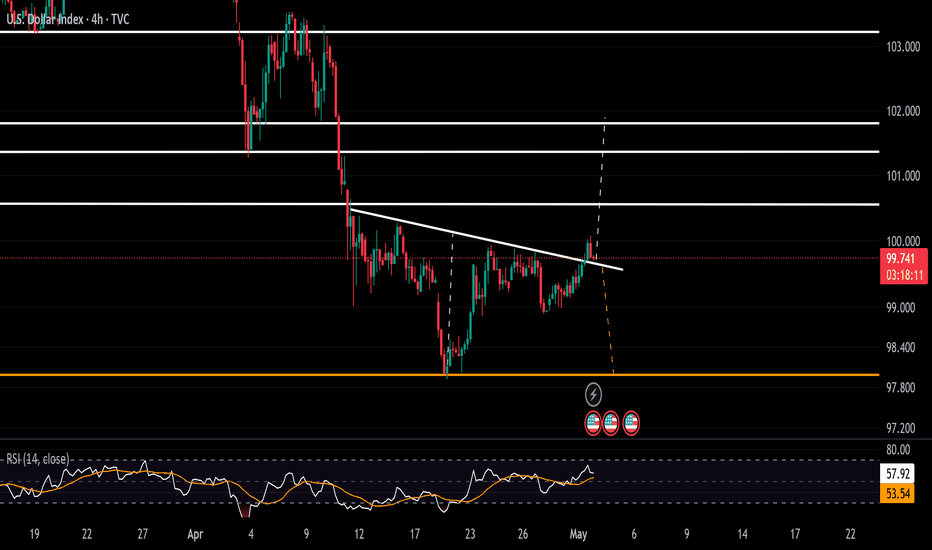
Despite a notable contraction in U.S. GDP and a sharp drop in Core PCE — both pointing to increasing recession risk — the U.S. Dollar Index (DXY) managed to sustain its rebound. On the 4-hour chart, DXY is pushing above the neckline of an inverted head-and-shoulders formation. However, confirmation is still needed — a clean hold above 100.30 is essential to avoid...
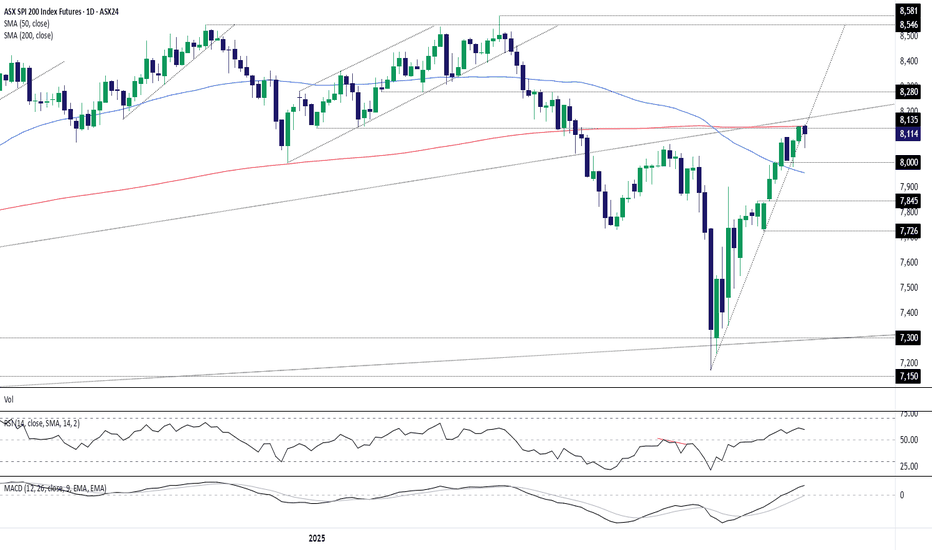
Thursday looms as an important session for Australian ASX 200 SPI futures, with the price approaching a tough layer of technical resistance overhead. Horizontal resistance at 8135, the 200-day moving average at 8142, and the October 2023 uptrend around 8180 all stand between a potential run back towards the record highs set earlier this year or a possible...
At the moment, a strong neutral sentiment has taken hold in Bitcoin’s price action, with an average fluctuation of just over 1% in the last four trading sessions. Indecision persists as BTC struggles to break through the $95,000 barrier, especially as the U.S. dollar has begun to regain strength—limiting the continuation of steady bullish momentum. Additionally,...
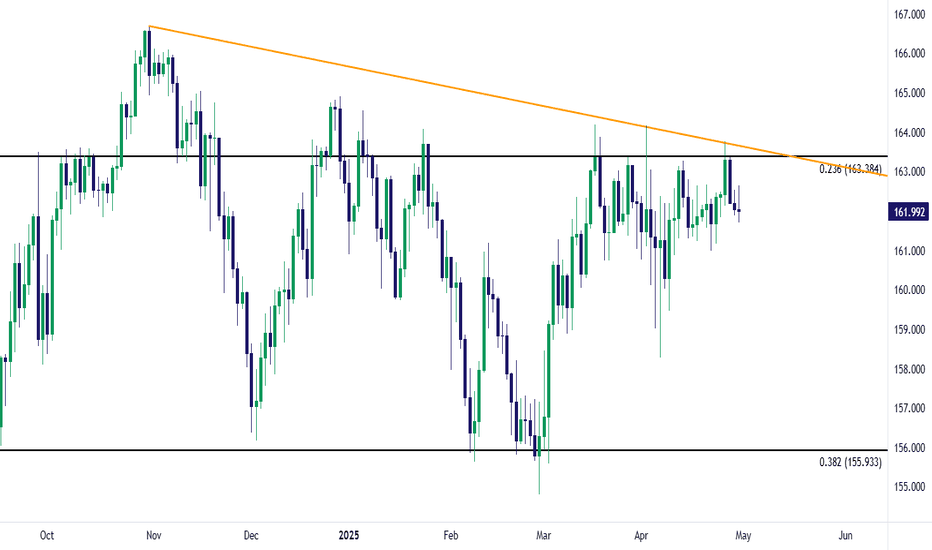
EUR/JPY has held resistance at a familiar spot on the chart, from the 163.00 level up to 163.38. This has been the same resistance that's held in the pair for the past seven weeks and for those looking for JPY-strength around tonight's BoJ rate decision, this can be an attractive venue. USD/JPY would have the complication of the 140.00 level which has been major...
