Market analysis from FOREX.com
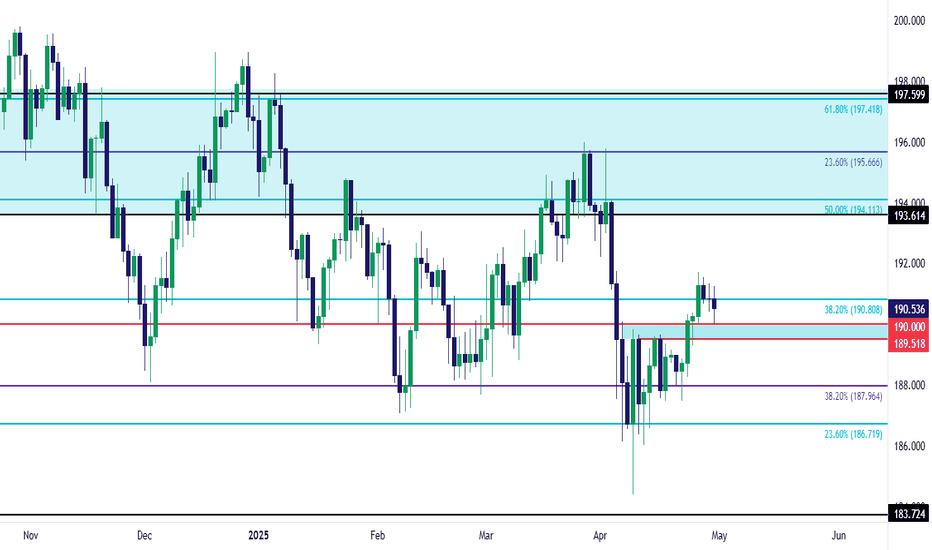
Into tonight's BoJ meeting, GBP/JPY remains of interest for JPY-weakness scenarios. This contrasts with EUR/JPY which retains interest for JPY-strength setups but in GBP/JPY, it's the 190.00 level that's already come into play to help set the day's lows. That price can be spanned down to the prior swing high at 189.52 to create a support zone for bullish...
The 140.00 level in USD/JPY has so far held the lows in 2025 after that price did the same in 2024. There was just one day of testing below that price last year and it was around the weekly open of the first FOMC rate cut for the last cycle. Sellers couldn't find much momentum below and a couple days later, when the Fed did actually cut, price put in a higher-low...
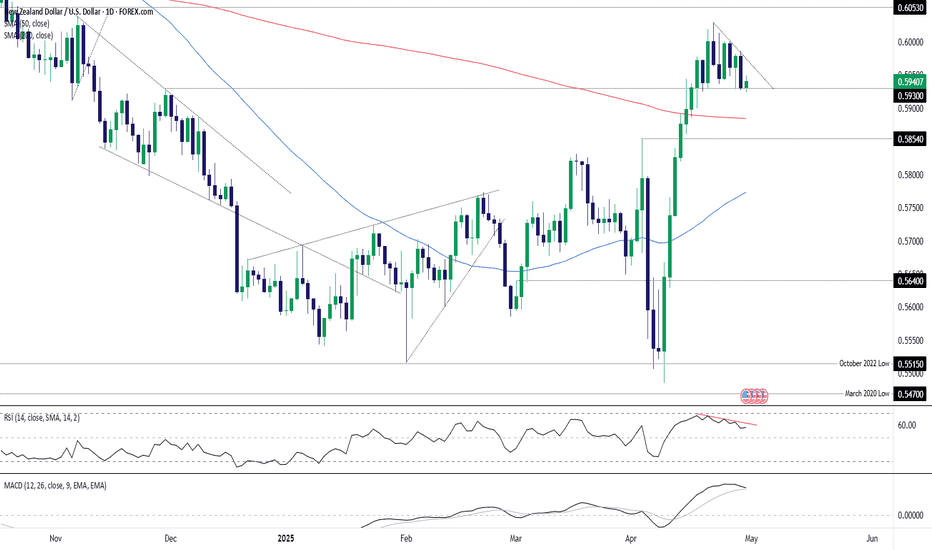
Traders should be alert to a potential downside break in NZD/USD. Sitting in a descending triangle and having printed a bearish engulfing candle on Tuesday, a clean break below .5930 would generate a setup where shorts could be established with a stop above the level for protection. The 200-day moving average screens as an initial target, with .5854 another...
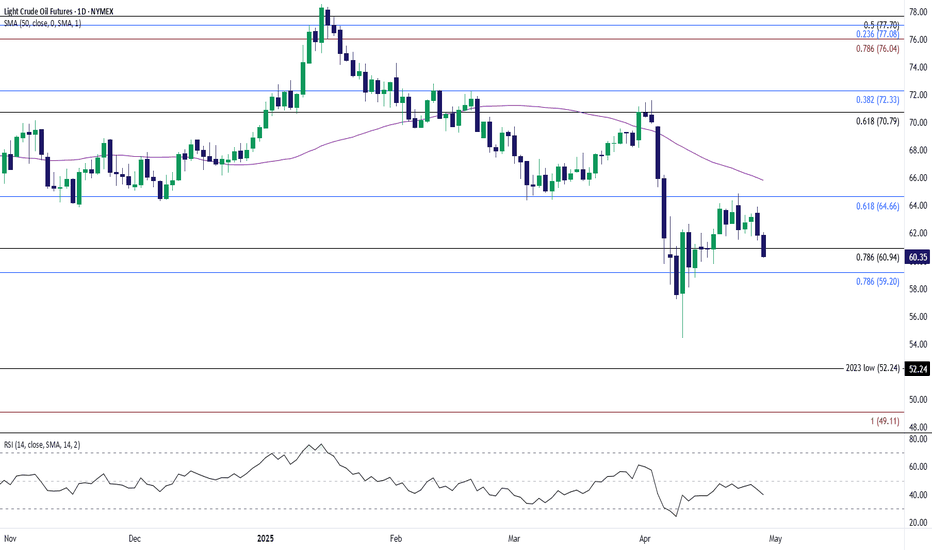
The price of oil may continue to give back the rebound from the monthly low ($54.46) as it extends the decline from the start of the week. The price of oil starts to carve a series of lower highs and lows as it snaps the range bound price action from last week, with a move/close below the $59.20 (78.6% Fibonacci retracement) to $60.90 (78.6% Fibonacci...
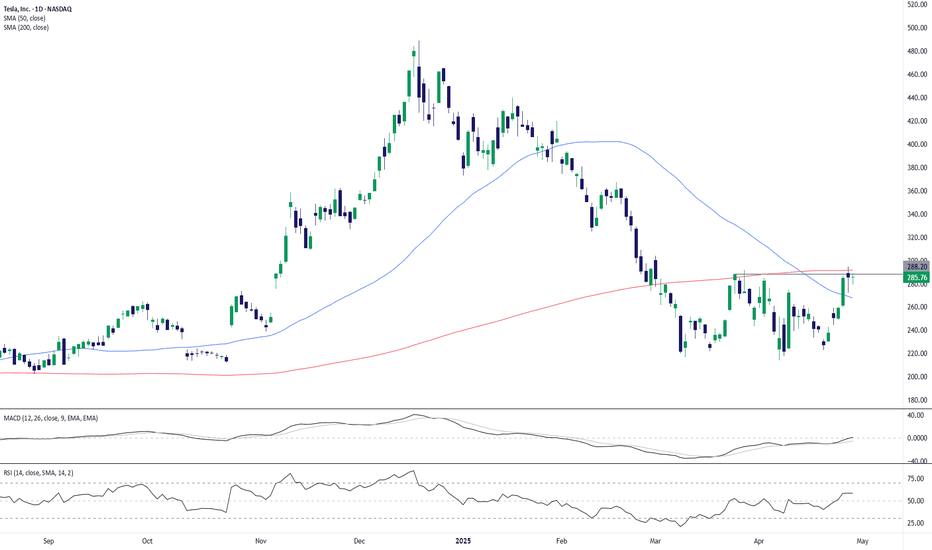
Tesla shares have rebounded sharply from April’s low, but the rally is now stalling near a confluence of resistance: 🔴 $288.20 = February swing high 🔵 Price testing the 200-day SMA (~$291) from below 📈 MACD remains positive but momentum is flattening 📊 RSI at 58 – bullish but not yet overbought A clean breakout above $288–291 would likely confirm a medium-term...
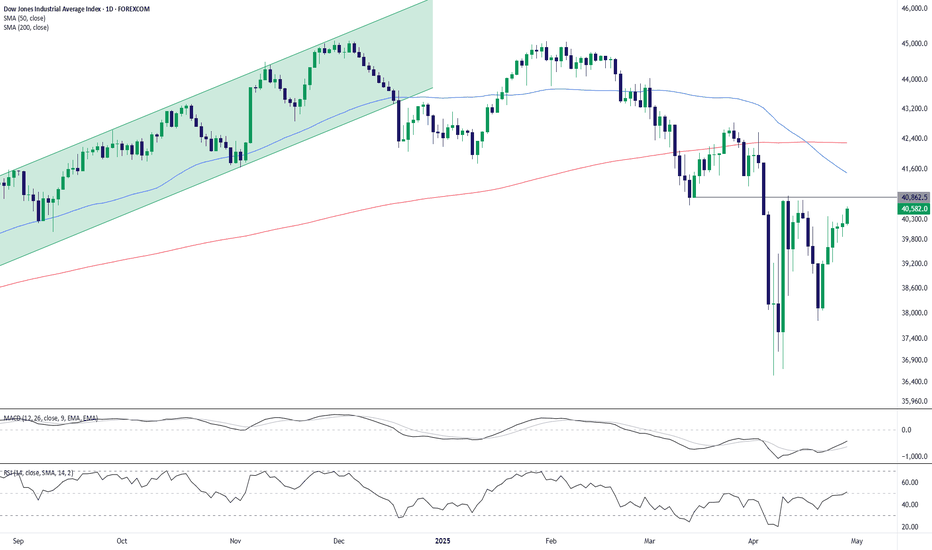
The Dow Jones Industrial Average is pressing against a key resistance zone near 40,860, the neckline of a double-bottom pattern after rebounding sharply from its mid-April low: 📈 Strong 2-week rally from sub-37K lows 🔵 Price attempting to break the neckline after reclaiming the 50-day SMA 📊 RSI near neutral at 51 – plenty of room to run 📉 MACD accelerating...
Gold remains in a tight consolidation on the 4-hour chart after its historic run to $3,431. Price is trapped in a clear rectangle between ~$3,280 and ~$3,360: 📦 Sideways range suggests indecision after the massive bull run 🔵 50 SMA holding as dynamic support 📉 MACD is flat but trying to cross higher 📊 RSI hovering near neutral at 50 – neither overbought nor...
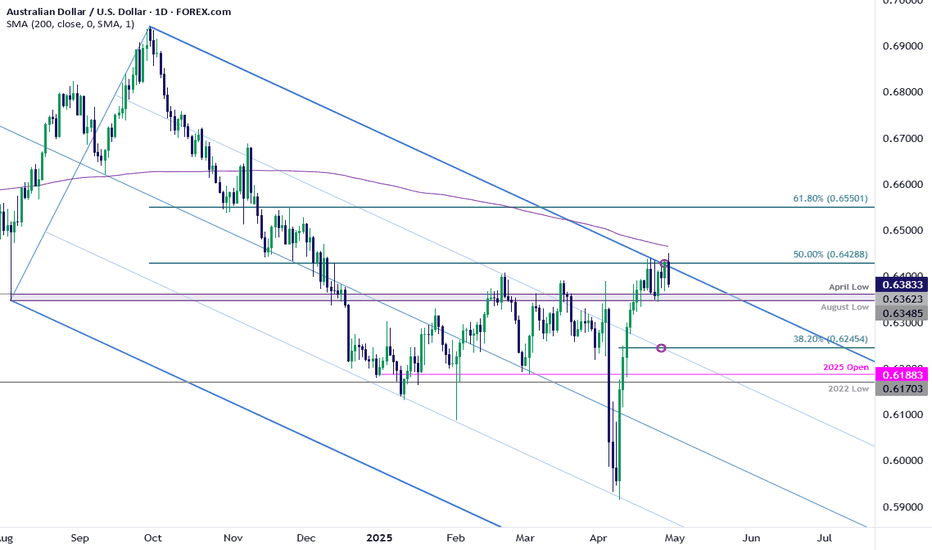
The Australian Dollar staged an impressive V-shaped recovery month with AUD/USD surging more than 9% off multi-year lows. The advance has now extended into confluent resistance at 6408/29- a region defined by the 50% retracement of the 2024 decline and the February swing high. Note that the upper parallel of the descending pitchfork converges on this threshold...
The British Pound has rallied more than 11.1% off the yearly low with GBP/USD trading into uptrend resistance at fresh yearly highs. Building momentum divergence highlights the risk for exhaustion here and while the broader outlook remains constructive, the immediate advance may be vulnerable near-term while below this slope. Initial support rests with the...
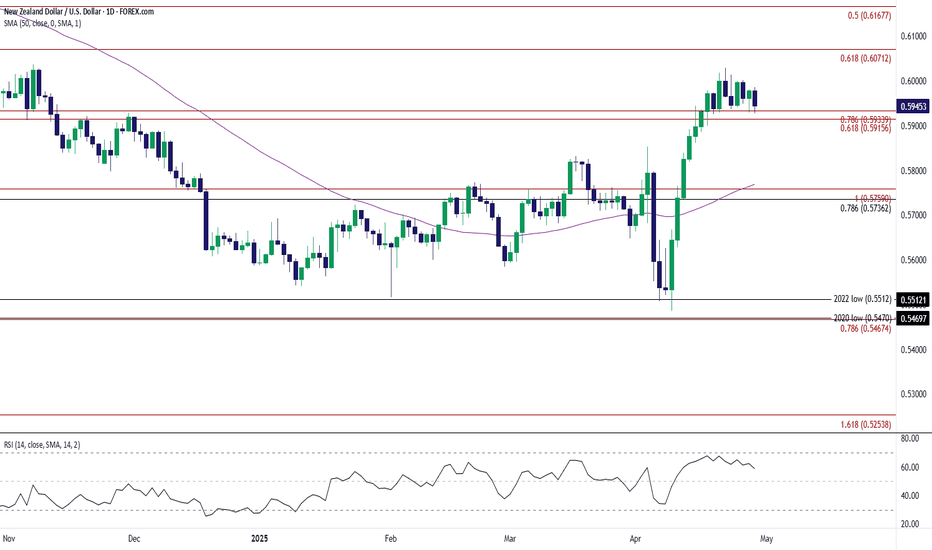
The recovery in NZD/USD seems to have stalled ahead of the November high (0.6038) as it gives back the advance from the start of the week. In turn, a move/close below the 0.5920 (61.8% Fibonacci extension) to 0.5930 (78.6% Fibonacci extension) region may push NZD/USD towards the 0.5740 (78.6% Fibonacci retracement) to 0.5760 (100% Fibonacci extension) zone, with...
AUD/JPY appears to be pulling back ahead of the 50-Day SMA (92.76) as it extends the decline from the start of the week. In turn, AUD/JPY may track the negative slope in the moving average as it struggles to hold above the 91.50 (61.8% Fibonacci retracement) to 91.70 (38.2% Fibonacci extension) region, with a break/close below 90.50 (61.8% Fibonacci extension)...
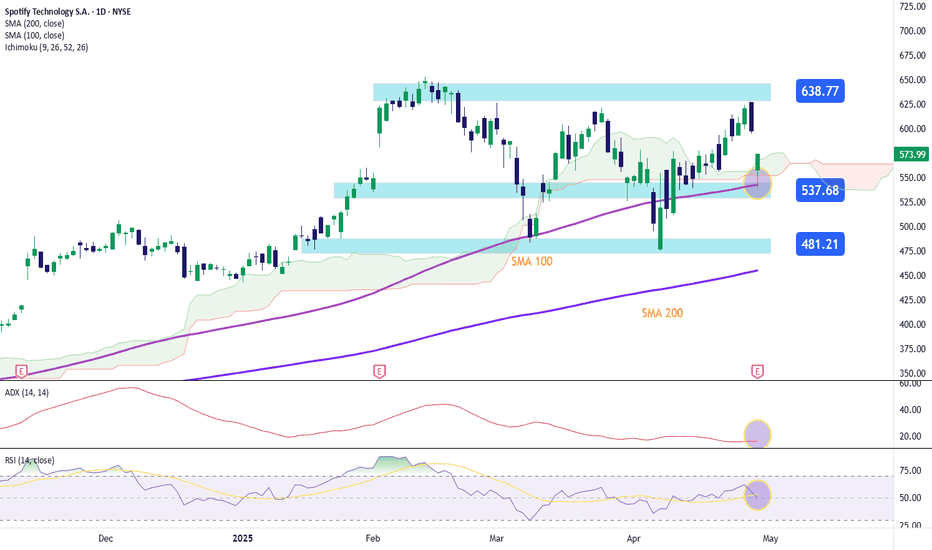
Spotify's stock has shown significant price weakness and is now trading below $600 per share, shortly after a large bearish gap formed following the release of its quarterly results. The company reported earnings per share of €1.07, below expectations of €2.13 per share. Additionally, Spotify projected operating profit for Q2 at €539 million, under the market...
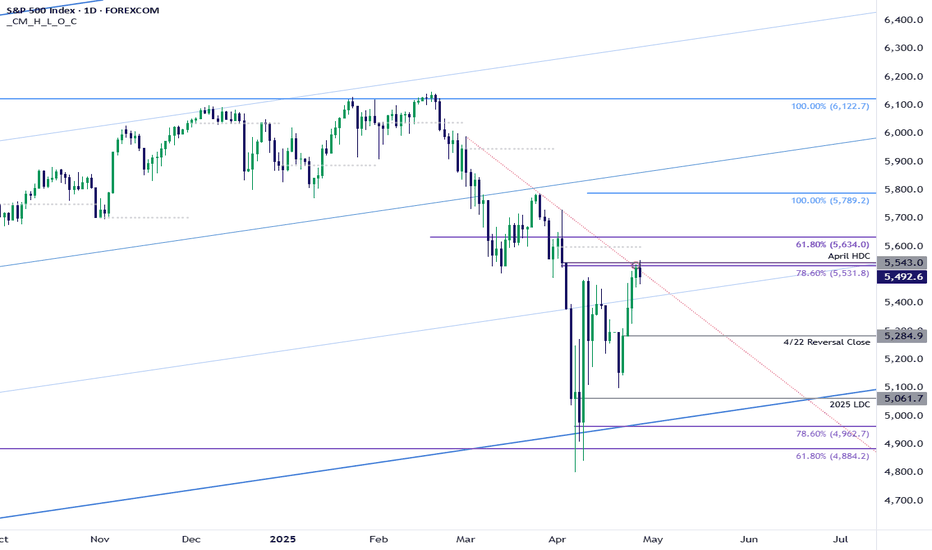
The S&P 500 has rallied more than 15.6% off the lows with the bull now testing confluent resistance at 5531/43 - a region defined by the 78.6% retracement of the monthly range and the April high-day close. Note that a three-point resistance slope converges on this threshold and the immediate advance may be vulnerable while below. Initial support rests with the...
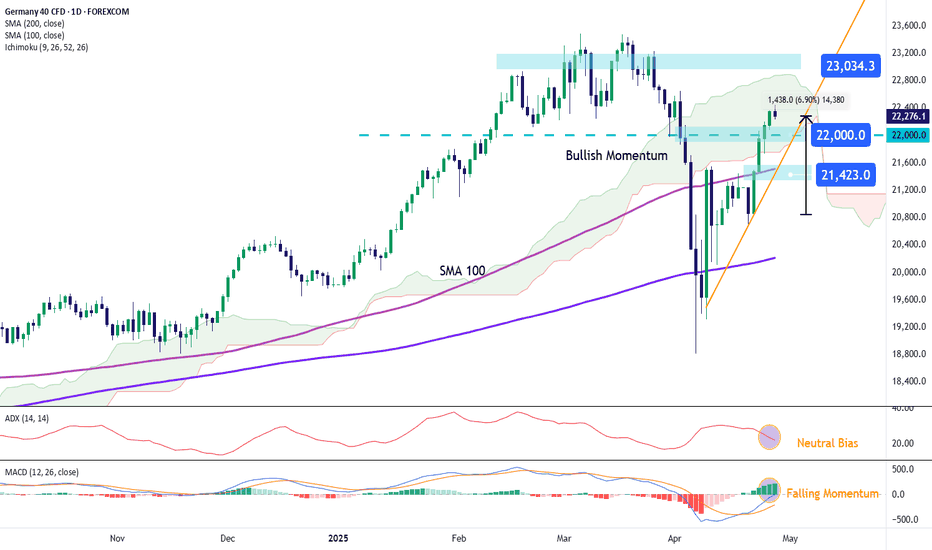
The German index has posted steady gains, rising nearly 7% over the last four trading sessions, mainly driven by the low interest rates maintained by the ECB at 2.25%, as well as the easing of potential trade war tensions, which has allowed the index’s bullish bias to remain strong in recent weeks. However, buying candles have been gradually diminishing over the...
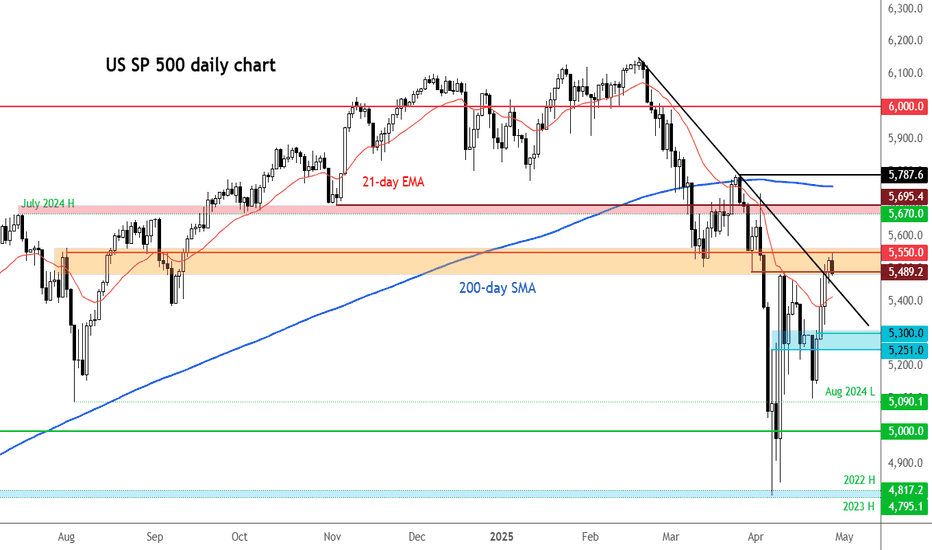
Ahead of a busy week, the S&P 500 has found resistance at a key area of resistance near 5550. The Index had rallied in the previous three sessions, but with trade and economic uncertainty still at the forefront, investors are not rushing to chase this rally - and rightly so. May be they will still buy the dip as we head deeper into the week, though, given Trump's...
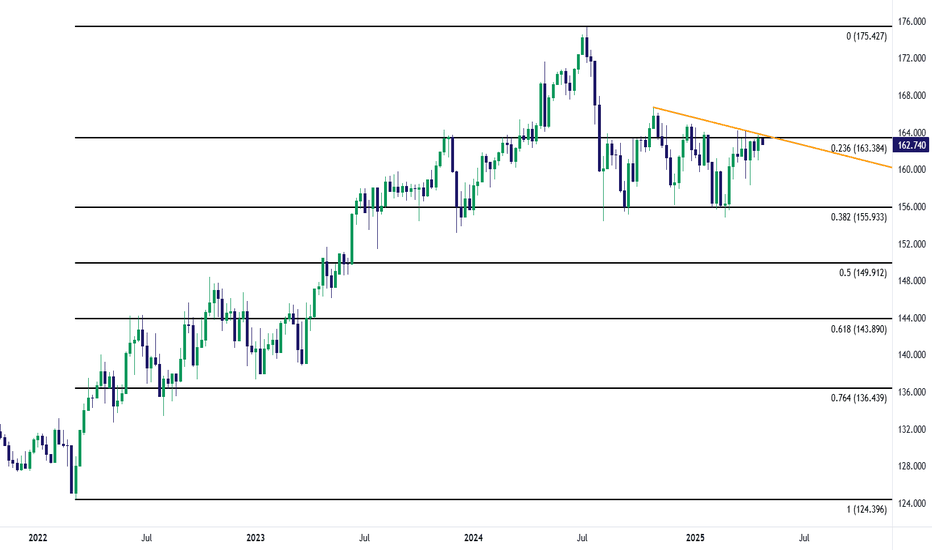
EUR/JPY has been digesting for the better part of the past nine months. While both Euro and USD strength have been on full display in varying ways over that period of time, each currency has been a bit more balanced against the Japanese Yen. The range has been wide at more than 800 pips but there's also a descending triangle that's set up along the way, with...
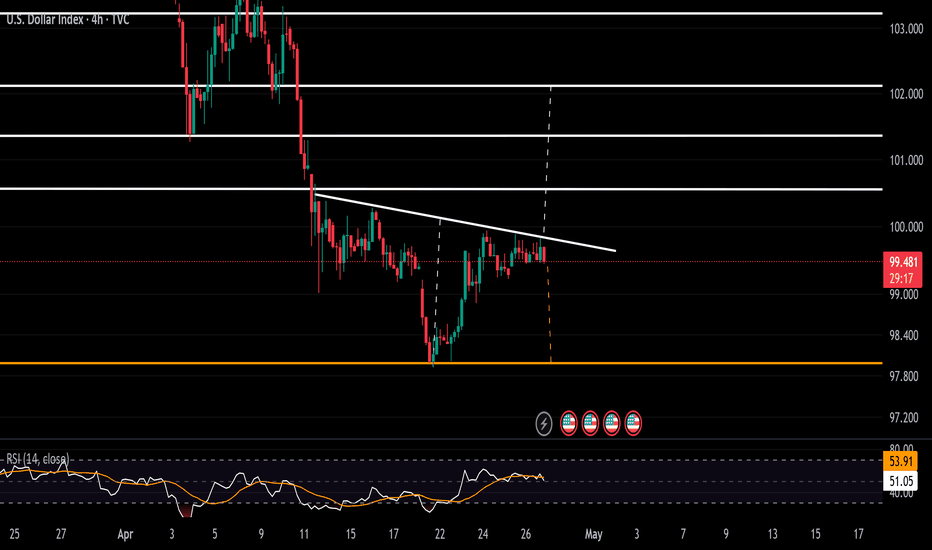
The DXY is currently maintaining a bullish setup amid trade negotiations, election developments, and anticipation of key leading U.S. economic indicators this week. An inverted head-and-shoulders formation is visible on the 4-hour time frame. A decisive catalyst and a breakout above the 100.00 and 100.30 levels are needed to confirm a more sustained bullish...
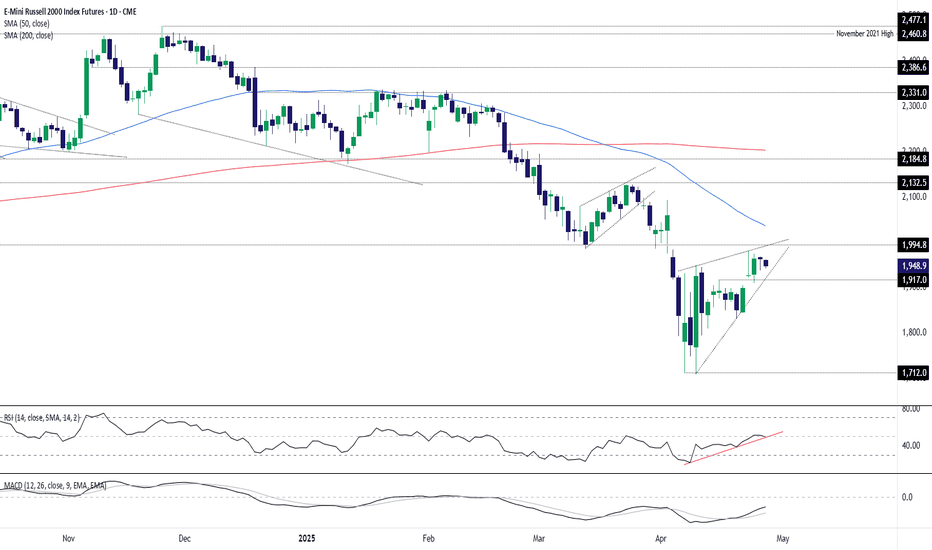
Russell 2000 futures look sluggish heading into a week laden with macro risk events. Given the cyclical characteristics of the underlying index, any hint of weakness may amplify U.S. recession fears, increasing the risk of renewed downside for stocks. Sitting within what resembles a rising wedge and with a possible evening star pattern forming, the risk of a...
