Market analysis from FOREX.com
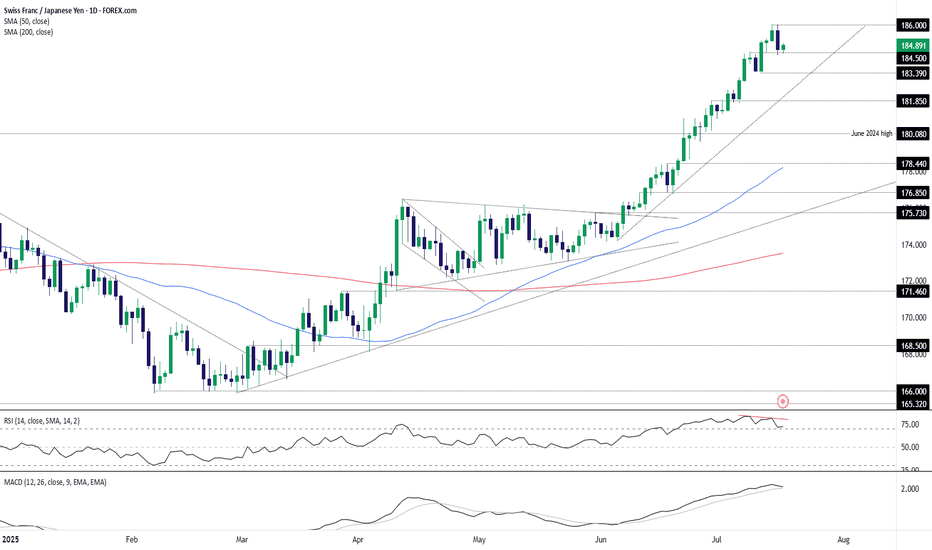
Is the high-flying CHF/JPY cross about to hit an air pocket? Having printed a bearish engulfing candle on Wednesday, and with bearish divergence between RSI (14) and price while still in overbought territory, the risk of a pullback appears to be growing. MACD is also curling over towards the signal line, hinting that bullish momentum is waning. Should the price...
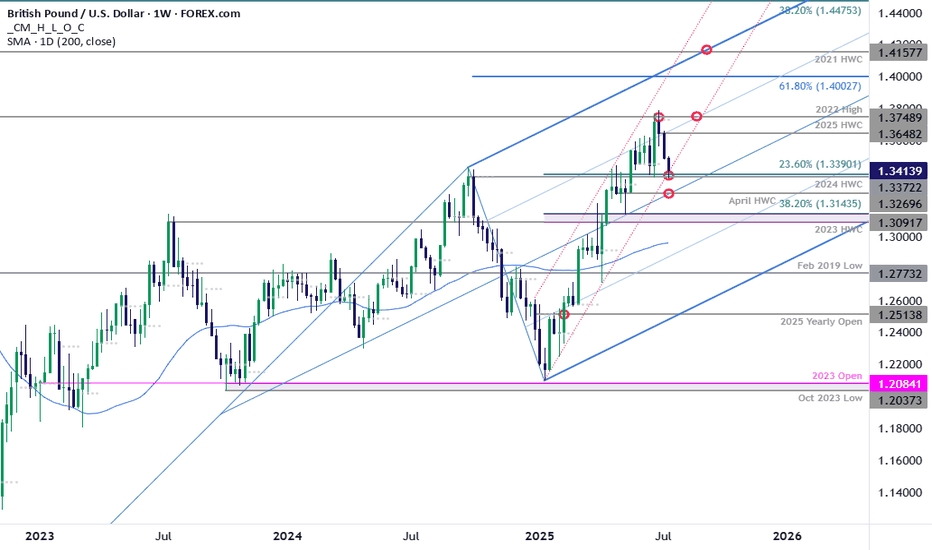
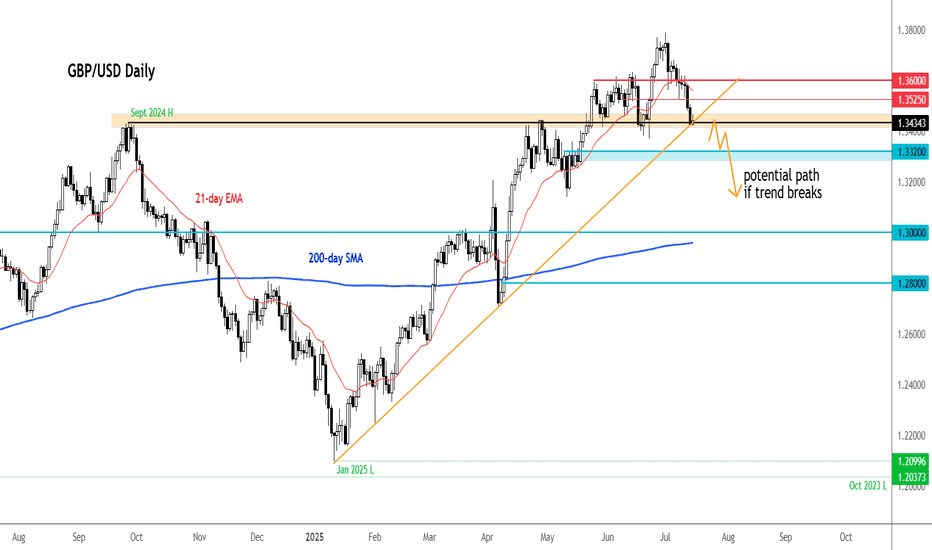
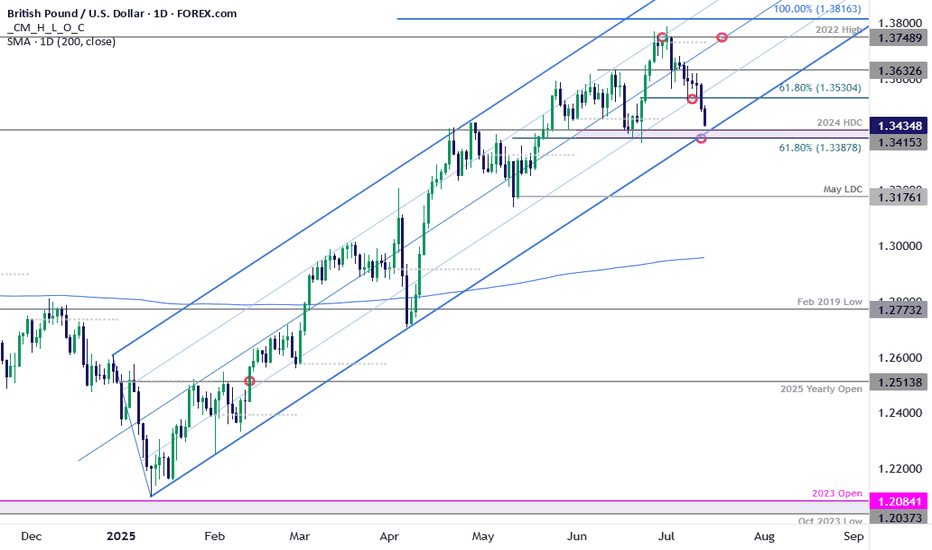
Sterling is poised to mark a third consecutive weekly decline after turning from resistance at multi-year highs. The decline takes price into critical support at the yearly trendline- this is a make-or-break level for the bulls. GBP/USD is testing confluent support today at 1.3372/90- a region defined by the 2024 high-week close (HWC) and the 23.6% retracement of...
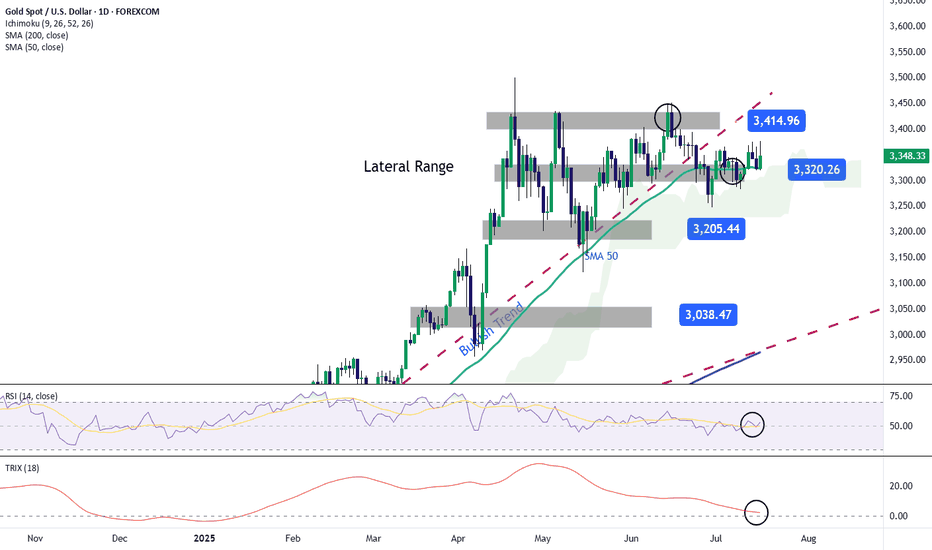
Today's session marked a new upward move for gold, with gains of more than 1%, pushing prices above the key $3,300 per ounce level. For now, the bullish bias has remained firm shortly after reports suggested that the U.S. government may be preparing to move away from the current Federal Reserve Chair, Jerome Powell, mainly due to the Fed’s failure to deliver on...
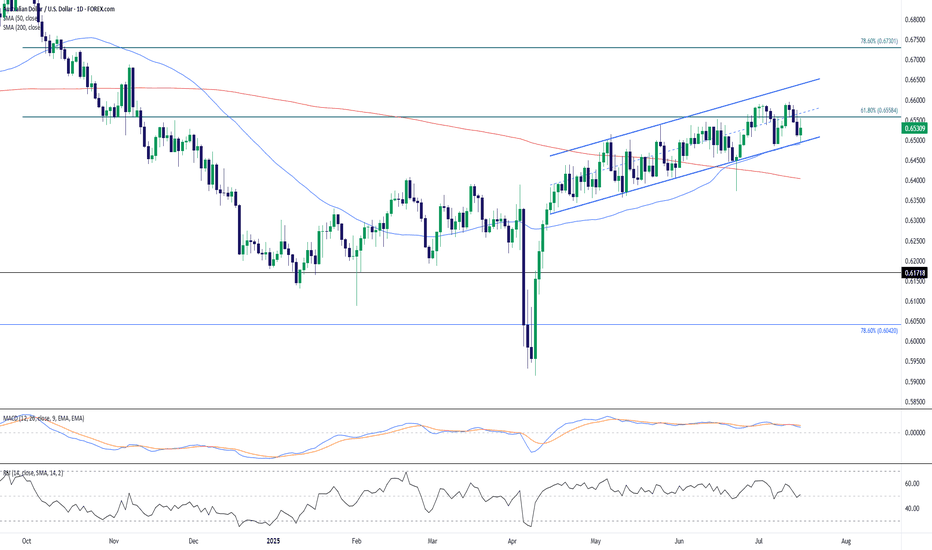
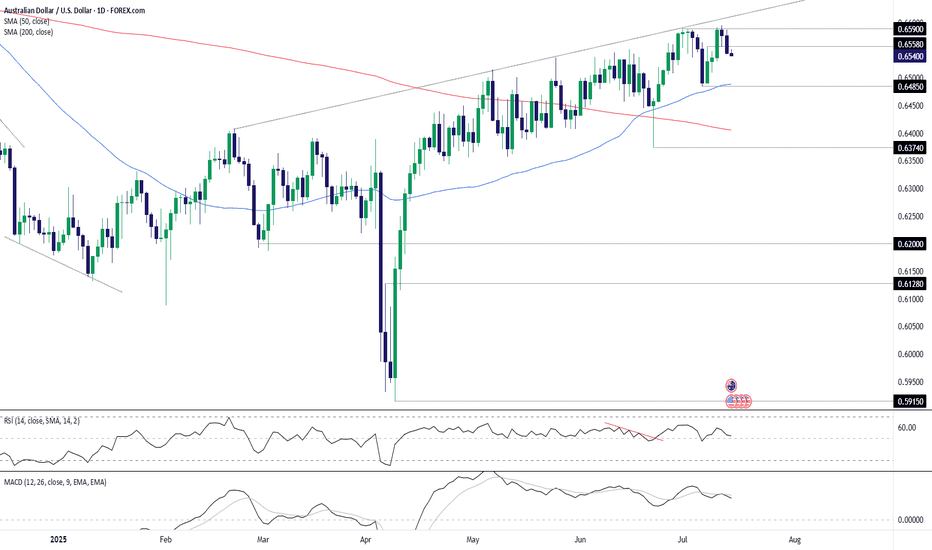
The Australian Dollar remains in an upward-sloping channel against the U.S. Dollar on the daily timeframe. Price action has recently bounced from channel support near 0.6500, a key psychological and technical level, and is attempting to regain traction within the structure. The 61.8% Fibonacci retracement of the July 2023 – April 2024 decline at 0.6558 is...
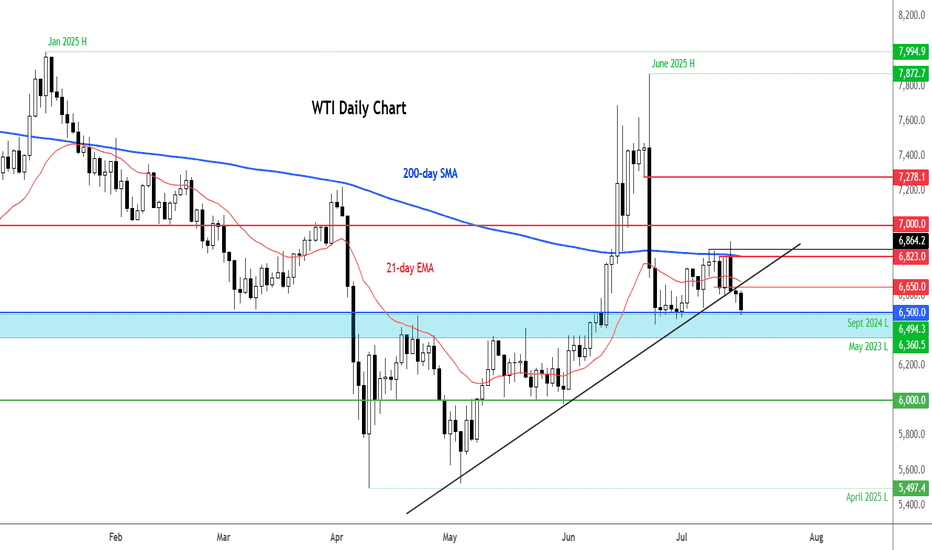
The crude oil market has entered a fragile and uncertain phase, with prices retreating from recent highs. While WTI crude is still holding above the critical $65 mark on a closing basis, it was below this handle at the time of writing. So, the overall tone remains cautious, with a bearish tilt expected to persist in the near term. Technical Outlook: WTI Breaks...
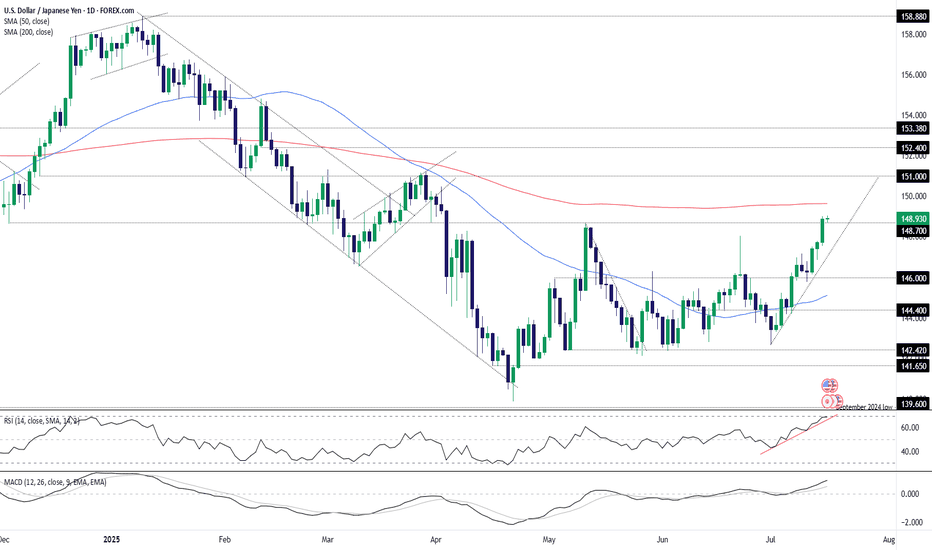
Aided by the latest leg higher for U.S. Treasury yields following the June U.S. inflation report, USD/JPY closed at the highest level since April on Tuesday, taking out the important 148.70 level in the process. If the pair manages to consolidate the break on Wednesday ahead of separate U.S. PPI data for June, the level may revert to offering support, providing a...
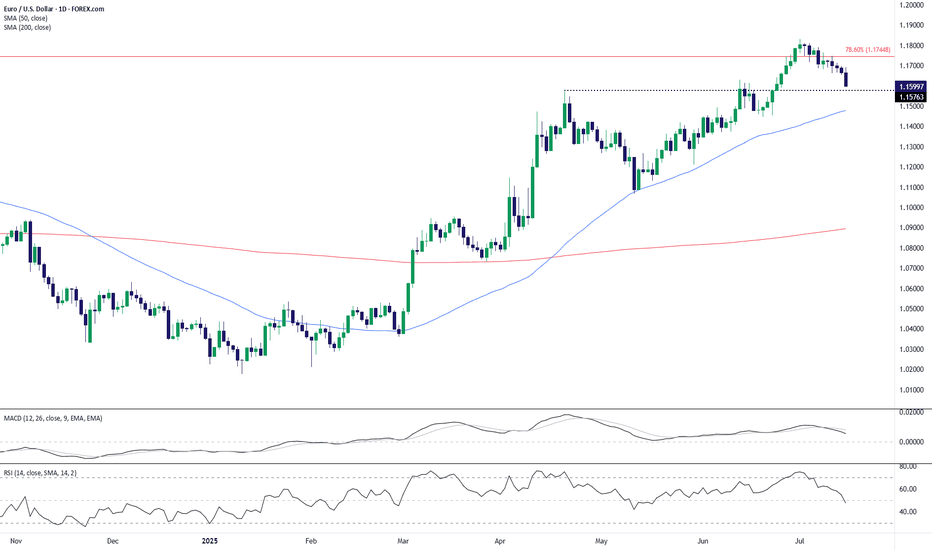
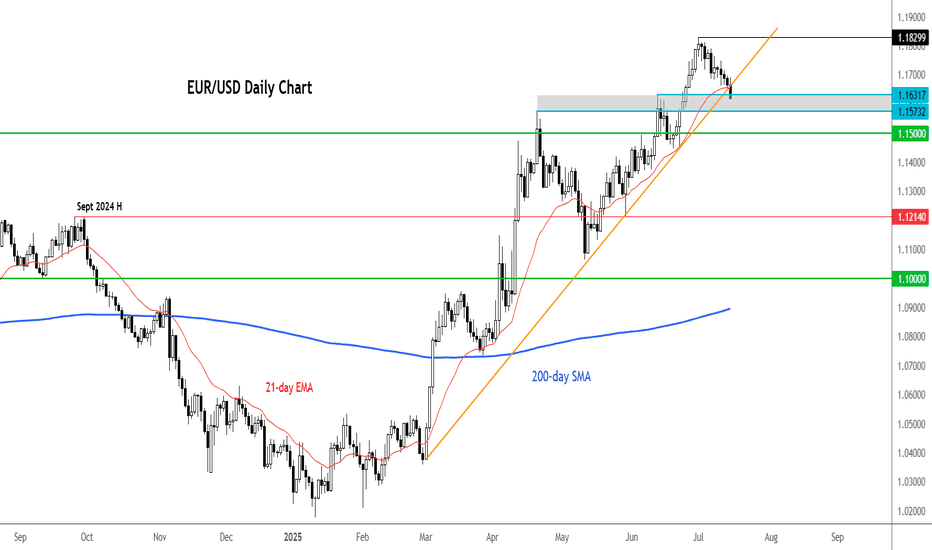
EUR/USD has broken down from its recent highs near the 1.1750 resistance area, which coincides with the 78.6% Fibonacci retracement level. The pair is now trading around the 1.1600 handle, slipping below a short-term support zone near 1.1576. This breakdown signals potential continuation of bearish pressure in the coming sessions. The 50-day SMA (1.1477) remains...
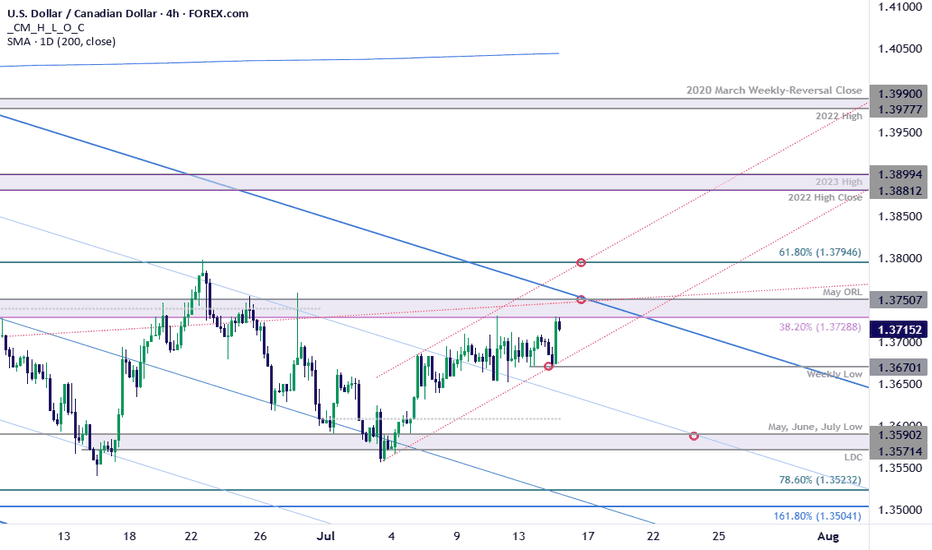
USD/CAD has rallied nearly 1.3% off the monthly low with the advance now testing resistance at 1.3729/50- a region defined by the 38.2% retracement of the 2021 rally and the May opening-range lows. Note that pitchfork resistance converges on this threshold over the next few days and further highlights the technical significance of this key zone- looking for a...
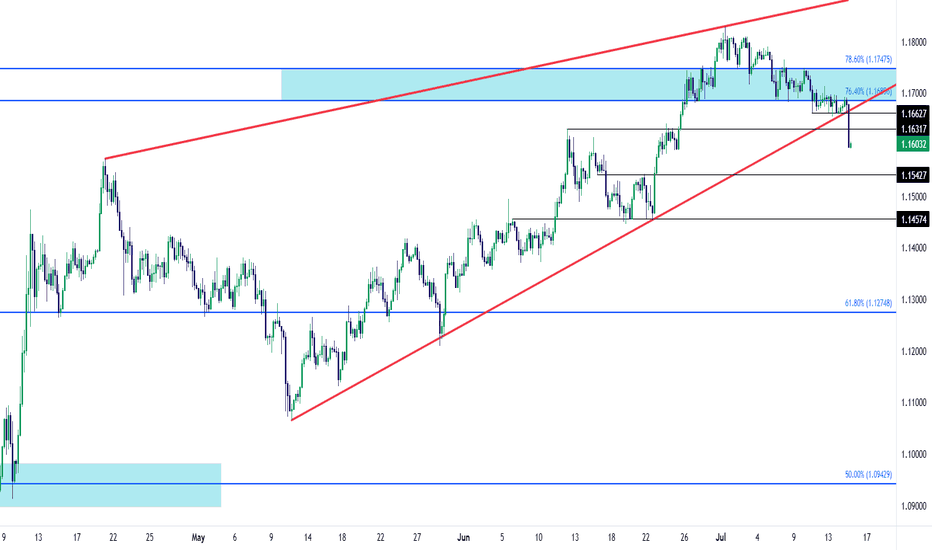
EUR/USD came into Q3 with a full head of steam, setting a fresh three-year high on the first day of the new quarter. But bulls couldn't make much progress after that and a key Fibonacci retracement continued to hold buyers at bay, until eventually sellers were able to take-over and make a more noticeable dent after this morning's CPI data. The breakout in USD...
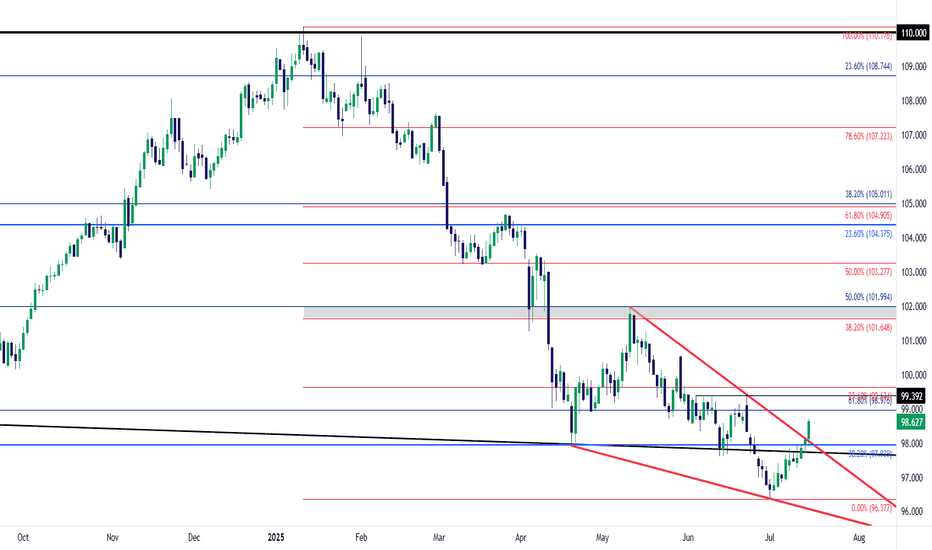
The USD showed oversold conditions via RSI on both the daily and weekly chart as we began Q3. But, so far, the new quarter has shown a change-of-pace, as the currency has continued to rally with another topside breakout today around CPI data. The breakout today happened at a big spot - as the long-term fibonacci level at 97.93 had previously helped to hold...
USD/JPY has had several large reactions to U.S. CPI prints over the past couple of years, including the reversal last July that saw more than 2,000 pips taken-out as the spillover of carry unwind hit global equity markets. As recession fears hit in the U.S. in the first-half of the year, USD/JPY was in a vulnerable state until finding support at the familiar...
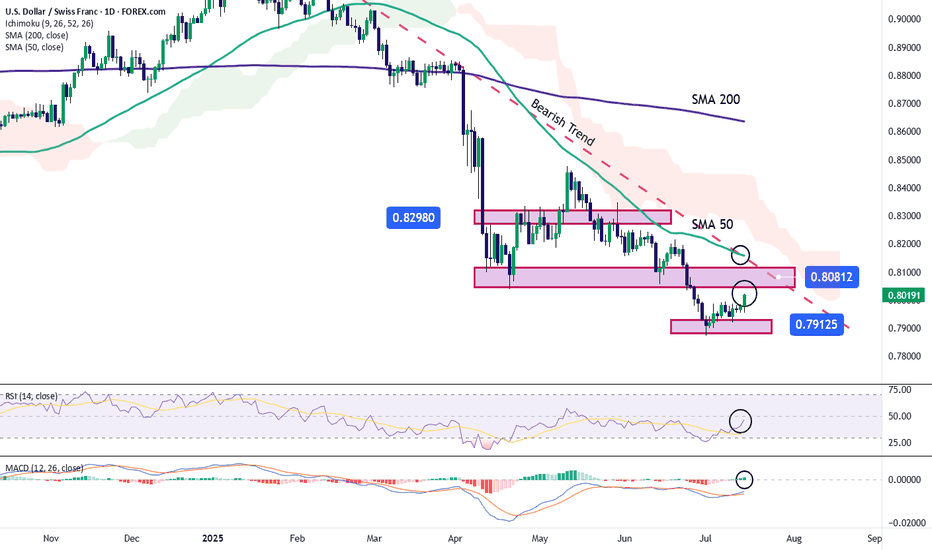
Over the past four trading sessions, the USD/CHF pair has appreciated by nearly 0.5%, as a new bullish bias has begun to consolidate on the daily chart. For now, buying pressure remains steady, supported by the recovery of the U.S. dollar, which started gaining strength shortly after it was revealed that the year-over-year CPI in the U.S. came in at 2.7%, above...
After gaining ground last week, the US dollar initially came under slight pressure earlier today. However, it regained momentum in the aftermath of a mixed US inflation report. Despite the nuanced inflation print, market expectations around interest rate policy remained largely unchanged. Investors continue to anticipate a slower pace of rate reductions, a...
The US dollar, which had gained ground last week, was under a bit of pressure earlier today. And following a mixed inflation report, the greenback spiked before returning to pre-CPI levels. The inflation report hasn’t changed market’s perception about the likely path of interest rates. US CPI comes in mixed June’s CPI rose 0.3% MoM and 2.7% YoY—hotter than...
AUD/USD has struggled on pushes towards .6600 recently, including on Monday where a bearish reversal completed a three-candle evening star pattern—a notable topping pattern. While price signals ahead of major U.S. economic data during the Northern Hemisphere summer should be treated with extra caution, in an environment where trade uncertainty and geopolitical...
Sterling broke below confluent support last week at the 61.8% retracement at of the June rally at 1.3530. The decline is now within striking distance of yearly trend support at 1.3388-1.3415- a region define by the 61.8% retracement of the May rally, the June close lows, and the 2024 high-day close. A good zone to reduce portions of short-exposure / lower...
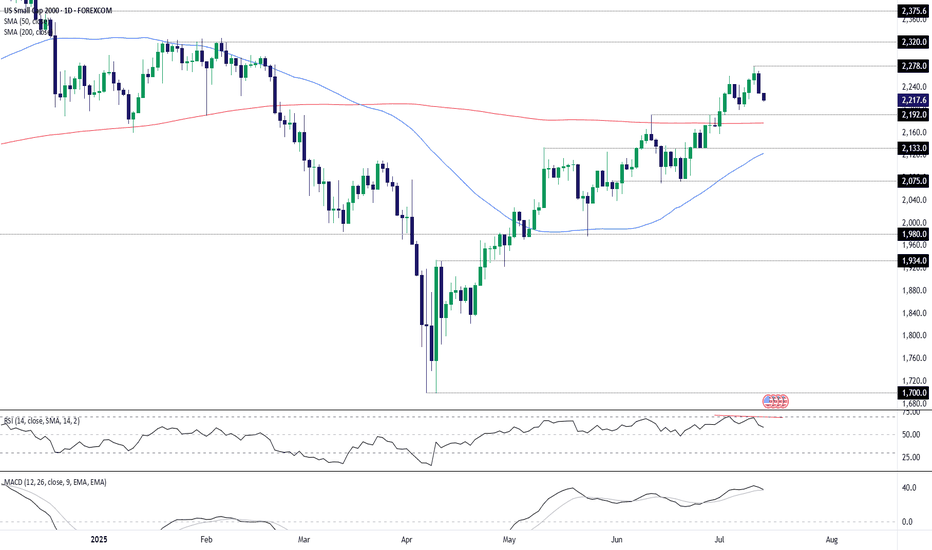
The U.S. Small Cap contract often generates reliable reversal signals, meaning the three-candle evening star pattern completed Friday should be of interest to traders, especially with bullish price momentum also showing signs of rolling over. Should the price push back towards Monday’s opening level, shorts could be established beneath the level with a stop above...
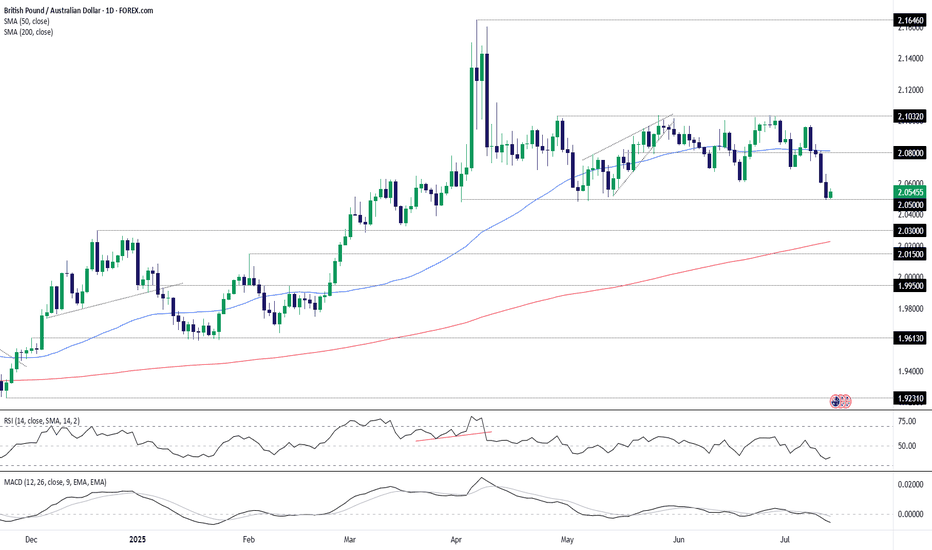
The bearish unwind in GBP/AUD stalled in familiar territory, bouncing from 2.0500 in Asian trade, continuing the pattern seen since April when Donald Trump first unveiled reciprocal tariff rates on U.S. trading partners. Now, like then, the bounce likely reflects concern about the outlook for the global economy following the unveiling of 30% tariff rates on E.U....
