Market analysis from FXCM
Price is approaching our buy entry at 138.74, which is a key level due to the 38.2% retracement and 78.6% projection, which indicates that there is fibo confluence. Our stop loss is at 137.18, at the 50% fibo retracement level, while our take profit is at 140.94, which is an overlap resistance. Price could potentially reverse and become bullish due to the...
Price is currently at our buy entry at 0.8762, and we can expect a bullish bounce off the 61.8 and 78.6% Fibo projection. Our stop loss is at 0.8657, which is slightly below the 78.6% fibo projection, and our take profit is at 0.8868, which is an overlap resistance. Please be advised that the information presented on TradingView is provided to FXCM (‘Company’,...
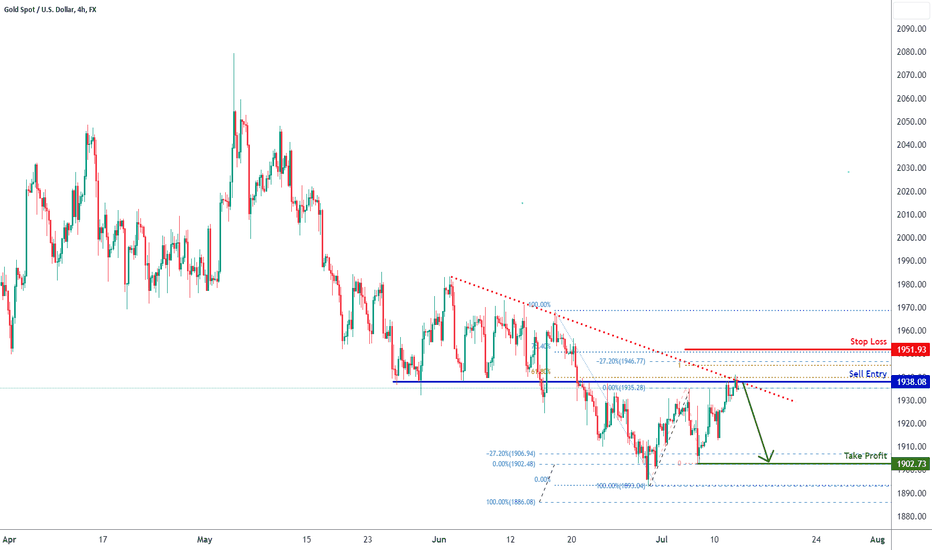
Price is testing a major resistance level which is an overlap resistance + 61.8% Fibonacci retracement. There is also a descending resistance that suggests there could be bearish momentum. A reversal from here could see prices drop to the 1902 recent swing low. Please be advised that the information presented on TradingView is provided to FXCM (‘Company’, ‘we’)...
Gold (XAUUSD) has hit the sell entry at 1938.32, which is a key overlap resistance that aligns with the 61.8% Fibonacci retracement and 78.6% Fibonacci projection levels. Price has reversed and started to drop lower towards the take profit level at 1912.55 which is an overlap support. Stop loss is set at 1956.59 which a swing-high resistance. Please be advised...
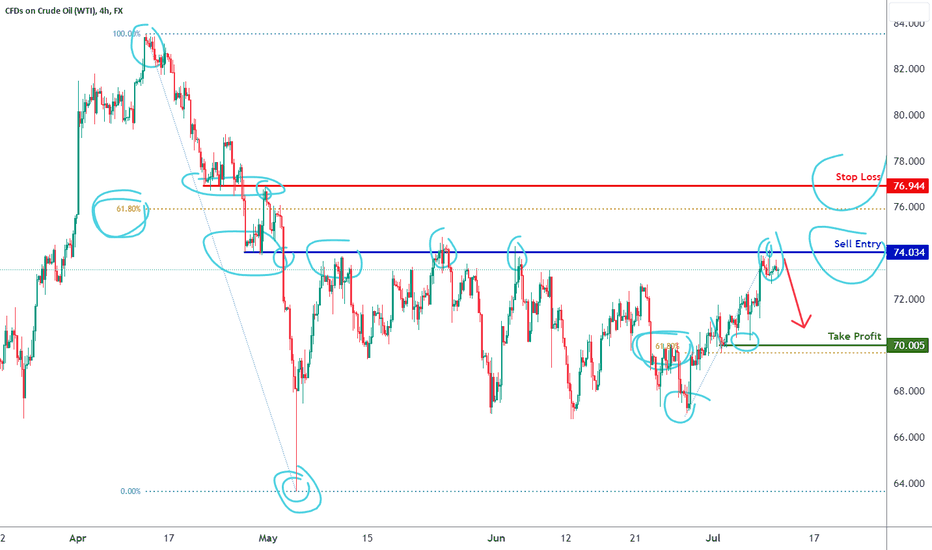
USOIL could approach a key overlap resistance and potentially reverse off this level to drop lower. The sell entry level is set at 74.034 which an overlap resistance. Stop loss is at 76.944 which is an overlap resistance that aligns above the 61.8% Fibonacci retracement level. Take profit is at 70.005 which is a pullback support that sits just above the 61.8%...
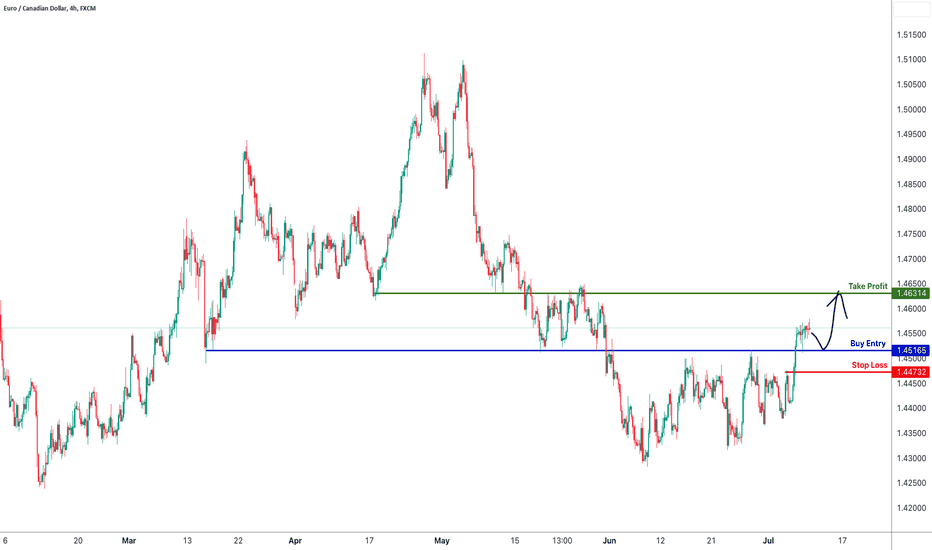
Price has broken a key resistance-turned-support at 1.4516 which forms the basis of our potential bounce - this level also happens to coincide with the 23.6% Fibonacci retracement. A bounce from here could see prices rise towards the 1.4631 level which is our next big overlap resistance. Please be advised that the information presented on TradingView is provided...
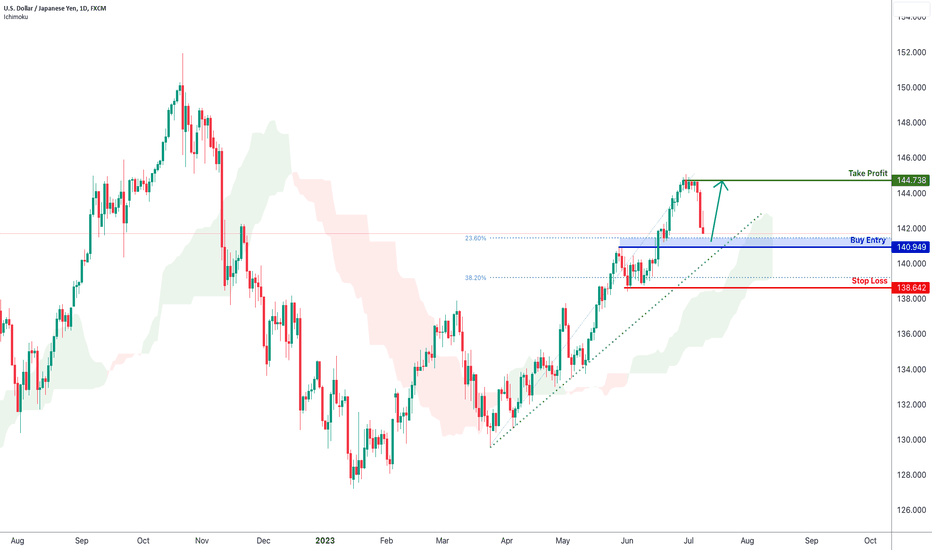
Price is approaching a major 23.6% Fibonacci retracement which also happens to line up with a pullback support. There is a fair bit of bullish momentum with an ascending support line and a bullish ichimoku cloud. A bounce from here could see prices rise to retest the recent swing high at 144.73. Please be advised that the information presented on TradingView is...
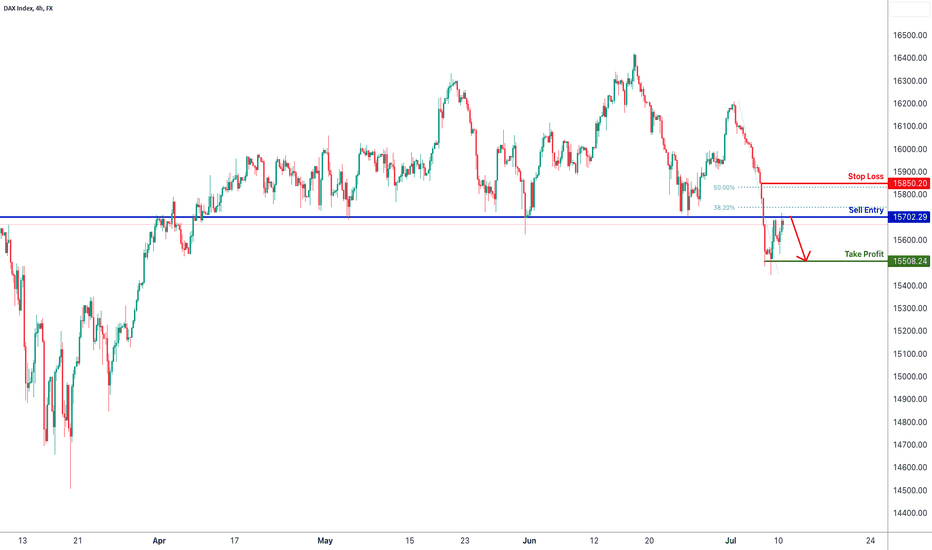
We're seeing price test a key overlap resistance at 15702 which also happens to line up with our 38.2% Fibonacci retracement. A reversal from this breakout level could see prices drop all the way down to test our recent swing low at 15508 again. We're seeing price rise towards a major overlap resistance at 0.8552 which also coincides with a 23.6% Fibonacci...
Join FXCM senior market specialist Russell Shor for Rivian chart analysis.
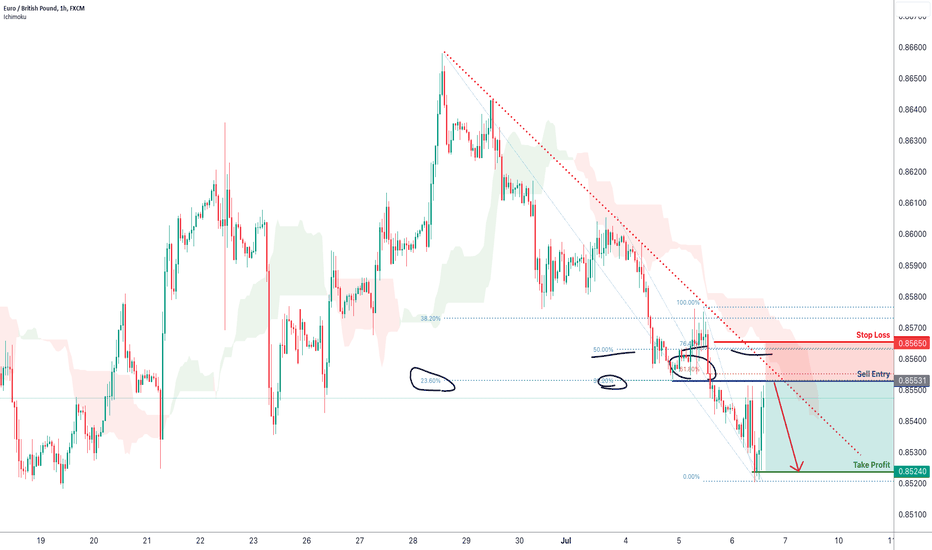
We're seeing price rise towards a major overlap resistance at 0.8552 which also coincides with a 23.6% Fibonacci retracement, 38.2% Fibonacci retracement and a shorter term 61.8% Fibonacci retracement. It's worth noting that there's a fair bit of bearish momentum too wish the descending resistant line and the bearish ichimoku cloud pushing prices down. A drop...
We're seeing price test a major overlap resistance along with a 38.2% Fibonacci retracement. A reversal from here could potentially see prices drop all the way down to our overlap support. In terms of potential stop loss levels, we're placing it slightly above te 50% Fibonacci retracement to give it a bit of breathing space. Please be advised that the...
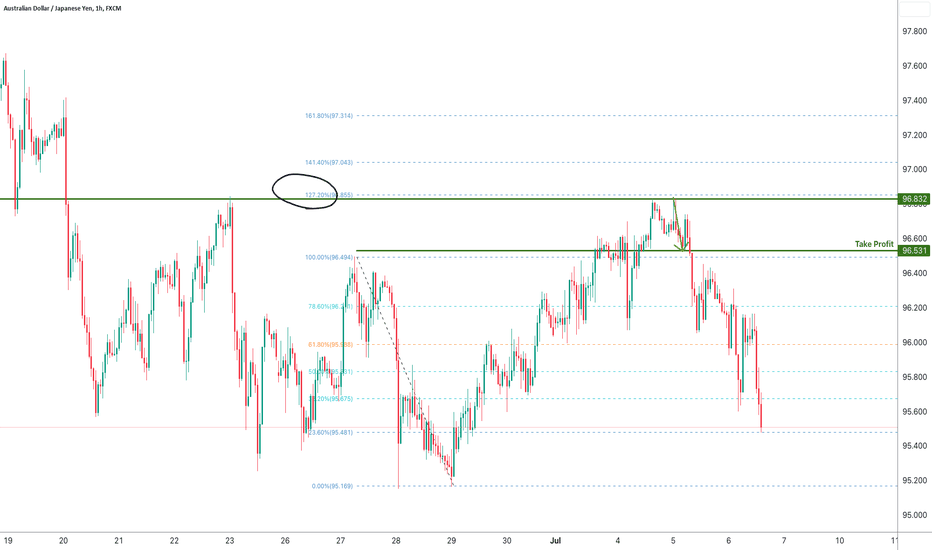
Price reversed nicely from the 96.84 level we forecasted and dropped all the way down to the support target. How did we manage to forecast this setup? Join Desmond as he breaks down the move. Please be advised that the information presented on TradingView is provided to FXCM (‘Company’, ‘we’) by a third-party provider (‘Name of third party provider). Please be...
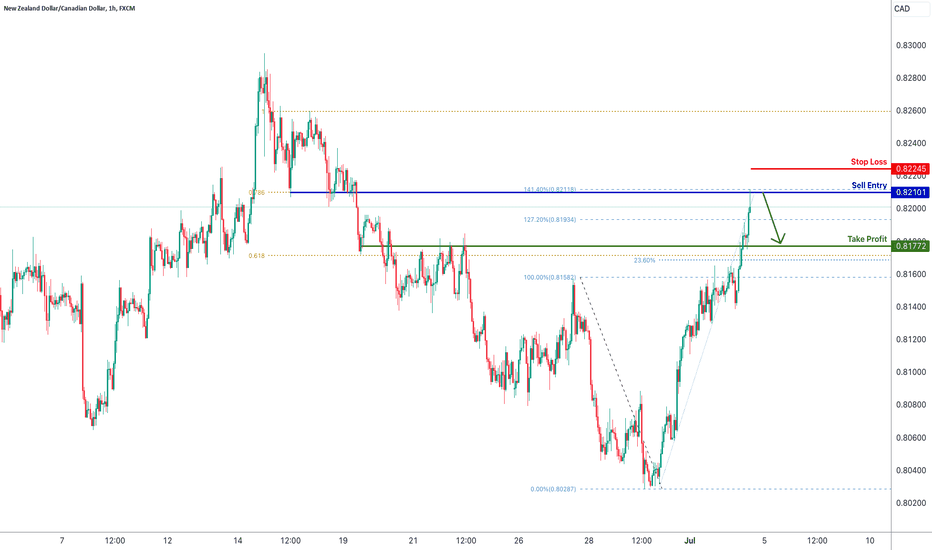
We're seeing price test a key 78.6% Fibonacci projection + an overlap resistance. We could see a reversal from here that could take prices all the way down to slightly above the 23.6% Fibonacci retracement at 0.8177. Please be advised that the information presented on TradingView is provided to FXCM (‘Company’, ‘we’) by a third-party provider (‘Name of third...
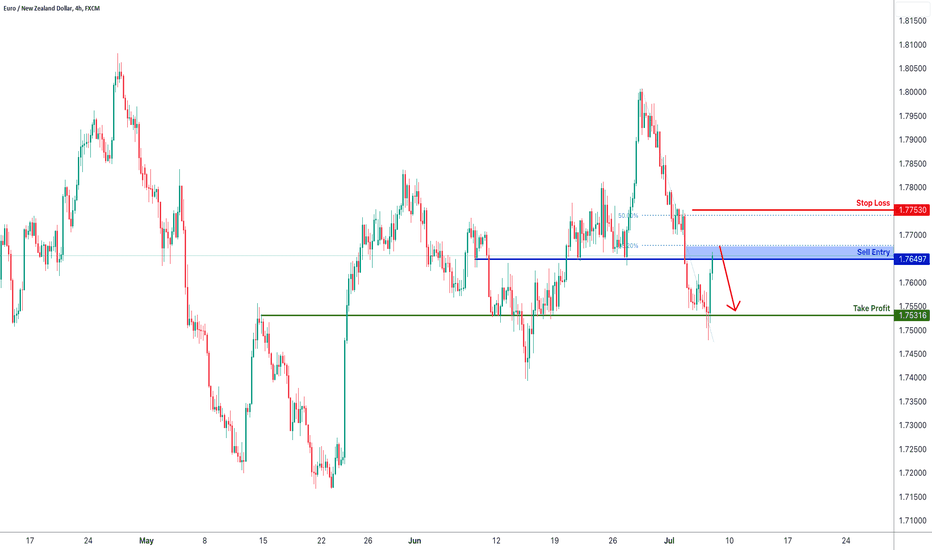
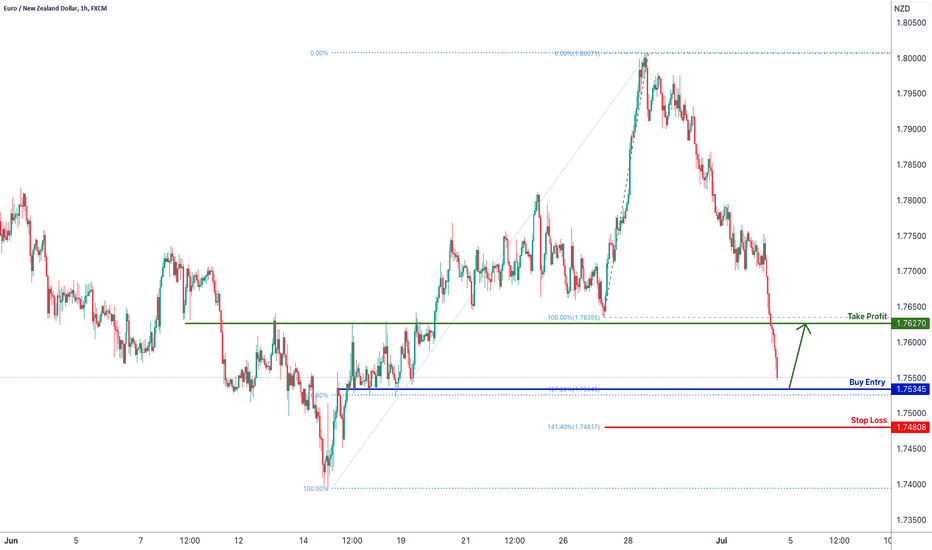
Price is approaching a key overlap support where there is a 127% Fibonacci extension and a 78.6% Fibonacci retracement. We could potentially see a bounce from here to take prices back up towards the key overlap resistance at 1.7625. Please be advised that the information presented on TradingView is provided to FXCM (‘Company’, ‘we’) by a third-party provider...
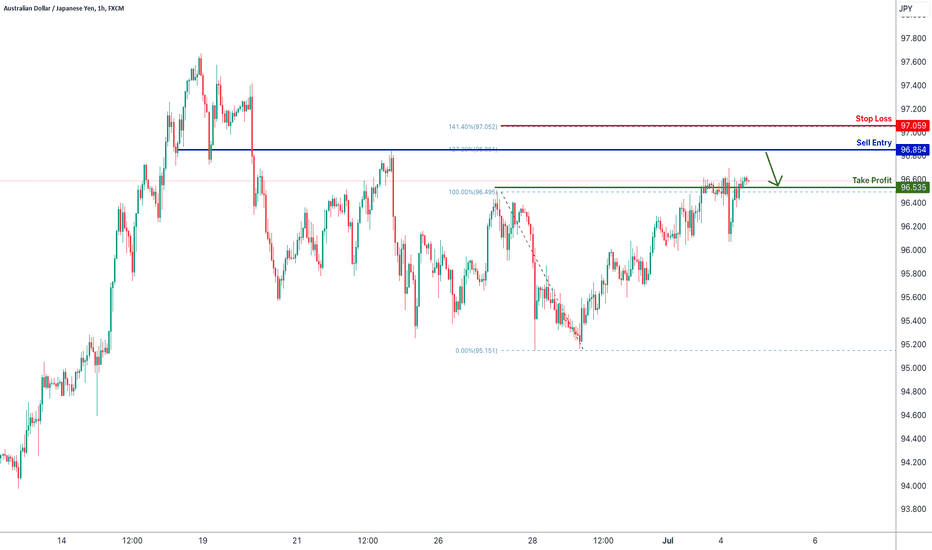
Price is approaching a big resistance at 96.85 which is an overlap resistance and a 127% Fibonacci extension. A reversal from here could see prices drop to the 96.53 level where the start of the breakout occurred. Please be advised that the information presented on TradingView is provided to FXCM (‘Company’, ‘we’) by a third-party provider (‘Name of third party...
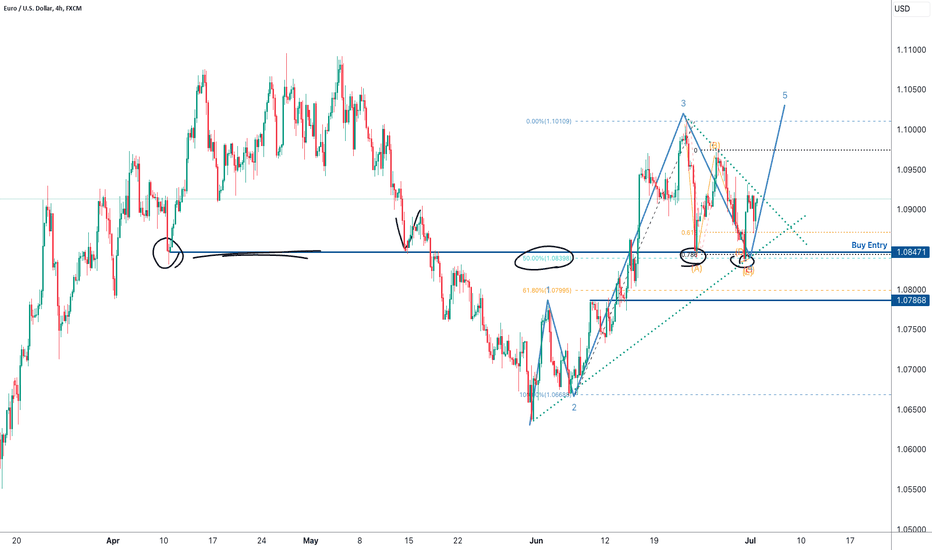
We recently saw price bounce off our 1.0840 major support level really nicely to reach the 1.0910 level which was our forecasted TP was at. Dive into all the reasons why we forecasted the bounce to draw insightful lessons! Please be advised that the information presented on TradingView is provided to FXCM (‘Company’, ‘we’) by a third-party provider (‘Name of...
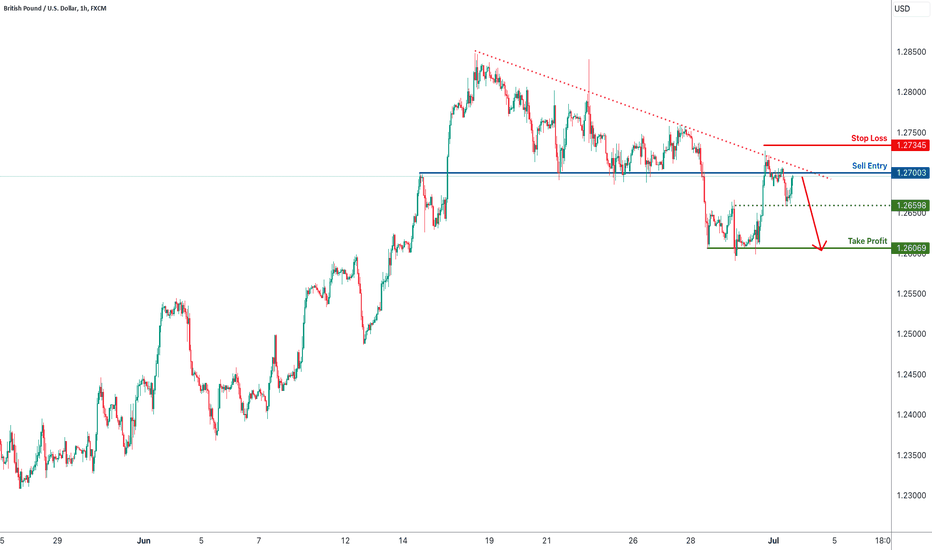
Price is testing a major overlap resistance and at the same time, seeing a bearish descending resistance line continue to weigh down on prices. A reversal from here could see prices drop all the way to the 1.2606 level - but take note that there's a risk level at 1.2659 which acts as our intermediate support. Please be advised that the information presented on...
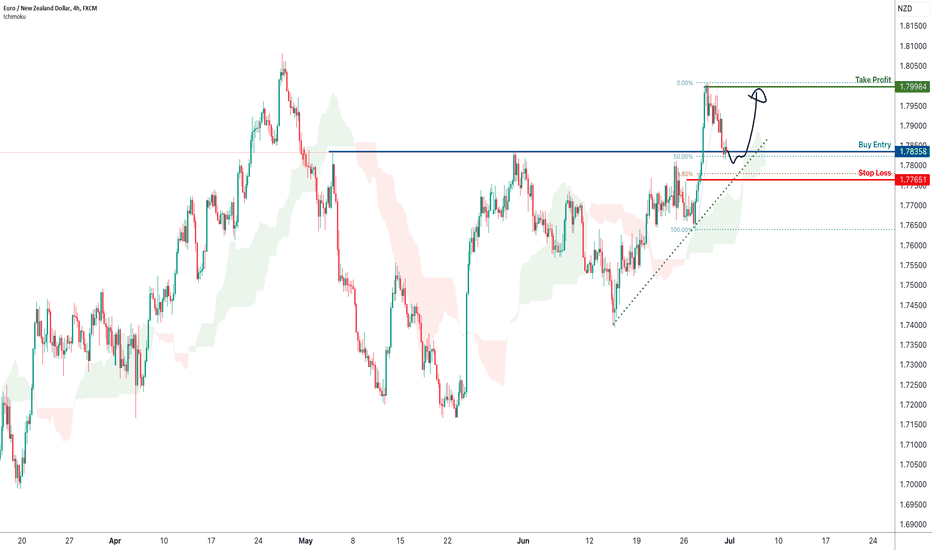
Price is testing a major overlap support at 1.7835 which happens to coincide with the 50% Fibonacci retracement. Along with that, there is a fair bit of bullish momentum with the Ichimoku cloud support and the ascending trend line. A bounce form here could take prices all the way to the recent swing high resistance at 1.7998. Please be advised that the...


