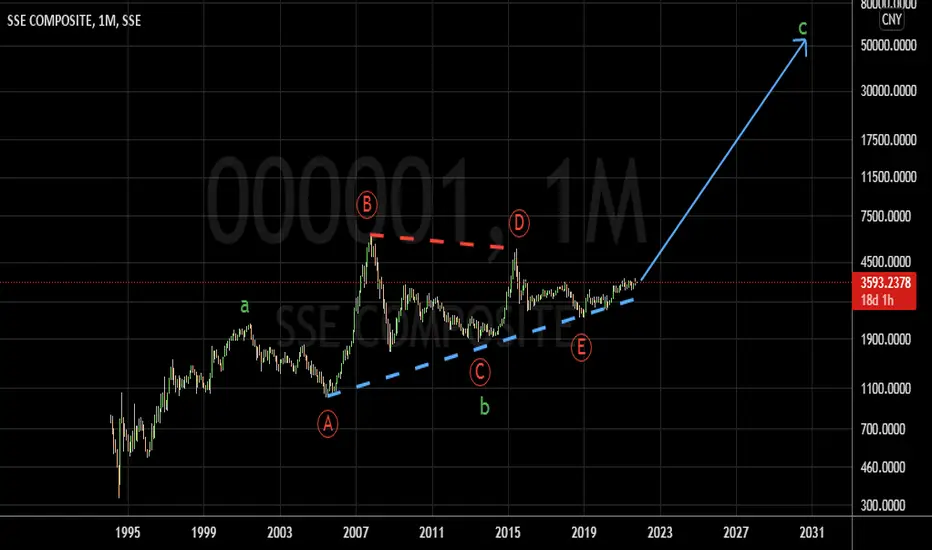
SSE ( Shanghai Stock Exchange ) chart. Shown it might completed its long term "Bullish Triangle" pattern. The Western media especially U.S Media have been debating China's Doom since many decades ago to recent "comparing" U.S Lehman brother with China's Evergrande .By checking SSE and SP500 chart.. Maybe The American should be "more worry" about their own "backyard"..
Disclaimer
The information and publications are not meant to be, and do not constitute, financial, investment, trading, or other types of advice or recommendations supplied or endorsed by TradingView. Read more in the Terms of Use.
Disclaimer
The information and publications are not meant to be, and do not constitute, financial, investment, trading, or other types of advice or recommendations supplied or endorsed by TradingView. Read more in the Terms of Use.
