📈 Summary:
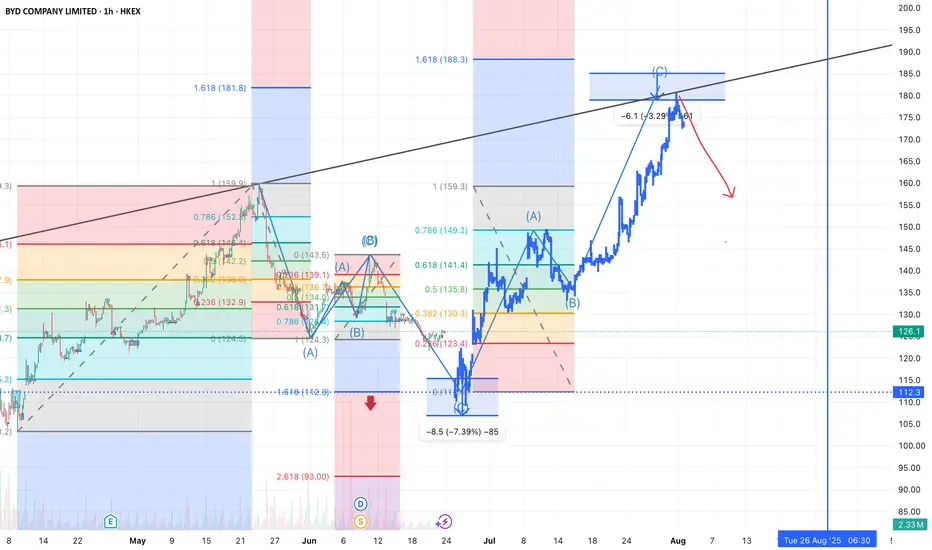
BYD has completed a clear ABC corrective structure followed by a strong impulsive wave, reaching a significant resistance zone. Multiple Fibonacci extensions and a long-term trendline converge around the 185–188 level, indicating a potential local top. The market appears overextended, and a retracement is likely.
📊 Technical Analysis:
The chart shows multiple Elliott Wave patterns, with two corrective ABC structures visible prior to the recent rally.
Price has reached the 1.618 Fibonacci extension (~188) of the previous impulse, aligning with a strong resistance zone and a long-term trendline.
A bearish rejection is starting to form around this zone, suggesting a possible trend reversal.
The red arrow indicates the projected downward move, with potential support around 135–140 and possibly down to 112.3, where the 1.618 extension of the prior correction lies.
Volume shows signs of weakening as the price climbs, often a sign of exhaustion in bullish momentum.
🔍 Key Levels:
Resistance: 185–188 (Fibo extension & trendline confluence)
Support Zones: 149.2 (0.786 retracement), 135.8 (0.5 Fibo), 123.4 (0.236), and 112.3 (1.618 extension)
📆 Timeframe: 1h chart (short- to mid-term outlook)
Disclaimer
The information and publications are not meant to be, and do not constitute, financial, investment, trading, or other types of advice or recommendations supplied or endorsed by TradingView. Read more in the Terms of Use.
Disclaimer
The information and publications are not meant to be, and do not constitute, financial, investment, trading, or other types of advice or recommendations supplied or endorsed by TradingView. Read more in the Terms of Use.