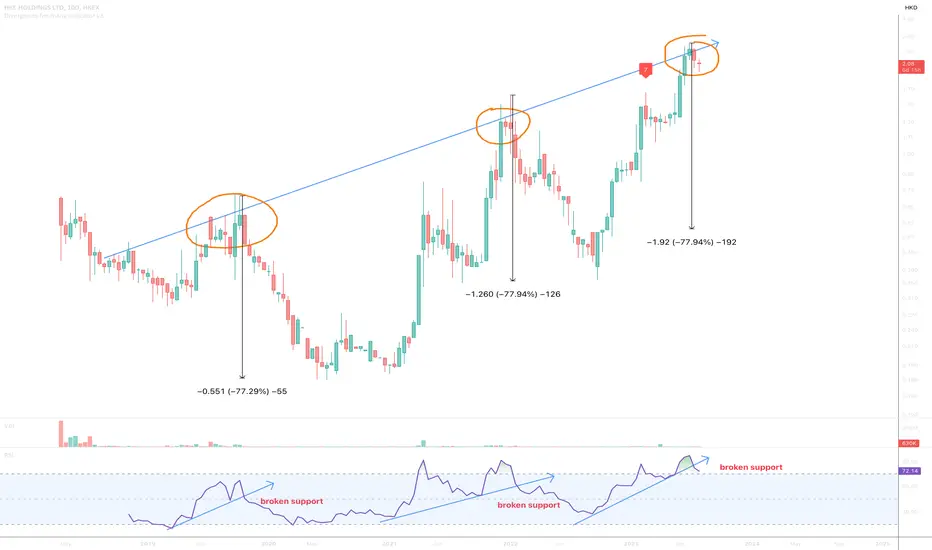
On the above 10-day chart price action has printed a 500% move since September last. Now is a excellent short opportunity. Why?
1) Price action prints at macro resistance
2) Price action prints a bearish engulfing candle
3) Broken RSI support.
Is it possible price action continues higher? Sure.
Is it probable? No.
Ww
1) Price action prints at macro resistance
2) Price action prints a bearish engulfing candle
3) Broken RSI support.
Is it possible price action continues higher? Sure.
Is it probable? No.
Ww
BTC
bc1q2eckdzh0q8vsd7swcc8et6ze7s99khhxyl7zwy
Weblink: patreon.com/withoutworries
Allow 3-6 months on ideas. Not investment advice. DYOR
bc1q2eckdzh0q8vsd7swcc8et6ze7s99khhxyl7zwy
Weblink: patreon.com/withoutworries
Allow 3-6 months on ideas. Not investment advice. DYOR
Disclaimer
The information and publications are not meant to be, and do not constitute, financial, investment, trading, or other types of advice or recommendations supplied or endorsed by TradingView. Read more in the Terms of Use.