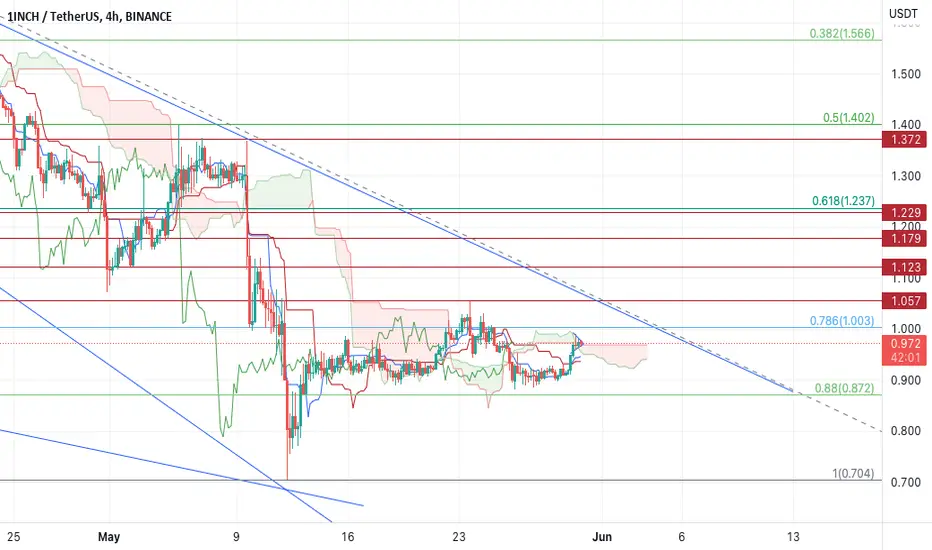
I was gonna put a long position on this chart, but for a stop loss you guys can be reasonable. In terms of targets, I think the overhead diagonal resistance is one to watch but I think that price could very much sail through this resistance and to one of the overhead price action historical price resistance or fib level.
I know bitcoin is looking wobbly and we aren't sure if we are going to get another leg up from the recent up swing right away or not, but the 1INCH/BTC chart looks really good and looks like it has bottomed, and looks nice a flat, with a break to the upside on the 1hour chart with ichimoku.
I know bitcoin is looking wobbly and we aren't sure if we are going to get another leg up from the recent up swing right away or not, but the 1INCH/BTC chart looks really good and looks like it has bottomed, and looks nice a flat, with a break to the upside on the 1hour chart with ichimoku.
Note
Note
Note
Disclaimer
The information and publications are not meant to be, and do not constitute, financial, investment, trading, or other types of advice or recommendations supplied or endorsed by TradingView. Read more in the Terms of Use.
Disclaimer
The information and publications are not meant to be, and do not constitute, financial, investment, trading, or other types of advice or recommendations supplied or endorsed by TradingView. Read more in the Terms of Use.