🔎 Overview
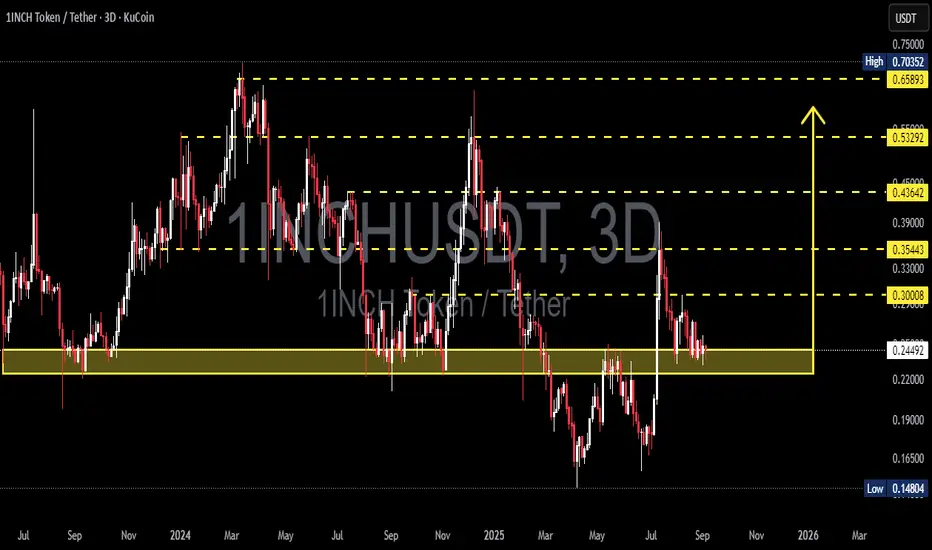
Currently, 1INCH/USDT is trading around $0.2449, sitting right above the key demand zone at $0.21–$0.25 (yellow box). This level has repeatedly acted as a major support, preventing further downside.
On the 3D timeframe, price action shows extended corrective structure after a strong downtrend. This zone is now a make-or-break area: will it turn into an accumulation base for a new bullish cycle, or become a distribution zone before further decline?
---
📌 Market Structure & Price Action
Mid-term trend: still forming lower highs → bias remains neutral-to-bearish until reversal signs appear.
Yellow zone ($0.21–$0.25): major demand zone, repeatedly tested with strong rebounds.
Deep wick spikes → liquidity grabs / stop-hunts before price recovery.
Currently consolidating sideways above demand → market waiting for the next decisive move.
---
🟢 Bullish Scenario
For bullish confirmation, price needs:
1. Hold above $0.21–$0.25 zone.
2. Break & close 3D above $0.30 → early reversal confirmation.
3. Establish higher highs & higher lows → sign of trend shift.
📈 Upside targets:
R1: $0.300
R2: $0.354
R3: $0.436
R4: $0.532
R5: $0.659 – $0.703
With strong momentum, the $0.65–$0.70 zone could act as a mid-term price magnet.
---
🔴 Bearish Scenario
For bearish continuation, price needs:
1. 3D close below $0.21 with volume.
2. Failed retest (previous support flips into resistance).
📉 Downside targets:
S1: $0.190
S2: $0.165
S3: $0.148 (major low on chart)
Breaking below $0.148 would heavily weaken long-term structure for buyers.
---
🎯 Trading Approach & Risk Management
Swing setup: Long from $0.22–$0.24 with stop below $0.195 → target $0.30+.
Breakout setup: Wait for 3D close > $0.305, enter on retest → target $0.354+.
Short setup: Only valid if 3D close < $0.205 with failed retest → targets $0.165–$0.148.
⚠️ Risk note: Keep per-trade risk under 1–3% of capital. Always use stop losses.
---
📊 Key Levels
Main demand/support: $0.21–$0.25
Major resistances: $0.30 → $0.35 → $0.43 → $0.53 → $0.65–0.70
Critical low: $0.148
---
✨ Conclusion
1INCH/USDT is at a decisive crossroads.
Holding the $0.21–$0.25 zone could trigger a bounce toward $0.30 and potentially higher. However, a confirmed breakdown below $0.21 exposes the market to deeper correction toward $0.19–$0.148.
Traders should carefully watch the 3D candle close and volume confirmation before committing to directional trades.
---
#1INCH #1INCHUSDT #CryptoAnalysis #Altcoin #TechnicalAnalysis #CryptoTrading #PriceAction #SwingTrading #BreakoutSetup
✅ Get Free Signals! Join Our Telegram Channel Here: t.me/TheCryptoNuclear
✅ Twitter: twitter.com/crypto_nuclear
✅ Join Bybit : partner.bybit.com/b/nuclearvip
✅ Benefits : Lifetime Trading Fee Discount -50%
✅ Twitter: twitter.com/crypto_nuclear
✅ Join Bybit : partner.bybit.com/b/nuclearvip
✅ Benefits : Lifetime Trading Fee Discount -50%
Disclaimer
The information and publications are not meant to be, and do not constitute, financial, investment, trading, or other types of advice or recommendations supplied or endorsed by TradingView. Read more in the Terms of Use.