With HSBC improving its ratings about the Luxury Sector and upgrading  LVMHF we could see a strong comeback and a great investment opportunity.
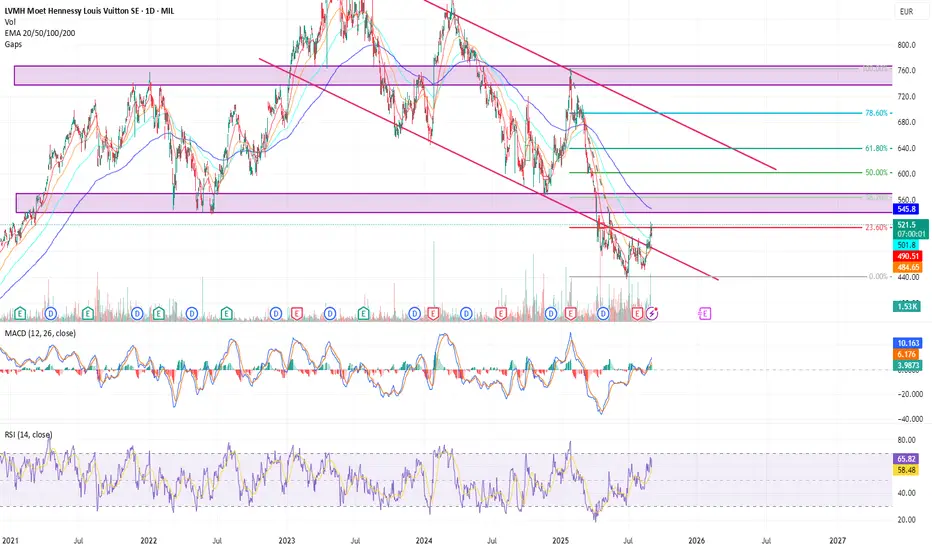
Trend:
- Price has been in a downtrend channel (the two pink descending parallel lines) since mid-2021.
- It recently bounced from the lower channel and, after retesting the resistance line on several occasions, finally managed to break through.
Support & Resistance (purple zones):
- Around 540–570 = strong historical support zone (price bounced there recently).
- Around 735–765 = major resistance.
Fibonacci Levels:
- Price has broken through the 23.6% level and, if momentum holds, could test the 38.2% Fibonacci level (which also aligns with the purple resistance).
- If the stock manages to break through, it could rally further from there.
Moving Averages:
- The stock has broken above the 20/50 and 100 EMA, showing short- to medium-term bullish momentum, and is now approaching the 200 EMA — the real test.
- The 200 EMA sits right at the resistance level mentioned above (purple zone / Fibonacci 38.2%), making this a highly significant area.
Other technicals:
- The MACD has turned positive with bullish momentum.
- RSI is around 65, showing healthy bullish strength without being overbought.
- No unusual volume spikes, which suggests the move is driven by steady momentum rather than a random spike.
Disclaimer
The information and publications are not meant to be, and do not constitute, financial, investment, trading, or other types of advice or recommendations supplied or endorsed by TradingView. Read more in the Terms of Use.
Disclaimer
The information and publications are not meant to be, and do not constitute, financial, investment, trading, or other types of advice or recommendations supplied or endorsed by TradingView. Read more in the Terms of Use.