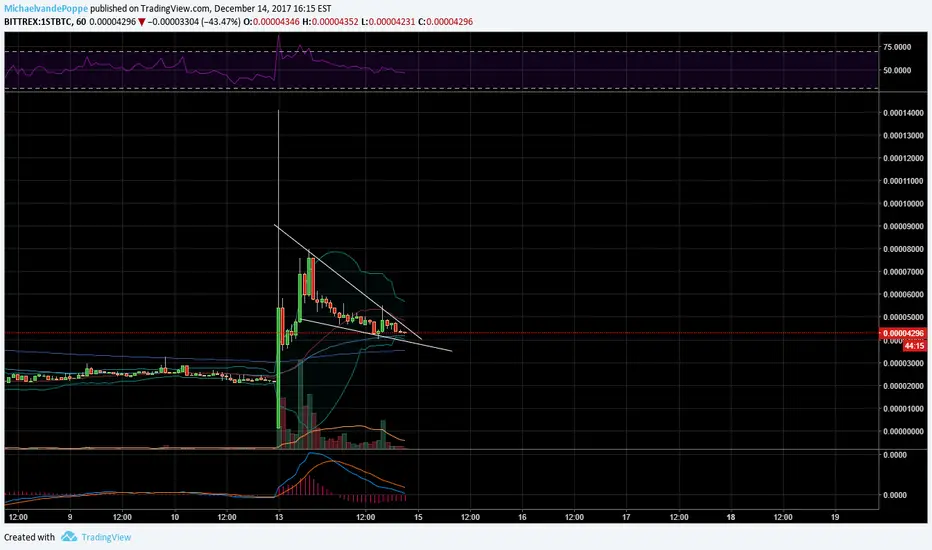
1ST 1H Timeframe Chart 14 December 2017
Firstblood, or 1ST as you might say it.
Very interesting territory. Retraced all the way back after the nice jump yesterday. EMA's crossed and it's now on support --> EMA. Bollinger getting close as well, which might indicate a nice jump coming soon. Also, it's in a falling wedge, which might indicate a nice jump out of it soon as well.
I'm buying with a stop/loss set for this one.
Disclaimer
The information and publications are not meant to be, and do not constitute, financial, investment, trading, or other types of advice or recommendations supplied or endorsed by TradingView. Read more in the Terms of Use.
Disclaimer
The information and publications are not meant to be, and do not constitute, financial, investment, trading, or other types of advice or recommendations supplied or endorsed by TradingView. Read more in the Terms of Use.