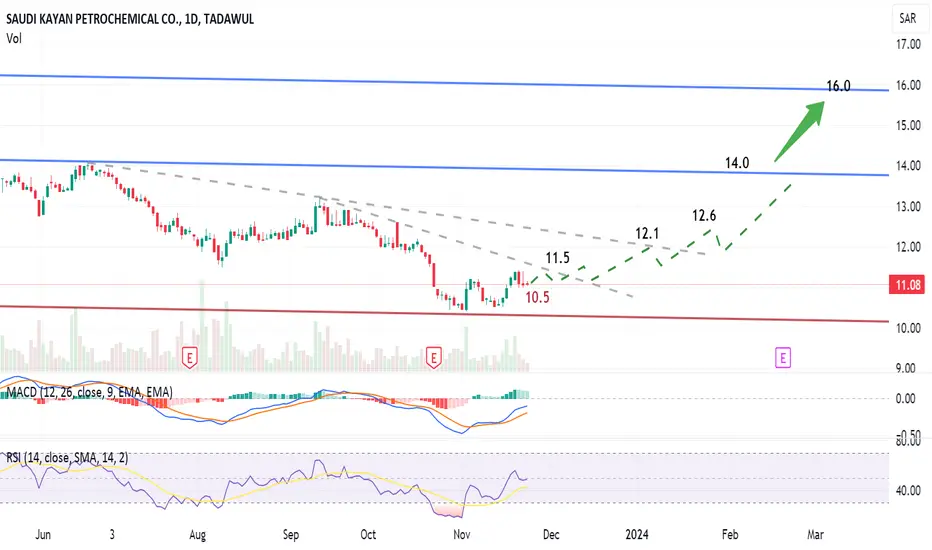
Saudi Kayan (2350), on the daily chart, I see a forming pattern, going up on a zigzag until 14, then some correction and next target is 16
Quick tradings can be done buy at support / sell at resistance, and so on until reaching the target.
The technical indicators RSI and MACD are supporting this view.
Stop loss at 10.7 should be considered.
Quick tradings can be done buy at support / sell at resistance, and so on until reaching the target.
The technical indicators RSI and MACD are supporting this view.
Stop loss at 10.7 should be considered.
Disclaimer
The information and publications are not meant to be, and do not constitute, financial, investment, trading, or other types of advice or recommendations supplied or endorsed by TradingView. Read more in the Terms of Use.
Disclaimer
The information and publications are not meant to be, and do not constitute, financial, investment, trading, or other types of advice or recommendations supplied or endorsed by TradingView. Read more in the Terms of Use.