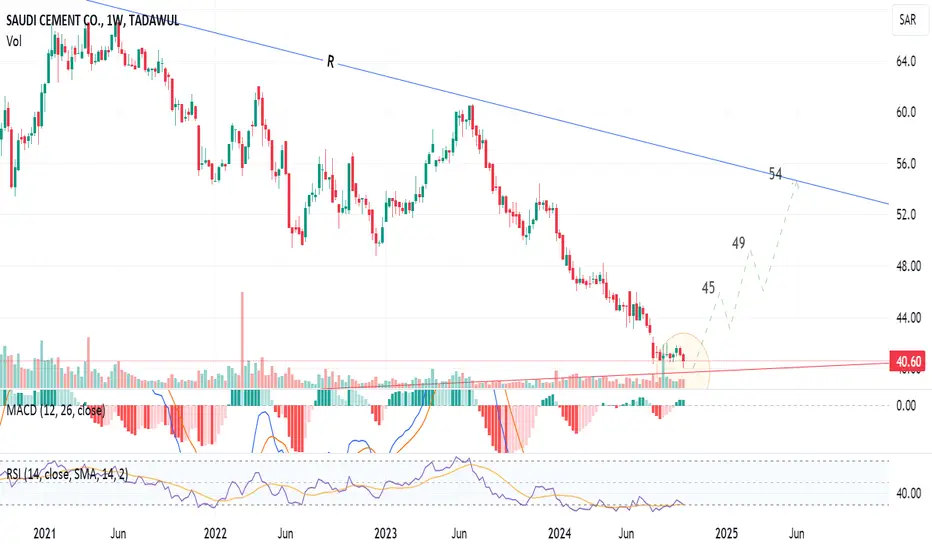
Weekly chart, the stock  3030 has been falling for long time, and is near the long-term support line S (around 39.9).
On the intra-day time-frame, the indicators MACD and RSI are showing the rebound has started.
The price should target the Resistance line R - at around 54 passing through resistance levels at 45 and 49
A safer new buy entry can be above 42 - with the Stop Loss below 40
Closing below the Support line S, the stop loss should be considered.
Disclaimer
The information and publications are not meant to be, and do not constitute, financial, investment, trading, or other types of advice or recommendations supplied or endorsed by TradingView. Read more in the Terms of Use.
Disclaimer
The information and publications are not meant to be, and do not constitute, financial, investment, trading, or other types of advice or recommendations supplied or endorsed by TradingView. Read more in the Terms of Use.