TASI, 4013, Dr Sulaiman Al-Habib Medi Srvcs Grp Co TADAWUL
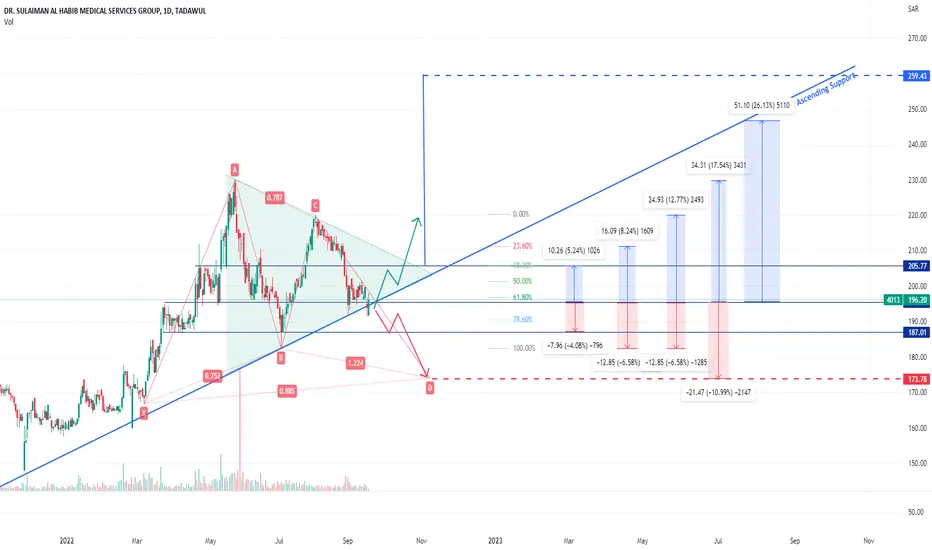
4013 is ranging within symmetrical triangle
Touching bottom ascending trendline support (Very strong support since 2020)
Expected Fib retracement between 61.8% and 78.6%
Everytime it touch Ascending trendline support, it bounce
Biased: Bullish
There can be two possible scenarios
1) Bullish:
Short bullish trade until top descending trendline resistance.
Breakout (after reaching top descending trendline resistance)
Further Long position can be taken if bulls managed to close above upper wedge
(Trail your stop loss)
2) Bearish Rejection (Breakdown of symmetrical triangle)
If bearish candles formed breaking the lower support.
Trade your levels accordingly.
Trade active
TP1 hitTrade active
TP2 and TP3 hitDisclaimer
The information and publications are not meant to be, and do not constitute, financial, investment, trading, or other types of advice or recommendations supplied or endorsed by TradingView. Read more in the Terms of Use.
Disclaimer
The information and publications are not meant to be, and do not constitute, financial, investment, trading, or other types of advice or recommendations supplied or endorsed by TradingView. Read more in the Terms of Use.