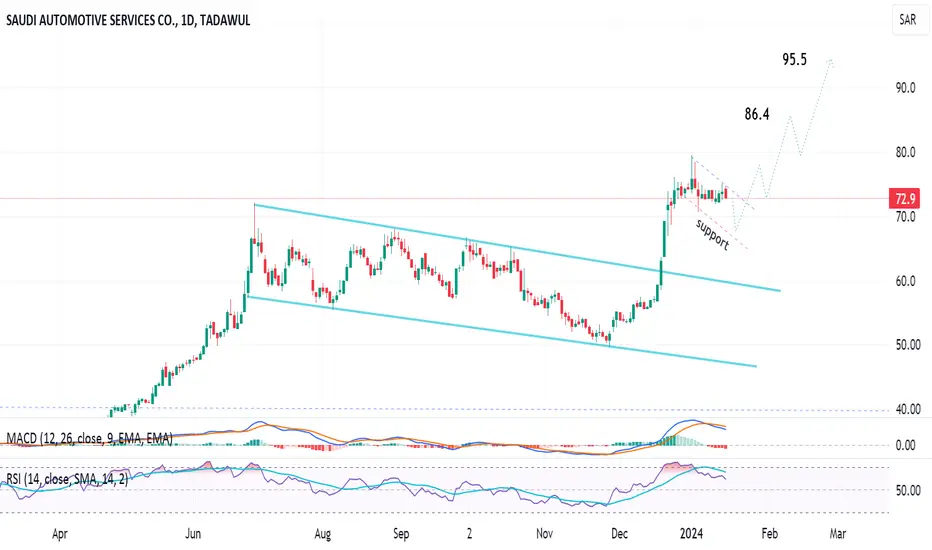
Daily chart, the stock may form a flag chart pattern, then the target will be 95.5, passing through the resistance level of 86.4 (historical highest high)
Technical indicators RSI and MACD show that it is time for some correction. Then, the stock continues the uptrend.
Support line (dashed red) should be considered as stop loss level.
Technical indicators RSI and MACD show that it is time for some correction. Then, the stock continues the uptrend.
Support line (dashed red) should be considered as stop loss level.
Trade active
Trade closed: target reached
The outcome was in line with the technical analysis and chart :)Disclaimer
The information and publications are not meant to be, and do not constitute, financial, investment, trading, or other types of advice or recommendations supplied or endorsed by TradingView. Read more in the Terms of Use.
Disclaimer
The information and publications are not meant to be, and do not constitute, financial, investment, trading, or other types of advice or recommendations supplied or endorsed by TradingView. Read more in the Terms of Use.