Today, we have a technical analysis on I-SCREAM MEDIA using RSI Divergence.
I used a "RSI Divergence" indicator created by Shizaru,
which compares a difference between fast RSI and slow RSI.
The default period for fast RSI is 5 and slow, 14.
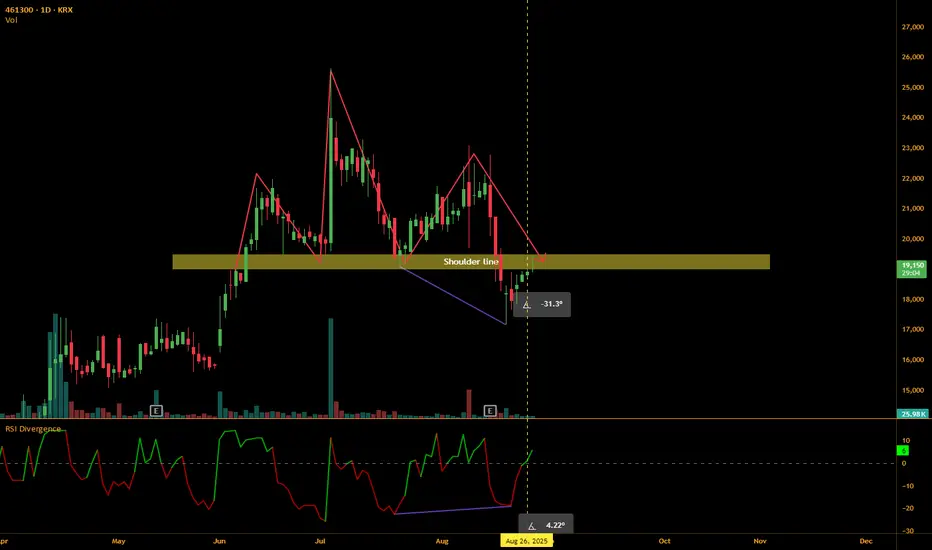
In the chart, we see price going downtrend, making lower lows while RSI difference makes higher low.
RSI difference closing to zero line indicates that the selling pressure is losing its momentum and might signal the beginning of the bullish movement.
We then see RSI difference breaking through the zero line, which is a good bullish signal.
However, because there's a price action zone from 19,000 to 19,500,
watching the price movements further before entering might be wise.
If the price manages to pass the test and break through the zone, then might be a good time to enter.
I used a "RSI Divergence" indicator created by Shizaru,
which compares a difference between fast RSI and slow RSI.
The default period for fast RSI is 5 and slow, 14.
In the chart, we see price going downtrend, making lower lows while RSI difference makes higher low.
RSI difference closing to zero line indicates that the selling pressure is losing its momentum and might signal the beginning of the bullish movement.
We then see RSI difference breaking through the zero line, which is a good bullish signal.
However, because there's a price action zone from 19,000 to 19,500,
watching the price movements further before entering might be wise.
If the price manages to pass the test and break through the zone, then might be a good time to enter.
God bless you :)
Disclaimer
The information and publications are not meant to be, and do not constitute, financial, investment, trading, or other types of advice or recommendations supplied or endorsed by TradingView. Read more in the Terms of Use.
God bless you :)
Disclaimer
The information and publications are not meant to be, and do not constitute, financial, investment, trading, or other types of advice or recommendations supplied or endorsed by TradingView. Read more in the Terms of Use.