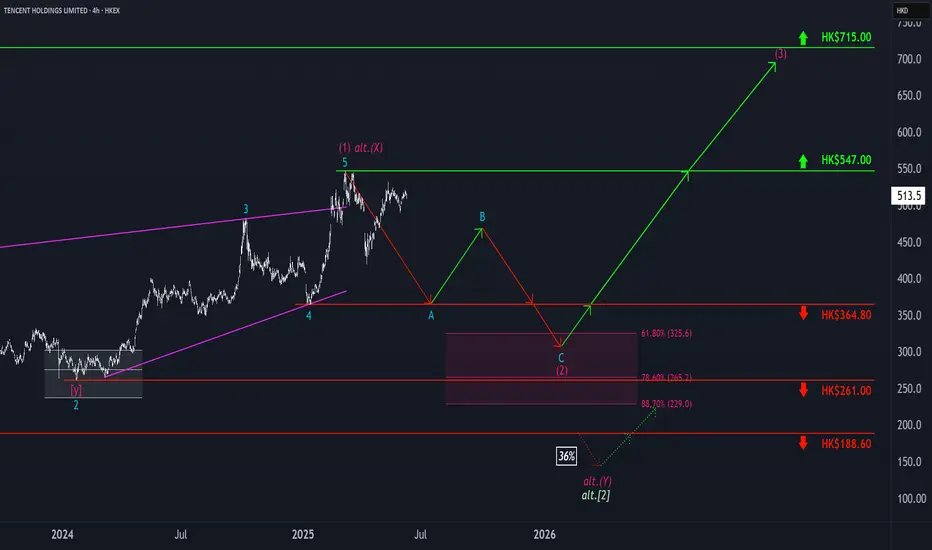
Tencent’s corrective A-B-C structure is struggling to finish wave A. Our primary scenario calls for a drop toward support at HK$364.80, where wave A should bottom. That should open the door for wave B, followed by a deeper leg down in wave C—into the magenta Long Target Zone between HK$325.60 and HK$229.00. This zone should mark the completion of wave (2), setting up a long-term bullish reversal in wave (3), which may eventually target resistance at HK$715. However, if price breaks below HK$188.60, our wave alt.[2] scenario will take over (36% probability), signaling an even deeper low before the next bullish impulse.
📈 Over 190 precise analyses, clear entry points, and defined Target Zones - that's what we do.
📈 Over 190 precise analyses, clear entry points, and defined Target Zones - that's what we do.
📊 Free daily market insights combining macro + Elliott Wave analysis
🚀 Spot trends early with momentum, sentiment & price structure
🌐 Join thousands trading smarter - full free analyses at dailymarketupdate.com
🚀 Spot trends early with momentum, sentiment & price structure
🌐 Join thousands trading smarter - full free analyses at dailymarketupdate.com
Related publications
Disclaimer
The information and publications are not meant to be, and do not constitute, financial, investment, trading, or other types of advice or recommendations supplied or endorsed by TradingView. Read more in the Terms of Use.